A&A 474, 639-645 (2007)
DOI: 10.1051/0004-6361:20077396
T. Kasuga1,3 - T. Iijima2 - J. Watanabe3
1 - Institute for Astronomy (IfA), University of Hawaii, 2680 Woodlawn Drive, Honolulu, Hawaii 96822-1897, USA
2 - Obseservatorino Astrofisico, 36012 Asiago (Vi), Italy
3 - National Astronomical Observatory of the Japan (NAOJ), National Institute of Natural Science, 2-21-1 Osawa, Mitaka, Tokyo 181-8588, Japan
Received 2 March 2007 / Accepted 13 June 2007
Abstract
Context. It has been thought that fast-moving meteor spectra consist of only two excitation temperature regimes: the 5000 K main component and another hot component at 10 000 K. This belief does not always satisfy observed spectra due to the lack of sufficient physical correlation among derived excitation temperatures, observed fluxes, upper energy levels (![]() ), and Einstein A coefficients (
), and Einstein A coefficients (
![]() )
of each spectral emission line.
)
of each spectral emission line.
Aims. This work tries to correlate them and discovery new excitation temperature regimes in meteor spectra in the visual to near IR wavelength region.
Methods. We focus on the upper energy levels and Einstein A coefficients of observed spectral emission lines. A model fitting the first positive band of nitrogen (![]() )
and total number of Si II under quasi-neutral conditions proved the key to identifying of new components.
)
and total number of Si II under quasi-neutral conditions proved the key to identifying of new components.
Results. We have identified two new excitation temperature regions in meteor spectra. One is a Mid component at 8000 K for ![]() and another a Jet component above 10 000 K for Si II. This breakthrough has allowed us to reproduce the meteor spectrum.
and another a Jet component above 10 000 K for Si II. This breakthrough has allowed us to reproduce the meteor spectrum.
Conclusions. The spectra of high-speed meteors may consist of more than two excitation temperature regions including the main, Mid, hot, and Jet components.
Key words: meteors, meteoroids
Many photographic and video-television techniques have been applied to meteor spectroscopy using slit less instruments. These studies have provided insight into the physical and chemical properties of meteoroids in meteor showers under a simple thermal equilibrium model (Ceplecha et al. 1998). Slit less and small instruments provide a wide field of view (FOV) and high statistics but a low-dispersion spectra data set. On the other hand, big telescopes can provide high-quality spectra with relatively high dispersion but with the problem of their smalls field of view (FOVs). The unpredictability of a meteor's appearance, position and their short duration rarely allow us to capture meteor spectra data on big telescopes. Therefore, it is most common to use small instruments and wait till bright meteors pass through the wide FOV - in other words, spectroscopic observations of meteors depend on "luck''.
![\begin{figure}
\par\includegraphics[width=5.6cm,clip]{7396fig1.eps}\end{figure}](/articles/aa/full/2007/41/aa7396-07/img14.gif) |
Figure 1:
Spectra of V838 Mon and a meteor taken by the 182 cm telescope at
|
| Open with DEXTER | |
Fortunately, 3 examples of sporadic meteor spectra in the wavelength
range of 3500-10 500 ![]() have been reported. They appeared in
high-dispersion slits on big telescopes by accident. On June 18, 1977,
Stauffer & Spinrad (1978) first detected a sporadic meteor spectrum with the
3.05 m telescopes at Lick observatory (USA). Second, Borovicka & Zamorano (1995)
obtained a spectrum of the scattered light of a bright and slow-moving
fireball using the 2.2 m telescopes at the Calar Alto Observatory
(Almeria, Spain) on Dec. 19, 1988. Last, on May 12, 2002,
Jenniskens et al. (2004a) imaged a meteor spectrum that crossed the long slit of
the European Southern Observatory (ESO) Very Large Telescope (VLT).
These examples provide high-quality and high-resolution data (several
have been reported. They appeared in
high-dispersion slits on big telescopes by accident. On June 18, 1977,
Stauffer & Spinrad (1978) first detected a sporadic meteor spectrum with the
3.05 m telescopes at Lick observatory (USA). Second, Borovicka & Zamorano (1995)
obtained a spectrum of the scattered light of a bright and slow-moving
fireball using the 2.2 m telescopes at the Calar Alto Observatory
(Almeria, Spain) on Dec. 19, 1988. Last, on May 12, 2002,
Jenniskens et al. (2004a) imaged a meteor spectrum that crossed the long slit of
the European Southern Observatory (ESO) Very Large Telescope (VLT).
These examples provide high-quality and high-resolution data (several
![]() /pixel) to enable them to study metals, non-metallic emissions,
and molecule bands. On the other hand, no spectra of meteoroids in the
major meteor showers have been observed with big telescopes.
/pixel) to enable them to study metals, non-metallic emissions,
and molecule bands. On the other hand, no spectra of meteoroids in the
major meteor showers have been observed with big telescopes.
The Leonid meteor shower is one of the strongest activity showers in
each year. Especially from 1998 to 2002, the Leonid meteor showers
presented the increased activity associated with the passage of the
parent comet 55P/Tempel-Tuttle in 1998. Understanding the physical and
chemical properties of these meteors has benefit from the effort made
during its recent active season using small instruments (Borovicka & Jenniskens 2000; Trigo-Rodrìguez et al. 2003; Borovicka et al. 1999; Kasuga et al. 2006). The high velocity of the Leonids (72 km
![]() )
compared to other meteor showers results
in their having the highest impact energy in Earth's atmosphere.
)
compared to other meteor showers results
in their having the highest impact energy in Earth's atmosphere.
For very fast meteoroids, "the hot component condition'' is applied when attempting to unravel their spectra. This is the assumption of only two excitation temperature regions. One is a hot component at 10 000 K and the other the main component at around 5000 K. Emissions of neutral and ionized atoms and atmospheric molecular bands have been observed in the near-UV to near-IR wavelength region (Borovicka & Jenniskens 2000; Borovicka 1993; Ceplecha et al. 1998). The hot component theory has had success in deriving chemical compositions of meteoroids in the Leonid meteor showers so far, although little is known about the physical conditions of the theory.
In this paper we provide a meteor spectrum captured in a 182 cm telescope in the visual-near IR wavelength region. The 182 cm telescope of the Mount Ekar Station of the Astronomical Observatory of Padova was observing the spectrum of V838 Mon. During a 3600 s
exposure in slit spectroscopic mode, a meteor crossed the slit. Thus,
we obtained a meteor spectrum at the same time as that of V838 Mon. The
possible Leonid meteor spectrum enabled us to study the excitation
temperatures of spectral emission lines of non-metallic and metallic
elements and molecular bands. First positive band of nitrogen (![]() )
and ionized silicon emissions (Si II), which had been classified
into typical components, may need to be grouped into new components. Our goal is to suggest new excitation temperature regions for satisfying the observed meteor spectrum. In this paper we describe the possibility that high-speed meteor plasma spectra consist of more than two excitation temperature regions.
)
and ionized silicon emissions (Si II), which had been classified
into typical components, may need to be grouped into new components. Our goal is to suggest new excitation temperature regions for satisfying the observed meteor spectrum. In this paper we describe the possibility that high-speed meteor plasma spectra consist of more than two excitation temperature regions.
The primary target was V838 MON (RA
![]() ,
Dec.
,
Dec.
![]() ), using the 182 cm telescope of the Mount Ekar Station of the Astronomical Observatory of Padova. The observatory is located at latitude
), using the 182 cm telescope of the Mount Ekar Station of the Astronomical Observatory of Padova. The observatory is located at latitude
![]() N, longitude
N, longitude
![]() E, and altitude 1350 m. The exposure began at
E, and altitude 1350 m. The exposure began at
![]() UT 2004 Nov. 18, and a meteor crossed the slit during a 3600 s exposure in slit spectroscopic mode. Therefore,
spectra of both the meteor and V838 Mon were obtained at the same time (Fig. 1) .
UT 2004 Nov. 18, and a meteor crossed the slit during a 3600 s exposure in slit spectroscopic mode. Therefore,
spectra of both the meteor and V838 Mon were obtained at the same time (Fig. 1) .
A TK512CB1 charged-coupled device (CCD) was employed at the f/9 Cassegrain focus. The system is sensitive to the visible-near IR wavelength region (5800-7085 Å) using a Boller & Chivens
spectrograph with a grating of 600 lines
![]() .
A spectral resolution of
.
A spectral resolution of
![]() was achieved with a dispersion of 120
was achieved with a dispersion of 120 ![]()
![]() (2.36
(2.36 ![]()
![]() ), and the data were recorded as 16-bit images.
), and the data were recorded as 16-bit images.
Reduction of the spectrum at the Asiago Observatory was carried out using standard tasks in the NOAO IRAF package. After subtraction of the CCD bias, the image was divided by a normalized flat-field to correct for pixel-to-pixel sensitivity variations. The wavelength calibration was made with the emission lines of a Fe-Ar lamp, and the spectral response of the instrument was calibrated with a spectrum of the standard star HD60778 taken on the same night.
![\begin{figure}
\par\includegraphics[width=13.5cm,clip]{7396fig2.eps}\end{figure}](/articles/aa/full/2007/41/aa7396-07/img25.gif) |
Figure 2:
1D meteor spectrum extracted from the spectra shown in Fig. 1. Calibrated flux density is in units of
|
| Open with DEXTER | |
Figure 1 shows the raw CCD spectrum of the meteor while Fig. 2
provides line identification in the reduced 1D spectrum. Neutral
metallic atom emission lines at 5891.42 ![]() (Na I-doublet) and
ionized metallic lines at 6346.31
(Na I-doublet) and
ionized metallic lines at 6346.31 ![]() and 6370.47
and 6370.47 ![]() (Si II)
were clearly identified. Nonmetallic emission lines at 6157.35
(Si II)
were clearly identified. Nonmetallic emission lines at 6157.35 ![]() (O I), 6482.54
(O I), 6482.54 ![]() (N I), 6562.26
(N I), 6562.26 ![]() (
(
![]() I) and
molecular bands of the first positive band of
I) and
molecular bands of the first positive band of ![]() (
(
![]() 5880-7085
5880-7085 ![]() )
were also
identified. These features are common to spectra obtained for other
fast-moving meteors such as the Leonids, Perseids, and Coma Berenecids
(e.g. Borovicka 1994; Harvey 1977). Most of the
emission features at wavelengths longer than 6000
)
were also
identified. These features are common to spectra obtained for other
fast-moving meteors such as the Leonids, Perseids, and Coma Berenecids
(e.g. Borovicka 1994; Harvey 1977). Most of the
emission features at wavelengths longer than 6000 ![]() originate in
the Earth's atmosphere. They were identified using a line catalog as
shown in Table B.1. Emission lines of O I, N I,
originate in
the Earth's atmosphere. They were identified using a line catalog as
shown in Table B.1. Emission lines of O I, N I,
![]() I, and Si II suggest the presence of the high-excitation
temperature region that corresponds to the hot component condition
(Borovicka 1993,1994).
I, and Si II suggest the presence of the high-excitation
temperature region that corresponds to the hot component condition
(Borovicka 1993,1994).
A few emission lines of neutral non-metallic atoms and ionized metallic
atoms also exist in the spectrum. These lines should be weak because of
their high upper energy levels. In order to explain them, Borovi
![]() ka (1993) employed two types of spectra. One is the hot
component with a high-excitation temperature of 10 000 K, which is
composed of O I, N I,
ka (1993) employed two types of spectra. One is the hot
component with a high-excitation temperature of 10 000 K, which is
composed of O I, N I,
![]() ,
and Si II in the near-IR
and Mg II (4481
,
and Si II in the near-IR
and Mg II (4481 ![]() ), Ca II (3933, 3968
), Ca II (3933, 3968 ![]() )
in the near-UV to
visual range (Borovicka & Jenniskens 2000; Borovicka 1993). The other is the main component
with a low-excitation temperature of 5000 K mainly consisting of
neutral metallic atoms. Borovicka (1994) suggests that the hotter
component is produced by a meteor shock wave associated with
fast-moving meteors. Indeed, our meteor exhibited strong atomic
emission lines that belong to the hot component and imply that its entry
velocity must be fast. Taking the observed emission lines and the image
date and the direction into consideration, we believe that this object
is probably a Leonid meteor. Hereafter, we assume that this is the case.
)
in the near-UV to
visual range (Borovicka & Jenniskens 2000; Borovicka 1993). The other is the main component
with a low-excitation temperature of 5000 K mainly consisting of
neutral metallic atoms. Borovicka (1994) suggests that the hotter
component is produced by a meteor shock wave associated with
fast-moving meteors. Indeed, our meteor exhibited strong atomic
emission lines that belong to the hot component and imply that its entry
velocity must be fast. Taking the observed emission lines and the image
date and the direction into consideration, we believe that this object
is probably a Leonid meteor. Hereafter, we assume that this is the case.
The Boltzmann distribution for the population of each energy level was
assumed for the model fitting (Kasuga et al. 2005b). The total number of
neutral atoms ![]() in the upper energy level
in the upper energy level ![]() is expressed as
is expressed as
 |
(1) |
Here the optically thin model was assumed for the observed spectrum. The self-absorption effect is suggested by estimating the emissions' curve of growth using only small numbers of Fe I-multiplets. However, this technique should not be applied for other elements and other emission lines (Ceplecha 1973; Borovicka 1993).
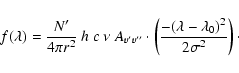
The flux
![]() of a line emitted by atoms in a
transition from a state u in the upper energy level
of a line emitted by atoms in a
transition from a state u in the upper energy level ![]() to a state l in the lower energy level
to a state l in the lower energy level ![]() is expressed as
is expressed as
First positive band of ![]() (
(
![]() )
was fit to the observed meteor wavelength range (5880-7085
)
was fit to the observed meteor wavelength range (5880-7085 ![]() )
as shown in Fig. 2. Second, we fit the
three strong band sequences of the first positive band system as the baseline of the observed spectrum. The vibrational quantum numbers are v of
)
as shown in Fig. 2. Second, we fit the
three strong band sequences of the first positive band system as the baseline of the observed spectrum. The vibrational quantum numbers are v of
![]() ,
,
![]() ,
and
,
and
![]() .
Their band position, Einstein A coefficient, and the calculation procedure for the first positive band of
.
Their band position, Einstein A coefficient, and the calculation procedure for the first positive band of ![]() is given in Appendix A. We do not take the blackbody continuum into account because Harvey (1977) confirmed that most of the meteor spectrum in the near-IR wavelength region is caused by the first positive band.
is given in Appendix A. We do not take the blackbody continuum into account because Harvey (1977) confirmed that most of the meteor spectrum in the near-IR wavelength region is caused by the first positive band.
Third, we fit the atomic emission lines of O I, N I,
![]() I, Si II, and Na I using Eq. (2). The number of
O I, N I,
I, Si II, and Na I using Eq. (2). The number of
O I, N I,
![]() I, Si II, Na I at the ground-state
energy level and
I, Si II, Na I at the ground-state
energy level and
![]() at all energy levels were evaluated
from the observed fluxes. The excitation temperature of
at all energy levels were evaluated
from the observed fluxes. The excitation temperature of
![]() was derived to be
was derived to be
![]() K (see Appendix A). We
found that
K (see Appendix A). We
found that
![]() of
of ![]() was between the hot and the main
components. We propose it as "the Mid component'', and this
possibility is discussed in Sect. 4.1. Excitation temperatures of
O I, N I,
was between the hot and the main
components. We propose it as "the Mid component'', and this
possibility is discussed in Sect. 4.1. Excitation temperatures of
O I, N I,
![]() I, and Si II were assumed to be
10 000 K and 5500 K for Na I to follow the hot and main component
conditions for the Leonids (Borovicka & Jenniskens 2000; Trigo-Rodrìguez et al. 2003; Kasuga et al. 2005a). The
model fit result for the Leonid meteor spectrum is shown in Fig. 2, where we considered all the catalog lines listed in Table B.1 for the calculation.
I, and Si II were assumed to be
10 000 K and 5500 K for Na I to follow the hot and main component
conditions for the Leonids (Borovicka & Jenniskens 2000; Trigo-Rodrìguez et al. 2003; Kasuga et al. 2005a). The
model fit result for the Leonid meteor spectrum is shown in Fig. 2, where we considered all the catalog lines listed in Table B.1 for the calculation.
Atoms in the ground state and all excited levels were summed to obtain the total number. This modification successfully resulted in the derivation of total neutral and/or ionized atomic abundance. To transform column density into number density, we assumed the typical thickness of meteor plasma volume to be about 10 m (Babadzhanov & Kokhirova 2004; Boyd 2000).
Since the telescope was pointed at an elevation of
![]() (at an
airmass of 1.56) when the meteor spectrum was captured, we could estimate the distance from the meteor to observer to be about 171.59 km with the assumption that the altitude of Leonid meteor visibility is 110 km (Millman et al. 1971).
(at an
airmass of 1.56) when the meteor spectrum was captured, we could estimate the distance from the meteor to observer to be about 171.59 km with the assumption that the altitude of Leonid meteor visibility is 110 km (Millman et al. 1971).
Electron density is needed in the Saha equation to obtain the total
number of each atomic species. It lets us derive the degree of the
numbers of singly ionized and neutral atoms (Allen 1999). Hereafter,
the ionization temperatures (=
![]() )
for the hot and main
components are given the same value for the excitation temperatures (=
)
for the hot and main
components are given the same value for the excitation temperatures (=
![]() )
for each component. To derive the electron density under the hot component condition, we defined the Saha's functions that satisfy the equals of total metal abundances and pressure of the radiant
gas between the main and the hot components (Kasuga et al. 2005a). Unfortunately, the method requires two species of both neutral and ionized emission lines, such as Ca I, Mg I, Ca II, Mg II, for the main and hot components respectively, and none of these emission lines
appear in the observed wavelength range. Then, to obtain electron density we applied the quasi-neutrality theory defined by Saha equation. We can consider a total number of the singly ionized one as the same value that of electron density if more highly ionized atoms had no need to be concerned (Borovicka 1993). Results are shown in Table 1.
)
for each component. To derive the electron density under the hot component condition, we defined the Saha's functions that satisfy the equals of total metal abundances and pressure of the radiant
gas between the main and the hot components (Kasuga et al. 2005a). Unfortunately, the method requires two species of both neutral and ionized emission lines, such as Ca I, Mg I, Ca II, Mg II, for the main and hot components respectively, and none of these emission lines
appear in the observed wavelength range. Then, to obtain electron density we applied the quasi-neutrality theory defined by Saha equation. We can consider a total number of the singly ionized one as the same value that of electron density if more highly ionized atoms had no need to be concerned (Borovicka 1993). Results are shown in Table 1.
Table 1:
Results of the excitation temperatures of Si II, corresponding total number of Si II (=![]() ), and abundance ratios of N/O, H/O under the hot component condition.
), and abundance ratios of N/O, H/O under the hot component condition.
Kasuga et al. (2006) found values for electron densities derived from 2002
Leonid meteor spectra of
![]() .
Those
results agree with other studies obtained from the electron volume
density (
.
Those
results agree with other studies obtained from the electron volume
density (
![]() ); (Nagawasa 1978) and the
condition of neutrality with the geometrical model of meteors (
); (Nagawasa 1978) and the
condition of neutrality with the geometrical model of meteors (
![]() ); (Borovicka 1993). Babadzhanov & Kokhirova (2004) carried
out their both methods used the Ca II concentration and conclude that
free electron densities are in the range of
); (Borovicka 1993). Babadzhanov & Kokhirova (2004) carried
out their both methods used the Ca II concentration and conclude that
free electron densities are in the range of
![]() .
.
In this study the analysis process under the hot component condition was
applied to the Leonid spectrum as stated above. Even though our
application derived too high a value for the electron density (
![]() ); (see Table 1)
the excitation temperature for the hot component was fit at 10 000 K.
The derived value is not in the range of previous studies. The Si II
(6347.10, 6371.36 Å) emissions can be much weaker due to the
extremely small values of Einstein A coefficients (
); (see Table 1)
the excitation temperature for the hot component was fit at 10 000 K.
The derived value is not in the range of previous studies. The Si II
(6347.10, 6371.36 Å) emissions can be much weaker due to the
extremely small values of Einstein A coefficients (
![]() )
and their high upper energy levels (
)
and their high upper energy levels (![]() eV) (see details in Sect. 4). However, we find strong Si II (6347.10, 6371.36 Å) emissions in the meteor, implying that these
lines originate in the much higher-excitation temperature component.
eV) (see details in Sect. 4). However, we find strong Si II (6347.10, 6371.36 Å) emissions in the meteor, implying that these
lines originate in the much higher-excitation temperature component.
For the purpose of deriving a realistic electron density from Si II
emission lines, we assume that these lines belong to a "Jet component''
that has a much higher excitation temperature than the hot one. We try
to raise the
![]() of Si II from 10 000 K to 20 000 K for
every additional 1000 K and estimate the total number of Si II. As
shown in Table 1 we can follow a value of electron density
that gets close to a realistic value with the increase in the excitation
temperature of the Jet component. We discovered that a realistic
electron density is obtained at an excitation temperature for the Jet
component of
of Si II from 10 000 K to 20 000 K for
every additional 1000 K and estimate the total number of Si II. As
shown in Table 1 we can follow a value of electron density
that gets close to a realistic value with the increase in the excitation
temperature of the Jet component. We discovered that a realistic
electron density is obtained at an excitation temperature for the Jet
component of
![]() K because its value is
within the realistic range
K because its value is
within the realistic range
![]() (see
Sect. 4.2).
(see
Sect. 4.2).
To derive total abundances, the electron density for the hot, mid, and main component are obtained from the Saha equation using the relationship for the pressure balances of continuous components, as expressed by
A remarkable result is that our derived value of excitation temperature
of the first positive band of ![]() is
is
![]() K, which is much higher than the typical value of
K, which is much higher than the typical value of
![]() 4500 K (Jenniskens et al. 2004b,a,2000b). The difference
may be caused by the source of meteor plasma, which may be either the
body or the train (trail). However, we focus on the possibility that
the difference is due to a dependence on upper energy levels (
4500 K (Jenniskens et al. 2004b,a,2000b). The difference
may be caused by the source of meteor plasma, which may be either the
body or the train (trail). However, we focus on the possibility that
the difference is due to a dependence on upper energy levels (![]() )
of the first positive band of
)
of the first positive band of ![]() as argued by other
researchers.
as argued by other
researchers.
Harvey (1977) and Ceplecha et al. (1998) have suggested that the ![]() is due to a higher excitation temperature region in the meteor
body plasma. The former determined effective vibrational temperatures
(=
is due to a higher excitation temperature region in the meteor
body plasma. The former determined effective vibrational temperatures
(=
![]() )
of
)
of ![]() for relatively high-speed meteors such
as Leonids, Perseids, and Coma Berenecids. Their excitation
temperatures of 15 000-20 000 K indicated that these values are
consistent with the radiation from moderately high upper energy levels
(
for relatively high-speed meteors such
as Leonids, Perseids, and Coma Berenecids. Their excitation
temperatures of 15 000-20 000 K indicated that these values are
consistent with the radiation from moderately high upper energy levels
(
![]() ). The latter also discuss the possibility
that
). The latter also discuss the possibility
that ![]() is one of the sources of the hot component due to its
high upper energy level. Derived values from Harvey (1977) are
higher than our excitation temperatures. This is because the second
positive band of
is one of the sources of the hot component due to its
high upper energy level. Derived values from Harvey (1977) are
higher than our excitation temperatures. This is because the second
positive band of ![]() (
(
![]() ),
which has higher upper energy levels (
),
which has higher upper energy levels (![]() 11 eV) in the near UV to
visual wavelength region, is also taken into account in their model even
though they are very faint. Contamination of the second positive band
and absolute majority of metallic emission lines in the wavelength range
(Kasuga et al. 2005b) might let Harvey (1977) derive relatively higher excitation temperature.
11 eV) in the near UV to
visual wavelength region, is also taken into account in their model even
though they are very faint. Contamination of the second positive band
and absolute majority of metallic emission lines in the wavelength range
(Kasuga et al. 2005b) might let Harvey (1977) derive relatively higher excitation temperature.
Table 2:
Four type components and their excitation temperatures, with representative elements for each component, the catalog of wavelength; ![]() ,
Einstein A coefficients;
,
Einstein A coefficients;
![]() ,
and upper energy level;
,
and upper energy level; ![]() .
Bold fonts are keys to find new components and its category.
.
Bold fonts are keys to find new components and its category.
Ceplecha (1973) found upper energy levels corresponding to reasonable excitation temperature by visualizing Boltzmann distribution of levels for Fe I-multiplets. The correlation for other emission lines are possible. In order to review the correlation about other emission lines we summarize the representative emission lines observed in Leonid meteor spectra for the main and the hot components in Table 2 (Kasuga et al. 2005a).
Lines with high excitation energies, such as Si II (![]() 10.0 eV),
Mg II (
10.0 eV),
Mg II (![]() 11.6 eV), O I lines (
11.6 eV), O I lines (![]() 12.7 eV),
12.7 eV),
![]() I (
I (![]() 12.09 eV), and N I(
12.09 eV), and N I(![]() 13.6 eV ), have been
included in the hot component. On the other hand, lower excitation
energy lines, such as Mg I (
13.6 eV ), have been
included in the hot component. On the other hand, lower excitation
energy lines, such as Mg I (![]() 5.1 eV), Fe I(
5.1 eV), Fe I(![]() 4.3 eV),
Ca I(
4.3 eV),
Ca I(![]() 2.9 eV), and Na I (
2.9 eV), and Na I (![]() 2.1 eV), are emitted from the
main component. Their upper energy levels are closely correlated with
their excitation temperatures, except for the emission lines of
Ca II(
2.1 eV), are emitted from the
main component. Their upper energy levels are closely correlated with
their excitation temperatures, except for the emission lines of
Ca II(![]() 3.1 eV).
3.1 eV).
The components of Ca II have been discussed by several authors. Borovicka (1993) considers them under the hot component condition; however, Borovicka (1994) and Borovicka & Jenniskens (2000) show that Ca II were also included in the main component. Babadzhanov & Kokhirova (2004) suggest that the excitation temperature of Ca II is in the 1500-2000 K range in consideration of their realistic values of the electron density.
Kasuga et al. (2007,2005a) discuss the origin of the Ca II emissions
(3933.66, 3968.47 ![]() )
from the view point of their low upper energy
levels. To derive the electron density under the hot component
condition, we applied the Saha functions as described in Sect. 3.3. Ca II (3933.66, 3968.47
)
from the view point of their low upper energy
levels. To derive the electron density under the hot component
condition, we applied the Saha functions as described in Sect. 3.3. Ca II (3933.66, 3968.47 ![]() )
was assumed to be in the hot component (Borovicka 1993), which resulted in two types of electron
densities: one with a positive value and the other negative. The
appropriate electron density is selected as the positive value following
Borovicka (1993). However, we found an unrealistic situation in that
both derived values of the electron density are negative in some meteor
spectra. This means Ca II are not always under the hot component. The
collapse of the hot component so far is recognized by the unbalanced
pressure of radiant gas and metal abundances among just two types of
components. In that situation, CaII was assumed to be in the main
component instead of the hot one due to its low upper energy levels
(
)
was assumed to be in the hot component (Borovicka 1993), which resulted in two types of electron
densities: one with a positive value and the other negative. The
appropriate electron density is selected as the positive value following
Borovicka (1993). However, we found an unrealistic situation in that
both derived values of the electron density are negative in some meteor
spectra. This means Ca II are not always under the hot component. The
collapse of the hot component so far is recognized by the unbalanced
pressure of radiant gas and metal abundances among just two types of
components. In that situation, CaII was assumed to be in the main
component instead of the hot one due to its low upper energy levels
(![]() 3.1 eV) and extracted electron density.
3.1 eV) and extracted electron density.
We point out that the excitation energy of the upper energy level
correlates closely with its excitation temperature and suggest that the
origin of Ca II is likely to be in the main and not the hot component.
Babadzhanov & Kokhirova (2004) derived relatively low excitation temperatures, which
may be another possibility because it seems to be related to Ca II's
upper energy levels. This means that the hot condition with only two
types of components is not always satisfied, suggesting that other
components corresponding to their upper energy levels may exist. Thus,
we support Harvey (1977) and conclude that our derived excitation
temperature for the first positive band of ![]() is consistent
with their upper energy level. We refer to the new excitation
temperature region as the Mid component, which consists of the first
positive band radiation at
is consistent
with their upper energy level. We refer to the new excitation
temperature region as the Mid component, which consists of the first
positive band radiation at
![]() K (Table 2).
K (Table 2).
Higher upper energy levels require higher excitation temperature. The
intensity of observed fluxes also depends on those physical values and
the Einstein A coefficients:
![]() as expressed in Eq. (2).
Clearly observed atomic emission lines in our meteor spectra yield
values of
as expressed in Eq. (2).
Clearly observed atomic emission lines in our meteor spectra yield
values of
![]() (Kasuga et al. 2005a). However, in this work, we found extremely small
(Kasuga et al. 2005a). However, in this work, we found extremely small
![]() -values for Si II (
-values for Si II (
![]() )
and expect that
its excitation temperature might be higher than those of the hot
component (see Sect. 3.3). Here we approach the reason for the
high value of our derived excitation temperature,
)
and expect that
its excitation temperature might be higher than those of the hot
component (see Sect. 3.3). Here we approach the reason for the
high value of our derived excitation temperature,
![]() ,
from the view point of the small value of
,
from the view point of the small value of
![]() .
.
The excitation temperature of Si II has been set to 10 000 K, and this
value is assumed to be same as that of Mg II (Borovicka 1994). This is
an unreasonable supposition if meteoroids are composed of solar
abundance Mg/Si =
1.05+0.27-0.21 (Asplund et al. 2006). In Table 2, values of
![]() in Mg II (4481 Å) and other elements
under the hot component show almost
in Mg II (4481 Å) and other elements
under the hot component show almost
![]() ,
except for those of Si II
,
except for those of Si II ![]() 10-1 s-1. On the other
hand, we can find that almost all elements in the hot component show
similar values of upper energy levels. This fact enables us to expect
that fluxes of Si II are much smaller than those of Mg II and that the
ratio is about 10-1:108. However, both Fig. 2 in Borovicka (1994) and Fig. 19 in Borovicka (1993), which are relative intensities of spectra, show that Si II and Mg II do not reflect their values of
10-1 s-1. On the other
hand, we can find that almost all elements in the hot component show
similar values of upper energy levels. This fact enables us to expect
that fluxes of Si II are much smaller than those of Mg II and that the
ratio is about 10-1:108. However, both Fig. 2 in Borovicka (1994) and Fig. 19 in Borovicka (1993), which are relative intensities of spectra, show that Si II and Mg II do not reflect their values of
![]() .
The former derives a flux ratio of Si II:Mg II of about 1:2, while the latter finds a ratio of about 1:10. If Si II and Mg II are at the same excitation temperature of 10 000 K, their singly ionized numbers should almost have the same values. This is because, as Borovicka (1994) points out, ionization energies of Si and Mg are almost the same, 8.15 eV and 7.65 eV, respectively (Allen 1999). In this situation their relative fluxes can surely be attributed to their Einstein A coefficients, although it is not reflected in the observed spectra. Therefore, it is hard to argue that Si II and Mg II are at the same excitation temperature.
.
The former derives a flux ratio of Si II:Mg II of about 1:2, while the latter finds a ratio of about 1:10. If Si II and Mg II are at the same excitation temperature of 10 000 K, their singly ionized numbers should almost have the same values. This is because, as Borovicka (1994) points out, ionization energies of Si and Mg are almost the same, 8.15 eV and 7.65 eV, respectively (Allen 1999). In this situation their relative fluxes can surely be attributed to their Einstein A coefficients, although it is not reflected in the observed spectra. Therefore, it is hard to argue that Si II and Mg II are at the same excitation temperature.
Our derived electron density at 10 000 K under the quasi-neutrality
condition is also a questionable value (
![]() )
because it is out of the range of typical values
derived by previous researchers (see Sect. 3.3). The abnormal
value of our electron density may be caused by three factors: excitation
temperature, geometrical thickness, or the altitude of the meteor
illumination. To resolve the issue, we first tried to raise the
excitation temperature of the Si II emissions to produce a more
realistic electron density under the assumption that they belong to a
"Jet component'' that has a higher excitation temperature than the hot
component. As the excitation temperature of the Jet component increases
to 17 000 K, the electron density gets close to a realistic value.
Second, we assumed the geometrical thickness was extremely large, which
might let us obtain unusual values for the electron density. If the
geometrical thickness of the meteor plasma increases beyond the normal
size (to 50 m), a realistic electron density can be obtained at
14 000 K (
)
because it is out of the range of typical values
derived by previous researchers (see Sect. 3.3). The abnormal
value of our electron density may be caused by three factors: excitation
temperature, geometrical thickness, or the altitude of the meteor
illumination. To resolve the issue, we first tried to raise the
excitation temperature of the Si II emissions to produce a more
realistic electron density under the assumption that they belong to a
"Jet component'' that has a higher excitation temperature than the hot
component. As the excitation temperature of the Jet component increases
to 17 000 K, the electron density gets close to a realistic value.
Second, we assumed the geometrical thickness was extremely large, which
might let us obtain unusual values for the electron density. If the
geometrical thickness of the meteor plasma increases beyond the normal
size (to 50 m), a realistic electron density can be obtained at
14 000 K (
![]() ). The
excitation temperature of Si II is predicted to be higher than that of
the hot component even if the geometrical thickness is up to
). The
excitation temperature of Si II is predicted to be higher than that of
the hot component even if the geometrical thickness is up to ![]() 100 m thick. Third, the high-altitude meteor illumination at 200 km is supposed to be shown by earlier Leonids observation (Spurný et al. 2000). This hypothesis also gives an unrealistic electron density (
100 m thick. Third, the high-altitude meteor illumination at 200 km is supposed to be shown by earlier Leonids observation (Spurný et al. 2000). This hypothesis also gives an unrealistic electron density (
![]() ), even at 20 000 K. Much higher excitation temperature is expected if the altitude of meteor illuminations is above 110 km. Thus, we conclude that an excitation temperature of Si II is higher than 10 000 K, providing evidence of a higher temperature region than the hot component. To confirm this prediction, it is important for future work to derive electron density from the total number of Mg II under the quasi-neutrality condition.
), even at 20 000 K. Much higher excitation temperature is expected if the altitude of meteor illuminations is above 110 km. Thus, we conclude that an excitation temperature of Si II is higher than 10 000 K, providing evidence of a higher temperature region than the hot component. To confirm this prediction, it is important for future work to derive electron density from the total number of Mg II under the quasi-neutrality condition.
Borovicka (1994) has hypothesized that in fast-moving meteor spectra there are two excitation temperature regions. One is the main component of 5000 K and another the hot component of 10 000 K. Intermediate or other temperature regions have not been confirmed (Borovicka 1994).
In this work we have found two new components. One is "the Mid component'' composed of mainly neutral ![]() (
(
![]() ), and the other "the Jet component'' composed of Si II. The excitation temperature of the "the Mid component'' is about 8000 K, while that of "the Jet component'' is above 10 000 K. Their upper energy levels
), and the other "the Jet component'' composed of Si II. The excitation temperature of the "the Mid component'' is about 8000 K, while that of "the Jet component'' is above 10 000 K. Their upper energy levels ![]() and Einstein A coefficients
and Einstein A coefficients
![]() proved to be the keys to identifying the new components.
proved to be the keys to identifying the new components.
This study suggests that meteor plasma spectra consist of several temperature regions, such as the main component, the Mid component, the hot component, and the Jet component. The temperature increases gradually from the main to the Jet components. To confirm its validity, we should consider a pressure balance and an equivalence of metal abundances among four types of continuous components. The former is considered (Eq. (3)) in this study, but the latter in each component is not estimated. It might be good to apply to the Saha function to metal elements, especially to Si I and Si II, under the old and new components conditions. To derive them, we need high-resolution meteor spectra from the near UV to near IR wavelength region, which includes neutral and ionized atomic emission lines and the nitrogen band for each component.
Acknowledgements
T.K. thanks Profs. Tetsuo Yamamoto, Yasuhiro Hirahara, Robert Jedicke, and the JSPS Research Fellowships for young scientists. We pray for the repose of Mr. Atsushi Mori's soul. He made a great contribution to meteor science.
Here we describe the model of the first positive band of nitrogen:
![]() (
(
![]() ). Molecular
band emissions consist of many individual emission lines
(Herzberg 1950). Wave numbers of those emission lines correspond to
the transitions between two electronic states and are given by
). Molecular
band emissions consist of many individual emission lines
(Herzberg 1950). Wave numbers of those emission lines correspond to
the transitions between two electronic states and are given by
For triplet transitions where spin splitting is ignored, the central
component of the triplet is used as an effective emission line
(Arnold et al. 1969). Then, we applied it to the triplets for the model
fitting. Hence, the rotational energy F(J) is expressed in
Herzberg (1950) as
These transitions are characterized by strong P and R branches, although
other branches are negligibly small (Arnold et al. 1969). The selection rule
of the first positive band [![]() (
(
![]() )] is
)] is
![]() and the P-branch is
and the P-branch is
![]() ,
while the R-branch is
,
while the R-branch is
![]() .
The symbol J is replaced by the symbol K, which denotes rotational quantum number without spin. It is assumed to be
.
The symbol J is replaced by the symbol K, which denotes rotational quantum number without spin. It is assumed to be
![]() in the least - square model.
in the least - square model.
Table A.1:
Bands of
![]() (
(
![]() ), with the wavelength
), with the wavelength ![]() ,
and Einstein coefficient Av'v'' (Forrest et al. 1992).
,
and Einstein coefficient Av'v'' (Forrest et al. 1992).
The spectral flux
![]() of emission from the rotational lines is written as
of emission from the rotational lines is written as
The electronic multiplicity d is given by
![]() (2S+1) where
(2S+1) where
![]() and S are the lambda doubling factor and quantum number of the
resultant spin of
and S are the lambda doubling factor and quantum number of the
resultant spin of ![]() molecules respectively. For the upper
electronic state of the first positive band
molecules respectively. For the upper
electronic state of the first positive band ![]() and S are 2 and 1
respectively (e.g. Herzberg 1950). The approximated partition function Q (Drellishak 1964; Stupochenko et al. 1961) of diatomic molecules in all
electronic states is calculated with
and S are 2 and 1
respectively (e.g. Herzberg 1950). The approximated partition function Q (Drellishak 1964; Stupochenko et al. 1961) of diatomic molecules in all
electronic states is calculated with
Table B.1:
Metallic and nonmetallic emission lines in the visual -
near IR wavelength range. Observed elements and their line positions,
catalogued line position, the Einstein A coefficient, energy ![]() and
and
![]() respectively of the lower and upper levels, configurations, and
statistical weights
respectively of the lower and upper levels, configurations, and
statistical weights ![]() and
and ![]() of the lower and upper levels
respectively.
of the lower and upper levels
respectively.
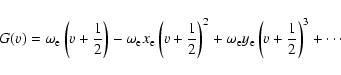
![\begin{displaymath}F(J)= F(K) = B_v[K(K+1)+ 4Z_2] - D_v \left(K + \frac{1}{2}\right)^{4},
\end{displaymath}](/articles/aa/full/2007/41/aa7396-07/img112.gif)
![\begin{displaymath}Z_2 = \frac{\Lambda Y (Y-1) - \frac{4}{9} -2K(K+1)}{3\left[\Lambda^{2} Y (Y-4) + \frac{4}{3}
+4K(K+1) \right]},
\end{displaymath}](/articles/aa/full/2007/41/aa7396-07/img113.gif)
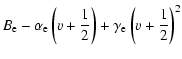

![\begin{displaymath}N' = \frac{N_0 d'(2K'+1)}{Q(T_{\rm ex})_{\rm total}}~ {\rm ex...
...frac{hc}{k_{\rm B}T_{\rm ex}}(T'_{\rm e}+G'(v')+F'(K'))\right]
\end{displaymath}](/articles/aa/full/2007/41/aa7396-07/img130.gif)
![\begin{displaymath}Q(T_{\rm ex})_{\rm total} = \sum^{n}_{i=1} \left[d_i {\rm exp...
...rac{hcG(v_j)} {k_{\rm B}T{_{\rm ex}}}\right) \right) \right]_i
\end{displaymath}](/articles/aa/full/2007/41/aa7396-07/img137.gif)