A&A 471, 675-686 (2007)
DOI: 10.1051/0004-6361:20065574
Y. Frémat1 - P. Lampens1 - P. Van Cauteren2 - S. Kleidis3 - K. Gazeas4 - P. Niarchos4 - C. Neiner5 - D. Dimitrov6 - J. Cuypers1 - J. Montalbán7 - P. De Cat1 - C. W. Robertson8
1 - Royal Observatory of Belgium,
3 avenue circulaire, 1180 Brussels, Belgium
2 - Beersel Hills Observatory, Beersel, Belgium
3 - Zagori Observatory, Epirus, Greece
4 - University of Athens, Department of Astrophysics, Astronomy and Mechanics
Panepistimiopolis, 157 84 Zografos, Athens, Greece
5 - GEPI/UMR 8111 du CNRS, Observatoire de Paris-Meudon, 5
place Jules Janssen, 92195 Meudon, France
6 - Institute of Astronomy, Bulgarian Academy of Sciences, 72 Tsarigradsko
Shosse Blvd., 1784 Sofia, Bulgaria
7 - Université de Liège, Institut d'Astrophysique et de Géophysique,
Allée du 6 Août, 17 Sart Tilman, Liège, Belgium
8 - SETEC Observatory, Goddard, Kansas, USA
Received 9 May 2006 / Accepted 29 May 2007
Abstract
Context. In the H-R diagram, the intersection of the main sequence and the classical Cepheid instability strip corresponds to a domain where a rich variety of atmospheric phenomena are at play (including pulsation, radiative diffusion, convection). Main-sequence A-type stars are among the best candidates to study the complex interplay between these various phenomena.
Aims. We have explored a sample of suspected A-type binaries in a systematic way, both spectroscopically and photometrically. The sample consists of main-sequence A-type stars for which the few existing radial velocity measurements may show variability, but for which other essential information is lacking. Due to their location in the H-R diagram, indications of pulsation and/or chemical peculiarities among these suspected binary (or multiple) systems may be found.
Methods. High-resolution spectroscopy obtained with the ELODIE and MUSICOS spectrographs was used in combination with a few nights of differential CCD photometry in order to search for pulsation(s). In order to search as well for chemical peculiarities or for possible hidden component(s), we derived the atmospheric stellar parameters by fitting the observed spectra with LTE synthetic ones.
Results. Of the 32 investigated targets, eight are spectroscopic binaries, one of which is a close binary also showing eclipses, and three have been identified as ![]() Scuti pulsators with rapid line-profile variations.
Scuti pulsators with rapid line-profile variations.
Conclusions. Among the latter stars, HD 217860 reveals interesting multiperiodic photometric and spectroscopic variations, with up to eight frequencies common to two large photometric data sets. We suggest that at least one radial overtone mode is excited among the two most dominant frequencies, on the basis of the computation of the pulsation constants as well as of the predicted frequencies and the expected behaviour of the amplitude ratio and the phase difference in two passbands using adequate theoretical modelling. We furthermore found evidence for a strong modulation of the amplitude(s) and/or the (radial) frequency content of this intriguing ![]() Scuti star.
Scuti star.
Key words: stars: binaries: spectroscopic - stars: fundamental
parameters - stars: variables: general - stars: binaries: general - stars: binaries: eclipsing - stars: variables: ![]() Sct
Sct
In their catalogue of stellar radial velocities, Grenier et al. (1999) noticed that
32% of the sample of B8-F2 type stars observed by the Hipparcos satellite have variable
velocities and assumed that this variability was due to multiplicity only. Though this
conclusion remains valid when performing statistics on the overall occurrence of multiplicity,
it is realistic to think that some of the studied stars are also non-radial pulsators showing
line profile variations (LPVs). In the H-R diagram, this situation may happen, for example,
at the intersection of the classical Cepheid instability strip (CIS) and the main sequence
(where the mid-A to early-F type stars are).
In this region, a rich variety of phenomena are at play in the stellar atmospheres, some of
which are expected to produce long- and/or short-term variability. These phenomena consist
in the different pulsation mechanisms (active in the ![]() Scuti, SX Phe,
Scuti, SX Phe, ![]() Dor and
roAp variable stars) and in various other processes involving magnetism, diffusion, rotation
and convection. The latter processes may boost or on the contrary inhibit the presence of
chemical peculiarities (occurring in Ap, Am,
Dor and
roAp variable stars) and in various other processes involving magnetism, diffusion, rotation
and convection. The latter processes may boost or on the contrary inhibit the presence of
chemical peculiarities (occurring in Ap, Am, ![]() Pup and
Pup and ![]() Boo stars). The
competition between these processes and mechanisms thus leads to a large mix of stellar groups
of different atmospheric composition (Dworetsky 2004). These stellar groups also
behave in different ways with respect to pulsation and binarity, resulting in non-symmetric
spectral lines which can lead to misinterpretation of the radial velocity (RV) measurements.
Boo stars). The
competition between these processes and mechanisms thus leads to a large mix of stellar groups
of different atmospheric composition (Dworetsky 2004). These stellar groups also
behave in different ways with respect to pulsation and binarity, resulting in non-symmetric
spectral lines which can lead to misinterpretation of the radial velocity (RV) measurements.
Combining high-resolution spectroscopy and CCD photometry, the present work aims at exploring the RV variability of several poorly known HIPPARCOS targets located at the lower end of the instability strip. For one of the most promising targets (HD 217860) showing multiperiodic variations, we performed a frequency analysis of the multi-site differential photometric time series. The data and the reduction procedure are described in Sect. 2, while the tools and the procedure we adopted to derive the stellar parameters (effective temperature, surface gravity and projected rotational velocity) and their errors are described in Sect. 3. Sections 4 and 5 provide respectively the global results and a discussion of several interesting targets. We present the conclusions and future perspectives of this project in Sect 6.
32 targets from the HIPPARCOS catalogue have been selected according to the following criteria: 1) brighter than magnitude 8; 2) spectral type ranging from A0 to F2; 3) showing some indication of radial velocity variability (Grenier et al. 1999); and 4) preferentially with less than ten references in the bibliography recorded in the SIMBAD database at the CDS. The selected targets are ordered by increasing HD number in Table 1, with the HIP number (Col. 2), number of references in SIMBAD (Col. 3), V magnitude (Col. 4) and spectral type (Col. 5) from Grenier et al. (1999).
The spectroscopic observations were carried out at the 1.93 m telescope of the OHP (Baranne et al. 1996), equipped with the ELODIE spectrograph (
![]() ). High-resolution
spectra were collected during 4 nights in 2004 (December 3-7). Each target was observed 2 to 5 times in order to be able to detect rapid (periods of order of a few hours) or slow
(periods of the order of a few days) line profile variations (LPVs) and/or changes in radial velocity.
However, due to the weather conditions, some of our targets have only been observed 2-3 consecutive times, without the possibility to reobserve them at a later date. We adapted the time
exposures to ensure a S/N ratio per pixel usually varying from 70 to 100 (at 5000 Å).
The journal of observations is given in Table 2 and contains:
the HD identifier (Col. 1), Heliocentric Julian Day (HJD, Col. 2), signal-to-noise
ratio (Col. 3), exposure time (Col. 4), as well as the instantaneous radial velocity (Col. 5)
and the observatory's acronym (Col. 6).
). High-resolution
spectra were collected during 4 nights in 2004 (December 3-7). Each target was observed 2 to 5 times in order to be able to detect rapid (periods of order of a few hours) or slow
(periods of the order of a few days) line profile variations (LPVs) and/or changes in radial velocity.
However, due to the weather conditions, some of our targets have only been observed 2-3 consecutive times, without the possibility to reobserve them at a later date. We adapted the time
exposures to ensure a S/N ratio per pixel usually varying from 70 to 100 (at 5000 Å).
The journal of observations is given in Table 2 and contains:
the HD identifier (Col. 1), Heliocentric Julian Day (HJD, Col. 2), signal-to-noise
ratio (Col. 3), exposure time (Col. 4), as well as the instantaneous radial velocity (Col. 5)
and the observatory's acronym (Col. 6).
The data have been automatically reduced order-by-order at the end of the night
using the INTERTACOS pipeline. The first 50 echelle orders were merged using
the overlapping region and computing a ratio allowing to scale each order
as described in Erspamer & North (2002). To ease normalisation of the spectra
and to correct for the incomplete removal of the instrumental response
(see Fig. 1a), we used the spectra of the stars in our sample with
known Strömgren and H![]() colour indices. We adopted these indices to perform
a first estimate of the stellar parameters and to compute a reference synthetic spectrum.
An averaged function was obtained by dividing the observed data by this "reference
spectrum'', which was further used to correct the merged raw spectra (see Fig. 1b).
Normalization was finally performed by fitting a line through the continuum between 4000
and 4500 Å with the CONTINUUM task of IRAF (see Fig. 1c).
colour indices. We adopted these indices to perform
a first estimate of the stellar parameters and to compute a reference synthetic spectrum.
An averaged function was obtained by dividing the observed data by this "reference
spectrum'', which was further used to correct the merged raw spectra (see Fig. 1b).
Normalization was finally performed by fitting a line through the continuum between 4000
and 4500 Å with the CONTINUUM task of IRAF (see Fig. 1c).
![\begin{figure}
\par\includegraphics[width=7.5cm,clip]{5574fig1.eps}
\end{figure}](/articles/aa/full/2007/32/aa5574-06/img10.gif) |
Figure 1: Normalisation of the spectrum of HD 225125: a) Merged spectrum with incomplete removal of the instrumental signature/response; b) Corrected spectrum and continuum placement (broken line); c) Normalized observed spectrum (black line) compared to the synthetic one (red crosses). |
| Open with DEXTER | |
To complete these data, some spectra were obtained with the MUSICOS spectropolarimeter
(
![]() )
mounted at the Cassegrain focus of the 2-m telescope Bernard Lyot Telescope
(TBL) at the Observatoire du Pic du Midi (France) (Donati et al. 1999) in
July 2005. The spectral domain covered ranges from 4500 to 6600 Å; these spectra
were reduced with the ESpRIT software package developed by Donati et al. (1997)
and improved by Neiner et al. (2003).
)
mounted at the Cassegrain focus of the 2-m telescope Bernard Lyot Telescope
(TBL) at the Observatoire du Pic du Midi (France) (Donati et al. 1999) in
July 2005. The spectral domain covered ranges from 4500 to 6600 Å; these spectra
were reduced with the ESpRIT software package developed by Donati et al. (1997)
and improved by Neiner et al. (2003).
INTERTACOS and ESpRIT were also used to perform a cross-correlation of the observed
spectra with the appropriate mask after each exposure. However, since most of our targets
have large ![]() values, we recomputed the cross-correlation function (CCF)
in a spectral domain ranging from 5000 to 5700 Å in order to avoid the hydrogen lines.
Synthetic spectra obtained with the stellar parameters derived in Sect. 3.1
and for
values, we recomputed the cross-correlation function (CCF)
in a spectral domain ranging from 5000 to 5700 Å in order to avoid the hydrogen lines.
Synthetic spectra obtained with the stellar parameters derived in Sect. 3.1
and for ![]() = 0 km s
= 0 km s
![]() were adopted as templates. An example of a CCF can be found
in Fig. 2.
were adopted as templates. An example of a CCF can be found
in Fig. 2.
In two cases (HD 11190 and HD 68725), additional spectra were obtained
with the Coudé spectrograph (with a resolution of 0.19 Å /pixel) on the 2-m R-C
telescope of the NAO Rozhen in December 2006. The spectral domain covers three regions
from about 4440 to 4640 Å, from 6300 to 6500 Å, and around the H![]() line.
These spectra were reduced with standard IRAF procedures. The corresponding radial
velocities were measured with the cross-correlation technique using synthetic spectra.
line.
These spectra were reduced with standard IRAF procedures. The corresponding radial
velocities were measured with the cross-correlation technique using synthetic spectra.
Table 3: Description of used instruments during the exploratory program. FOV (i.e. Col. 4) stands for "Field Of View''.
![\begin{figure}
\par\includegraphics[width=8cm,clip]{5574fig2.eps}
\end{figure}](/articles/aa/full/2007/32/aa5574-06/img20.gif) |
Figure 2: The CCF of HD 217860 shown for 3 consecutive exposures. |
| Open with DEXTER | |
We additionally performed complementary and exploratory CCD photometry for the most promising targets of the sample, i.e. for those stars that showed interesting short-term variations of the CCFs, in the period between December 2004 and January 2006. This has not always been possible, however, as the targets are bright and suitable comparison stars were not always available in the used fields-of-view (FOVs). For this reason, various telescopes of different size have been used, including also very small instruments of only 13-cm aperture. Table 3 summarizes the technical specifications of these instruments. In some cases we had no other choice than to use the only other bright star in the field, even though the colour and/or magnitude difference was not optimal. Depending on the target's magnitude, a B or V filter according to Bessell's specifications (Bessell 1995) was employed.
The most promising candidates for short-term variability in the CCFs were submitted to two photometric runs of about half a night each in order to verify the presence of short-periodic light variations. Table 4 summarizes the journal of the observations for 7 of the 32 selected HIPPARCOS targets. In one additional case (HD 30468), there was no suitable comparison stars in the field.
HD 217860 was recognised by HIPPARCOS as a variable star but with an
unsolved variability pattern (ESA
1997). Much to our surprise, a brief frequency-analysis of 113 selected measurements from the Hipparcos Epoch Photometry allowed
us to detect a most dominant frequency at 19.7474
![]() with a significance
ratio of about 10 (Hp-amplitude of 18 mmag), accompanied by a possible
second frequency at 14.2681
with a significance
ratio of about 10 (Hp-amplitude of 18 mmag), accompanied by a possible
second frequency at 14.2681
![]() with a significance ratio between 5 and 6
(Hp-amplitude of 10 mmag). The variations in the light curves and the spectra
are rapid (see Fig. 5 and also Frémat et al. 2006b)
and show the presence of multiple periods, confirming its status of
with a significance ratio between 5 and 6
(Hp-amplitude of 10 mmag). The variations in the light curves and the spectra
are rapid (see Fig. 5 and also Frémat et al. 2006b)
and show the presence of multiple periods, confirming its status of ![]() Scuti variable star. The light curves are sometimes very peculiar.
We therefore collected CCD photometric (differential) data from
various observatories equipped with small instruments in Europe,
in the period between December 3, 2004 and December 25, 2005. The
observations were carried out using a 0.4-m Newton equipped with
a SBIG ST-10 XME CCD at Beersel Hills Observatory (BHO,
Belgium), a 0.4-m reflector with a focal reducer and SBIG ST-8
CCD at the University of Athens Observatory (UAO, Athens,
Greece), and a 20-cm telescope with a ST-7 XMEI CCD at Athens
(ZO, Greece). We performed the observations using the Band V filters according to Bessell's specifications (Bessell 1995).
Table 5 shows the details of the observational
campaigns. Due to a technical problem, observations obtained at a fourth
site could however not be used. We employed the software Mira AP
Scuti variable star. The light curves are sometimes very peculiar.
We therefore collected CCD photometric (differential) data from
various observatories equipped with small instruments in Europe,
in the period between December 3, 2004 and December 25, 2005. The
observations were carried out using a 0.4-m Newton equipped with
a SBIG ST-10 XME CCD at Beersel Hills Observatory (BHO,
Belgium), a 0.4-m reflector with a focal reducer and SBIG ST-8
CCD at the University of Athens Observatory (UAO, Athens,
Greece), and a 20-cm telescope with a ST-7 XMEI CCD at Athens
(ZO, Greece). We performed the observations using the Band V filters according to Bessell's specifications (Bessell 1995).
Table 5 shows the details of the observational
campaigns. Due to a technical problem, observations obtained at a fourth
site could however not be used. We employed the software Mira AP![]() (vers. 6) to reduce the
images following standard procedures (offset and dark current correction,
flat-field calibration) and to compute the differential magnitudes
using the technique of aperture photometry at BHO. At ZO and UAO, we
used the package AIP4WIN (respectively the versions 1.4.21 and 1.4.25)
(Berry & Burnell 2005).
(vers. 6) to reduce the
images following standard procedures (offset and dark current correction,
flat-field calibration) and to compute the differential magnitudes
using the technique of aperture photometry at BHO. At ZO and UAO, we
used the package AIP4WIN (respectively the versions 1.4.21 and 1.4.25)
(Berry & Burnell 2005).
All differential magnitudes have been computed using HIP 113918 (GSC 3997:1091) as the principal comparison star and GSC 3997:1078 as the check star. At BHO, additional comparison stars have been considered. In this case we identified GSC 3997:775 as NSV 14402 in the same field and also measured it. Since both HIP 113918 (the comparison star "C1'') and HIP 113790 (the variable star "V'') are much brighter than GSC 3997:1078 (the check star "K''), the standard deviations of the mean differential magnitude in the sense (K-C1) are used as estimates of the highest noise level expected to be found in the residual data during the subsequent frequency analyses. We subtracted the overall averaged values for every measured star at each observatory. We initially also corrected for nightly shifts using the mean values of the differential magnitudes in the sense (K-C1) per night and per observatory. We next computed the relative weights of each time series by determining the night-to-night standard deviations of the (K-C1) differences, and we adopted a weight inversely proportional to their variance. The largest relative weight (set equal to 1) has been taken from the highest-quality time series. The preliminary analyses however showed that the corrections based on the (K-C1)'s nightly averages did not compensate well enough for the nightly shifts of the (V-C1) data in order to be able to remove most of the power in the low frequency regime. Therefore, we went one step further and corrected for nightly shifts using the mean values of the differential magnitudes in the sense (V-C1) per night and per observatory. In this way, we removed any signal that might indicate a real long-term periodical trend in the datasets. However, since our main interest is the study of the pulsations, we will only focus on the high-frequency regime from hereon.
We derived the fundamental stellar parameters (
![]() ,
log g and V sin i) by fitting our
high-resolution spectra with synthetic ones (Sect. 3.1). For the
double-lined spectroscopic binaries (SB2s) of our sample, the procedure was adapted to
account for the existence of a companion and an additional parameter (
,
log g and V sin i) by fitting our
high-resolution spectra with synthetic ones (Sect. 3.1). For the
double-lined spectroscopic binaries (SB2s) of our sample, the procedure was adapted to
account for the existence of a companion and an additional parameter (
![]() ),
representing the monochromatic luminosity ratio between the components A and B, was defined
(Sect. 3.2).
The error bars for
),
representing the monochromatic luminosity ratio between the components A and B, was defined
(Sect. 3.2).
The error bars for
![]() ,
V sin i and
,
V sin i and
![]() represent the standard errors
resulting from the different fitted zones, while those for log g are derived from the
uncertainties on the parallax (and on
represent the standard errors
resulting from the different fitted zones, while those for log g are derived from the
uncertainties on the parallax (and on
![]() for SB2s), on the one hand,
and on the effective temperature, on the other hand.
for SB2s), on the one hand,
and on the effective temperature, on the other hand.
The radial velocity (RV), projected rotational velocity (V sin i), effective temperature (
![]() ),
and surface gravity have been derived in four consecutive steps. First, the CCFs were used to estimate
the instantaneous and averaged RV. Then, a comparison between observed and synthetic spectra allowed
us to derive the projected rotational velocity and the effective temperature (Sect. 3.3).
This has been performed by means of the GIRFIT computer code (Frémat et al. 2006a), which
allows to conduct a least squares fitting based on the MINUIT minimization package.
In this study, we mainly focused on several zones in the spectral domain ranging from 3900 to 4500 Å (Table 6), in which independent fits were performed.
The determination of V sin i is based on metallic line fitting with RV fixed and considering
log g,
),
and surface gravity have been derived in four consecutive steps. First, the CCFs were used to estimate
the instantaneous and averaged RV. Then, a comparison between observed and synthetic spectra allowed
us to derive the projected rotational velocity and the effective temperature (Sect. 3.3).
This has been performed by means of the GIRFIT computer code (Frémat et al. 2006a), which
allows to conduct a least squares fitting based on the MINUIT minimization package.
In this study, we mainly focused on several zones in the spectral domain ranging from 3900 to 4500 Å (Table 6), in which independent fits were performed.
The determination of V sin i is based on metallic line fitting with RV fixed and considering
log g,
![]() ,
and V sin i as free parameters. It is worth to remark that, at this stage,
the procedure provides V sin i only, while the values obtained for
,
and V sin i as free parameters. It is worth to remark that, at this stage,
the procedure provides V sin i only, while the values obtained for
![]() and log g are not yet
meaningful. Since most of the targets are cooler than 8500 K, the determination of
and log g are not yet
meaningful. Since most of the targets are cooler than 8500 K, the determination of
![]() was
performed using the hydrogen lines as well as the Ca II K-line. This spectra-fitting
procedure was completed adopting the previously obtained values of V sin i and RV, while
log g was kept equal to 4.0 in the first iteration. The surface gravity has finally been derived by
combining the HIPPARCOS parallax, V magnitude and
was
performed using the hydrogen lines as well as the Ca II K-line. This spectra-fitting
procedure was completed adopting the previously obtained values of V sin i and RV, while
log g was kept equal to 4.0 in the first iteration. The surface gravity has finally been derived by
combining the HIPPARCOS parallax, V magnitude and
![]() value in order to estimate the
stars' luminosity (Erspamer & North 2003). We then obtained the mass and radius
from theoretical stellar evolutionary tracks computed for Z=0.02 (Schaller et al. 1992).
A second iteration has been performed to test the sensitivity of the
value in order to estimate the
stars' luminosity (Erspamer & North 2003). We then obtained the mass and radius
from theoretical stellar evolutionary tracks computed for Z=0.02 (Schaller et al. 1992).
A second iteration has been performed to test the sensitivity of the
![]() determination to a change in
log g.
determination to a change in
log g.
Table 6: Fitting zones used to derive the projected rotation velocity and effective temperature.
Stellar parameter determination of three SB2s of the sample (HD 6813, HD 11190, HD 221774)
was carried out by enabling the GIRFIT programme
to combine two wavelength shifted normalized synthetic spectra.
In this version of the code, the input parameters are
![]() ,
log g, V sin i, and RV for each
component. We further added a parameter representing
the monochromatic luminosity ratio,
,
log g, V sin i, and RV for each
component. We further added a parameter representing
the monochromatic luminosity ratio,
![]() /
/
![]() ,
between the components A and B of the system. RV and V sin i values of each component
have been derived in the same way as for single stars. In a first step, the effective temperature
and the luminosity ratio of the stars have been fitted simultaneously, keeping the values
of log g, RV, and V sin i fixed. The value of
,
between the components A and B of the system. RV and V sin i values of each component
have been derived in the same way as for single stars. In a first step, the effective temperature
and the luminosity ratio of the stars have been fitted simultaneously, keeping the values
of log g, RV, and V sin i fixed. The value of
![]() is then used to estimate the
components' V magnitude which, together with the parallax and the effective temperature,
enables to derive the surface gravity (see Sect. 3.1).
Where needed, several iterations were performed to get a coherent set of parameters.
is then used to estimate the
components' V magnitude which, together with the parallax and the effective temperature,
enables to derive the surface gravity (see Sect. 3.1).
Where needed, several iterations were performed to get a coherent set of parameters.
In order to determine the stellar parameters, the GIRFIT code computes the synthetic
spectra from a
![]() /log g-interpolation in a grid of fluxes created with the
SYNSPEC programme (Hubeny & Lanz 1995, see references therein). To account
for additional opacities due to Rayleigh scattering and H- ions, we enabled the
IRSCT and IOPHMI opacity flags of SYNSPEC. All the calculations were performed with
ATLAS9 using LTE atmosphere models computed by Castelli & Kurucz (2003).
The microturbulent velocity was supposed to be 2 km s
/log g-interpolation in a grid of fluxes created with the
SYNSPEC programme (Hubeny & Lanz 1995, see references therein). To account
for additional opacities due to Rayleigh scattering and H- ions, we enabled the
IRSCT and IOPHMI opacity flags of SYNSPEC. All the calculations were performed with
ATLAS9 using LTE atmosphere models computed by Castelli & Kurucz (2003).
The microturbulent velocity was supposed to be 2 km s
![]() and a solar-type chemical
composition was considered.
and a solar-type chemical
composition was considered.
The programme SPECTRUM (Gray 2005) as well as the previously mentioned grid of LTE atmosphere models (for a solar-type chemical composition) were used to compute the synthetic spectra for obtaining the additional NAO radial velocities.
![\begin{figure}
\par\includegraphics[width=7.5cm,clip]{5574fig3.eps}
\end{figure}](/articles/aa/full/2007/32/aa5574-06/img27.gif) |
Figure 3: HD 217860 - Comparison between observed (dotted black line) and synthetic spectra (full red line). |
| Open with DEXTER | |
The procedure described in Sect. 3 was applied to the spectra
of all the targets of our sample. As an example of the agreement we obtained between
observed and synthetic spectra, we show those of HD 217860 in Fig. 3.
The resulting stellar parameters are listed for each target in Table 7:
the HD (Col. 1) and HIP (Col. 2) identification numbers, the effective temperature
(Col. 3), the surface gravity (Col. 4), the projected rotation velocity (Col. 5), and
the radial velocity (Col. 6). Remarks concerning multiplicity, pulsation and/or chemical
composition are reported in Col. 7. In Fig. 4, the projected rotation
velocities of single stars and of single-lined spectroscopic binaries (SB1s) are
plotted relative to the full width of the estimated baseline of the CCF (WCCF, see Fig. 2).
The linear relation that exists between WCCF and ![]() can be used to verify the projected
rotation velocity determination of stars belonging to spectroscopically resolved
binaries (SB2s).
can be used to verify the projected
rotation velocity determination of stars belonging to spectroscopically resolved
binaries (SB2s).
![\begin{figure}
\par\includegraphics[width=7.7cm,clip]{5574fig4.eps}
\end{figure}](/articles/aa/full/2007/32/aa5574-06/img28.gif) |
Figure 4: Relation between the full base width of the cross-correlation function (WCCF) and the V sin i parameter. The linear least squares relation between the measurements made on single-lined objects (filled circles) is represented by the full line. V sin i values obtained for components member of multiple systems are also plotted (unfilled circles). |
| Open with DEXTER | |
Table 7: Stellar parameters of the targets. Remarks: "VAR" are the short-term variables; "ell.'' means ellipsoidal variations are detected in the CCD photometry. The spectra of the 3 framed SB2 targets were analysed accounting for the contribution of two components. Numbers between brackets represent the number of measurements used to compute the average radial velocity (Col. 6).
Figure 5 illustrates the light curves obtained in the B or V filter
for seven targets: HD 3743 (a new binary), HD 12389 (a known ![]() Scuti star),
HD 20194 (a photometrically constant star), HD 68725 (a newly detected
Scuti star),
HD 20194 (a photometrically constant star), HD 68725 (a newly detected ![]() Scuti star), HD 81995 (a new eclipsing binary), HD 217860 (a new multiperiodic
Scuti star), HD 81995 (a new eclipsing binary), HD 217860 (a new multiperiodic
![]() Scuti star) and HD 221774 (a photometrically constant SB2). The discovery of
two new
Scuti star) and HD 221774 (a photometrically constant SB2). The discovery of
two new ![]() Scuti variable stars has already been reported elsewhere (Frémat et al. 2005).
We generally used an arbitrary shift to plot the light curves of both the target minus
comparison star and the comparison minus check star in one and the same panel (after
having removed the mean difference in magnitude for each data set).
Scuti variable stars has already been reported elsewhere (Frémat et al. 2005).
We generally used an arbitrary shift to plot the light curves of both the target minus
comparison star and the comparison minus check star in one and the same panel (after
having removed the mean difference in magnitude for each data set).
![\begin{figure}
\par\includegraphics[width=7.7cm,clip=]{5574fig5a.eps}\par\includ...
...574fig5b.eps}\par\includegraphics[width=7.7cm,clip=]{5574fig5c.eps}
\end{figure}](/articles/aa/full/2007/32/aa5574-06/img30.gif) |
Figure 5: CCD light curves (filter V or B) obtained for seven targets having an obviously variable cross-correlation function. Magnitude differences (i.e. target minus comparison star and comparison minus check star) are reported as a function of the Julian date. Arbitrary shifts were applied to present the light curves of the target and comparison data in a single panel. In the case of HD 81995, there was no suitable check star available in the field. Small thick lines show the corresponding standard deviations of the reference data obtained under the best conditions. |
| Open with DEXTER | |
We performed the frequency analyses with the software package
PERIOD04 which is based on the classical Fourier analysis
(Lenz & Breger 2005).
As a first step, we carried out a frequency search on the B- and the
V-time series for each observatory individually. These preliminary
runs indicated two common frequencies in each data set. We next
merged the data from all three observatories into larger sets of
weighted measurements, one for each filter (sets "B All'' and "V All'').
First we computed the respective spectral windows showing
the alias features caused by the gap of almost one year (![]() 0.003
0.003
![]() )
and the 1 d-1 spacing. The subsequent frequency searches were performed
on the weighted data (using the option "Point Weight'') in the interval from 0 to 35
)
and the 1 d-1 spacing. The subsequent frequency searches were performed
on the weighted data (using the option "Point Weight'') in the interval from 0 to 35
![]() with a frequency step always smaller than
with a frequency step always smaller than
![]() in
B and
in
B and
![]() in V.
The total time span is 387 days, which corresponds to 0.0025
in V.
The total time span is 387 days, which corresponds to 0.0025
![]() in frequency,
for set "B All'' and 158 days, which corresponds to 0.0063
in frequency,
for set "B All'' and 158 days, which corresponds to 0.0063
![]() ,
for set "V All''.
After each computation, the most dominant frequency was prewhitened from the
original (respectively the residual) data in successive steps of the frequency
searches. We stopped the analyses when a significance of 4 above the binned noise
level (for the amplitude of an adopted frequency) in the periodogram of the residuals
was reached or when the incremental variance reduction after a further
prewhitening was less than 1%.
,
for set "V All''.
After each computation, the most dominant frequency was prewhitened from the
original (respectively the residual) data in successive steps of the frequency
searches. We stopped the analyses when a significance of 4 above the binned noise
level (for the amplitude of an adopted frequency) in the periodogram of the residuals
was reached or when the incremental variance reduction after a further
prewhitening was less than 1%.
The results of the frequency searches performed unto the
weighted B- and V-data sets are presented in Tables 8
and 9. In the former, we list the multi-frequency solution
derived from a weighted combination of two independent analyses: we mention the
identification number of the frequency, the frequency value (weighted mean), the
error in frequency (weighted variance of the individual errors computed with
PERIOD04), the signal-to-noise ratio (S/N or significance) and the reduction
of the relative variance in two filters:
| (1) |
This analysis revealed two major frequencies which appear in all our (individual
as well as merged) data sets. These frequencies are 19.747
![]() (F1)
and 12.105
(F1)
and 12.105
![]() (F2), with a frequency ratio of 0.613.
Their values, amplitudes and phases are well-determined.
Six minor frequencies are furthermore common to both searches: these are - in
decreasing order of least-squares amplitude in the filter B - 9.622
(F2), with a frequency ratio of 0.613.
Their values, amplitudes and phases are well-determined.
Six minor frequencies are furthermore common to both searches: these are - in
decreasing order of least-squares amplitude in the filter B - 9.622
![]() (F3),
14.272 or 15.275
(F3),
14.272 or 15.275
![]() (F4), 7.911 or 8.911
(F4), 7.911 or 8.911
![]() (F5), 8.105 or 9.105
(F5), 8.105 or 9.105
![]() (F7),
8.698 or 9.868
(F7),
8.698 or 9.868
![]() (F8), and finally, the coupling frequency 31.852
(F8), and finally, the coupling frequency 31.852
![]() (
(
![]() ).
Though some amplitudes are at the level of a few mmags, all of these frequencies
nevertheless appear with a significant S/N. This is also the case of 31.852
).
Though some amplitudes are at the level of a few mmags, all of these frequencies
nevertheless appear with a significant S/N. This is also the case of 31.852
![]() ,
particularly significant in the set "B All''. The detection of eight common
frequencies in both time series lends credibility to their secure identification,
except - in some cases - for the daily aliasing.
,
particularly significant in the set "B All''. The detection of eight common
frequencies in both time series lends credibility to their secure identification,
except - in some cases - for the daily aliasing.
We additionally performed the search for the best multi-frequency solution (in
the sense of a full scale least-squares analysis) using a different method. The data
collected in both filters B and V, with their respective weights attributed on a night-to-night
base, were simultaneously fitted with a same set of frequencies, but with amplitudes and phases
different for each filter. It was not feasible to explore the complete frequency space in six
or more dimensions, but the region from 8 to 10
![]() was always well covered. A converging
six-frequency solution was found with F1 = 19.74727
was always well covered. A converging
six-frequency solution was found with F1 = 19.74727
![]() ,
F2 = 12.10489
,
F2 = 12.10489
![]() ,
F3 =
9.62244
,
F3 =
9.62244
![]() ,
F4 = 14.27155
,
F4 = 14.27155
![]() ,
F5 = 8.91111
,
F5 = 8.91111
![]() and S12 = 31.85223
and S12 = 31.85223
![]() .
These frequencies
are within the errors identical to the first five frequencies and the sum frequency of the
adopted solution based on the weighted averages of the individual frequency-analyses of
the B- and V-time series (cf. Table 8). The associated amplitudes
and phases are identical to those of Table 9.
.
These frequencies
are within the errors identical to the first five frequencies and the sum frequency of the
adopted solution based on the weighted averages of the individual frequency-analyses of
the B- and V-time series (cf. Table 8). The associated amplitudes
and phases are identical to those of Table 9.
It is interesting to compare our frequency-solution with the one based
on the HIPPARCOS measurements: although F1 is clearly present in both, the second
most dominant frequency (F2) is not. Instead, the next possible frequency was found at 14.268
![]() ,
which matches extremely well with one of the two probable values for F4.
This is unambiguous evidence for amplitude and/or frequency modulation. Because of
the possible detection of 14.272
,
which matches extremely well with one of the two probable values for F4.
This is unambiguous evidence for amplitude and/or frequency modulation. Because of
the possible detection of 14.272
![]() (F4) in the HIPPARCOS measurements, we
gave preference to this frequency in the adopted multi-frequency solution. However,
the alternative choice at 15.275
(F4) in the HIPPARCOS measurements, we
gave preference to this frequency in the adopted multi-frequency solution. However,
the alternative choice at 15.275
![]() (F4) would not lead to a different
frequency-solution than the one listed in Table 8.
(F4) would not lead to a different
frequency-solution than the one listed in Table 8.
Table 8: Adopted frequency-solution based on the weighted analyses of the sets "B All'' and "V All''.
One frequency of the B-time series
(i.e. F6 = 2.000
![]() )
has no matching frequency in the V-time series. We therefore
consider this frequency as not being caused by a real effect. In general, we would not
trust any detection at a frequency below 4
)
has no matching frequency in the V-time series. We therefore
consider this frequency as not being caused by a real effect. In general, we would not
trust any detection at a frequency below 4
![]() (such as in the case of set "B All'') due
to the treatment and the combination of a variety of data sets. We furthermore remark that,
though the B-data are more numerous, we obtained a somewhat smaller significance level for
the most dominant frequency (F1) with the B-data than with the V-data. However, the opposite
is true for all the other frequencies.
(such as in the case of set "B All'') due
to the treatment and the combination of a variety of data sets. We furthermore remark that,
though the B-data are more numerous, we obtained a somewhat smaller significance level for
the most dominant frequency (F1) with the B-data than with the V-data. However, the opposite
is true for all the other frequencies.
![\begin{figure}
\par\includegraphics[width=17cm,clip]{5574fig6.eps}
\end{figure}](/articles/aa/full/2007/32/aa5574-06/img37.gif) |
Figure 6: Successive frequency searches and spectral window of the Fourier analysis (Set All - filter B). |
| Open with DEXTER | |
Figures 6 and 7 illustrate both frequency
searches. We plotted the Fourier spectrum of the original data followed
by those of the residual data after every successive prewhitening. For
sets "B All'' and "V All'', we stopped the search after the detection
of 8 frequencies. The coupling frequency at 31.852
![]() was not identified as the next
highest peak in the periodograms of the residual data sets, but the obvious pattern
imitating the spectral window is a clear indication of its unambiguous identification.
Since its S/N is at least equal to 3 in both sets, we also included
this frequency in the final fitting process.
was not identified as the next
highest peak in the periodograms of the residual data sets, but the obvious pattern
imitating the spectral window is a clear indication of its unambiguous identification.
Since its S/N is at least equal to 3 in both sets, we also included
this frequency in the final fitting process.
Table 9: Amplitude(s) (ratios) and phase(s) (differences) in two filters for the adopted frequency-solution. All the phases are computed with respect to the initial epoch of set "B All''. The standard errors on the derived parameters are also shown.
Two parallel frequency searches performed on the differential magnitudes (K-C1) revealed no significant peaks with an amplitude larger than 1 mmag in both time series. We estimated upper limits for the expected noise level from these data (the differential magnitude is larger than for the variable star): we obtained 9.6 mmag (set "B All'') and 9.0 mmag (set "V All''). As expected, the final scatters of the residual data appear to be much lower: we obtained 7.5 and 7.4 mmag for the B- and the V-residuals respectively (cf. Table 9). We assume that these values reflect the true noise levels of our merged data sets.
The atmospheric stellar parameters listed in Table 7 were obtained through spectroscopic synthesis of high S/N and high-resolution spectra. Therefore, the stellar parameters of HD 217860 are known with a relatively good accuracy. This enabled us to compute, together with the frequencies of Table 8, reliable values for the pulsation constant which are useful to attempt identification of the excited modes. The following expression can be used here (Breger 2000):
allowing a relative accuracy of about 7% on the pulsation constant. Deriving
![]() from the star's location in the H-R diagram, we obtained the pulsation constants of Table 10.
We can see that the two most dominant modes may correspond to radial (overtone) modes, while
F3 could possibly be identified as the fundamental radial mode (F). Remark, however, that the corresponding frequency ratio F2/F1 is 0.613 (this value matches the standard ratio expected
for 2H/F, Bono et al. 1997).
from the star's location in the H-R diagram, we obtained the pulsation constants of Table 10.
We can see that the two most dominant modes may correspond to radial (overtone) modes, while
F3 could possibly be identified as the fundamental radial mode (F). Remark, however, that the corresponding frequency ratio F2/F1 is 0.613 (this value matches the standard ratio expected
for 2H/F, Bono et al. 1997).
Table 10: Derived pulsation constants for the frequencies of the adopted solution and possibly corresponding mode identification.
![\begin{figure}
\par\includegraphics[width=6.5cm,clip]{5574fig8.eps}
\end{figure}](/articles/aa/full/2007/32/aa5574-06/img42.gif) |
Figure 8: Theoretically predicted versus observed frequencies for F1 and F2 in the range 12-20 c/d. Vertical lines represent the observed frequency values. |
| Open with DEXTER | |
Additionally, we used the most recently developed models for ![]() Scuti stars
including also stellar atmospheres with low-efficiency convection (Montalbán & Dupret 2007) to perform a comparison between the theoretical frequency values of modes with degree
Scuti stars
including also stellar atmospheres with low-efficiency convection (Montalbán & Dupret 2007) to perform a comparison between the theoretical frequency values of modes with degree ![]() ,
1, 2 or 3 and the observed two most dominant ones. Only for these frequencies, an accurate determination
of the amplitudes and phases in B and V is possible. We selected 19 appropriate models of mass 1.80, 1.85
and 1.90
,
1, 2 or 3 and the observed two most dominant ones. Only for these frequencies, an accurate determination
of the amplitudes and phases in B and V is possible. We selected 19 appropriate models of mass 1.80, 1.85
and 1.90 ![]() predicting F1 at a value less than 0.2 c/d from its observed value and whose
atmospheric stellar parameters satisfy the conditions in effective temperature and gravity
of
predicting F1 at a value less than 0.2 c/d from its observed value and whose
atmospheric stellar parameters satisfy the conditions in effective temperature and gravity
of ![]() log
log
![]() < 0.015 and
< 0.015 and
![]() .
Then, we looked at those models which
also predict F2 at less than 0.2 c/d from its observed value: 10 models remained.
Figure 8 illustrates the differences for F1 and F2 versus the spherical
harmonic degree
.
Then, we looked at those models which
also predict F2 at less than 0.2 c/d from its observed value: 10 models remained.
Figure 8 illustrates the differences for F1 and F2 versus the spherical
harmonic degree ![]() for the 10 models matching all the requirements. From this comparison, we see
that most models indicate non-radial pulsation with
for the 10 models matching all the requirements. From this comparison, we see
that most models indicate non-radial pulsation with ![]() or 3 for F1, and
or 3 for F1, and ![]() or 3 for F2.
In one such case (model #771 with a mass of 1.85
or 3 for F2.
In one such case (model #771 with a mass of 1.85 ![]() and
and ![]() log
log
![]() = 0.012), we found
a radial mode (
= 0.012), we found
a radial mode (![]() ,
identified as the first overtone 1H) for F2 and a non-radial one (
,
identified as the first overtone 1H) for F2 and a non-radial one (![]() )
for F1. In one more model, but a slightly less evolved one lying just outside the range of allowed parameters
(model #738 with a mass of 1.80
)
for F1. In one more model, but a slightly less evolved one lying just outside the range of allowed parameters
(model #738 with a mass of 1.80 ![]() and
and
![]() ), we found excitation of two
radial modes: the fundamental radial mode (F) for F2 and the second overtone (2H) for F1 (another but poorer match indicated
), we found excitation of two
radial modes: the fundamental radial mode (F) for F2 and the second overtone (2H) for F1 (another but poorer match indicated ![]() for F1) (cf. triangles in Fig. 8).
for F1) (cf. triangles in Fig. 8).
Another tool possibly useful for the determination of the spherical harmonic degree ![]() of the pulsations
at a given value of the pulsation constant (Garrido 2000; Dupret et al. 2003) is the comparison between observed
photometric and theoretical values of the amplitude ratio and the phase difference provided by two-colour
photometry. We used the same models as in Fig. 8 to derive the non-adiabatic quantities
for the
of the pulsations
at a given value of the pulsation constant (Garrido 2000; Dupret et al. 2003) is the comparison between observed
photometric and theoretical values of the amplitude ratio and the phase difference provided by two-colour
photometry. We used the same models as in Fig. 8 to derive the non-adiabatic quantities
for the ![]() ,
1, 2, and 3 modes. In Fig. 9,
we show the resulting amplitude ratio versus phase difference diagramme for the 11 models with frequencies
matching both F1 and F2.
For each model, the harmonic degree
,
1, 2, and 3 modes. In Fig. 9,
we show the resulting amplitude ratio versus phase difference diagramme for the 11 models with frequencies
matching both F1 and F2.
For each model, the harmonic degree ![]() is represented by a different symbol. The amplitude ratios and
the phase differences corresponding to the extra model #738 with a mass of 1.80
is represented by a different symbol. The amplitude ratios and
the phase differences corresponding to the extra model #738 with a mass of 1.80 ![]() correspond
to the filled symbols.
Although, as we can see, there is a discrepancy with the predicted amplitude ratios (notwithstanding the
inclusion of thin convective zones), the phase differences are in good agreement. We conclude from this
diagramme that the observed values (Table 9) might be compatible with low-degree (
correspond
to the filled symbols.
Although, as we can see, there is a discrepancy with the predicted amplitude ratios (notwithstanding the
inclusion of thin convective zones), the phase differences are in good agreement. We conclude from this
diagramme that the observed values (Table 9) might be compatible with low-degree (![]() ,
1 or 2) modes while
,
1 or 2) modes while ![]() modes are not probable since the theoretical non-adiabatic observables
lie too far from their observed counterparts.
modes are not probable since the theoretical non-adiabatic observables
lie too far from their observed counterparts.
![\begin{figure}
\par\mbox{\includegraphics[angle=270,width=8.5cm,clip=]{5574fig9a...
...} \includegraphics[angle=270,width=8.5cm,clip=]{5574fig9b.eps} }
\end{figure}](/articles/aa/full/2007/32/aa5574-06/img50.gif) |
Figure 9:
Observed and theoretical values in an (amplitude ratio
vs. phase difference) diagram for the |
| Open with DEXTER | |
The star is the primary of a visual binary system also
known as CCDM 00403+2403 A, forming a common proper motion pair
(CPM) with CCDM 00403+2403 B (= HIP 3163) (angular separation =
16.5
![]() ,
position angle = 205.5
,
position angle = 205.5![]() and
and
![]() mag, ESA 1997). Since the circular entrance
pupil of the ELODIE fiber is 2
mag, ESA 1997). Since the circular entrance
pupil of the ELODIE fiber is 2
![]() across, only component
A was observed. However, the
star showed a bottle-shaped CCF. The differential photometric
analysis showed a shift of 0.078 mag in mean light level between
two consecutive nights. Though the scatter is large (about 0.01 mag) and increases at the
end of each time series (due to higher airmass), the comparison minus check star
data do not reveal this feature.
We therefore suggest that HIP 3165 is a close binary and that the change in mean level
could be related to ellipsoidal variations with a periodicity of several days.
This behaviour is also confirmed by a simple Fourier analysis of the HIPPARCOS epoch
photometric data: a period of
across, only component
A was observed. However, the
star showed a bottle-shaped CCF. The differential photometric
analysis showed a shift of 0.078 mag in mean light level between
two consecutive nights. Though the scatter is large (about 0.01 mag) and increases at the
end of each time series (due to higher airmass), the comparison minus check star
data do not reveal this feature.
We therefore suggest that HIP 3165 is a close binary and that the change in mean level
could be related to ellipsoidal variations with a periodicity of several days.
This behaviour is also confirmed by a simple Fourier analysis of the HIPPARCOS epoch
photometric data: a period of ![]() 320 days was derived with an amplitude of 0.02 mag.
The HIPPARCOS sampling is, however, very scarce and much shorter
periods are thus possible (and even probable).
For all these reasons we propose HD 3743 = HIP 3165 as a new SB2, making CCDM 00403+2403 AB
at a least triple system. However, more differential photometric data are needed in order
to confirm this work hypothesis.
320 days was derived with an amplitude of 0.02 mag.
The HIPPARCOS sampling is, however, very scarce and much shorter
periods are thus possible (and even probable).
For all these reasons we propose HD 3743 = HIP 3165 as a new SB2, making CCDM 00403+2403 AB
at a least triple system. However, more differential photometric data are needed in order
to confirm this work hypothesis.
HD 3777 was classified as an Am star by Bidelman (1964) and by Cowley & Cowley (1965).
Bertaud (1970) reported broad and weak metallic lines.
The radial velocity of the star varies with an amplitude of about 40 km s
![]() (Grenier et al. 1999; Duflot et al. 1992), probably due to binarity, as confirmed by the two peaks detected
in the CCFs. However, the secondary is much fainter than its companion and we were able to fit the spectrum assuming only one component. Since the observed Ca II K is
fainter than usual, we hereby confirm that this star is a chemically peculiar star of type Am.
(Grenier et al. 1999; Duflot et al. 1992), probably due to binarity, as confirmed by the two peaks detected
in the CCFs. However, the secondary is much fainter than its companion and we were able to fit the spectrum assuming only one component. Since the observed Ca II K is
fainter than usual, we hereby confirm that this star is a chemically peculiar star of type Am.
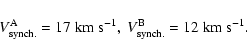
Very little is known about HD 11190 except for its variable radial velocity. Actually, this star forms a SB2 system consisting of two almost identical components (Fig. 10). We monitored it spectroscopically during five consecutive nights in May 2005 and four nights in December 2006. The orbital parameters we derived from the adjustment of the radial velocity measurements assuming a circular orbit are presented in Table 11.
The fitting of the hydrogen lines provides very similar parameters for the two components and
correspond to an A9 IV-V spectral type. Since the Ca II K line of the components is very
weak, and would better agree with that of an A3 star, we may conclude that both components are
Am stars. The luminosity ratio (
![]() =
=
![]() )
and interpolation
through theoretical evolutionary tracks further provide:
)
and interpolation
through theoretical evolutionary tracks further provide:
| = | 2.03 |
|
|
|
= | 2.97 |
|
|
= | 1.39 |
The dynamical mass ratio is in good agreement with the luminosity ratio obtained from
spectroscopy and atmosphere modeling. Although the stellar radii are affected by large error bars,
it is interesting to note that their ratio is almost equivalent to the ratio of the
![]() values (
values (
![]() ), which means that the rotation of both components is
probably synchronized with the orbital motion. This is also supported by the low
), which means that the rotation of both components is
probably synchronized with the orbital motion. This is also supported by the low
![]() values of both components. Assuming that
values of both components. Assuming that
![]()
![]() and
the alignment of the spin and the orbital axes, one would expect values very close
to the observed ones:
and
the alignment of the spin and the orbital axes, one would expect values very close
to the observed ones:
Colours in the Strömgren photometric system are available for this star from Handler (1999,1995).
Adopting the calibration of Moon & Dworetsky (1985), we found
![]() = 8230 K and log g = 3.87 (i.e. corresponds to A5 IV), while
the spectral types provided by SIMBAD and by Grenier et al. (1999) are A0 and A4 V,
respectively. The fitting of the ELODIE data with synthetic spectra results in an effective temperature
in good agreement with the one obtained from uvby photometry.
The CCF shows clear LPVs. We obtained one light curve on JD 2 453 359 (cf. Fig. 5).
Despite a dip at the beginning of the light curve of the comparison minus check star, the data are of very good quality. Though the star minus comparison data show a standard
deviation of at most 6 mmag, the presence of regular, short-period and small-amplitude variations is
obvious. This star is actually a known
= 8230 K and log g = 3.87 (i.e. corresponds to A5 IV), while
the spectral types provided by SIMBAD and by Grenier et al. (1999) are A0 and A4 V,
respectively. The fitting of the ELODIE data with synthetic spectra results in an effective temperature
in good agreement with the one obtained from uvby photometry.
The CCF shows clear LPVs. We obtained one light curve on JD 2 453 359 (cf. Fig. 5).
Despite a dip at the beginning of the light curve of the comparison minus check star, the data are of very good quality. Though the star minus comparison data show a standard
deviation of at most 6 mmag, the presence of regular, short-period and small-amplitude variations is
obvious. This star is actually a known ![]() Scuti variable star
previously detected by (Schutt 1991). A period of 0.04 day and a total peak-to-peak
amplitude of 0.03 mag were reported (Rodríguez et al. 2000). From our data, we estimated a similar period
(
Scuti variable star
previously detected by (Schutt 1991). A period of 0.04 day and a total peak-to-peak
amplitude of 0.03 mag were reported (Rodríguez et al. 2000). From our data, we estimated a similar period
(![]() 0.045 day) and amplitude.
0.045 day) and amplitude.
![\begin{figure}
\par\includegraphics[width=7.7cm,clip=]{5574fig10.eps}
\end{figure}](/articles/aa/full/2007/32/aa5574-06/img65.gif) |
Figure 10: Radial velocity phase diagram of HD 11190. Full and dashed lines represent the orbital solution assuming a circular orbit. Filled symbols correspond to data collected at NAO Rozhen, unfilled ones to data collected at OHP. |
| Open with DEXTER | |
Table 11: Orbital parameters of HD 11190 assuming a circular orbit.
HD 68725 was first recognized as a peculiar Am or Ap star by Olsen (1980)
on the basis of Strömgren photometry, then by Abt (1984) who classified
it as kF2/hF5/mF6 from 1 Å resolution spectra, while Grenier et al. (1999) classified
it F2Ib. In the H-R diagram it is located at the cooler edge of the CIS and close to the
Terminal Age Main Sequence (TAMS; Fig. 12), rather than being a
supergiant star. Chemical peculiarities are found when comparing our data to synthetic spectra.
They are mainly visible for the rare earth elements:
![]() 4078, 4215 Sr II resonance lines are significantly stronger in the observed
spectra while the iron peak elements are only marginally stronger. Scandium and calcium are
nearly solar. HD 68725 is therefore marginally an Am star, but the enhanced Sr possibly
indicates the presence of a magnetic field.
In their survey of the Solar neighbourhood, Nordström et al. (2004) reported
[Fe/H]=+0.33 for this star. Mason et al. (2001) observed it twice
using speckle-interferometry but found no evidence for multiplicity. However, the night-averaged
CCF shows a slight and systematic bump on the left side of the main peak which could be related
to the presence of a secondary component. This seems to be confirmed when comparing the averaged
radial velocity we obtained (
4078, 4215 Sr II resonance lines are significantly stronger in the observed
spectra while the iron peak elements are only marginally stronger. Scandium and calcium are
nearly solar. HD 68725 is therefore marginally an Am star, but the enhanced Sr possibly
indicates the presence of a magnetic field.
In their survey of the Solar neighbourhood, Nordström et al. (2004) reported
[Fe/H]=+0.33 for this star. Mason et al. (2001) observed it twice
using speckle-interferometry but found no evidence for multiplicity. However, the night-averaged
CCF shows a slight and systematic bump on the left side of the main peak which could be related
to the presence of a secondary component. This seems to be confirmed when comparing the averaged
radial velocity we obtained (
![]() km s
km s
![]() )
to the ones previously published by
Duflot et al. (1990,
)
to the ones previously published by
Duflot et al. (1990, ![]() km s
km s
![]() #, Grenier et al. (1999,
#, Grenier et al. (1999, ![]() km s
km s
![]() #
and Nordström et al. (2004,
#
and Nordström et al. (2004, ![]() km s
km s
![]() #. It is worth mentioning that,
we cannot exclude at the present time that this bump could also be due to a spot, which could
provide another proof of an existing magnetic field.
#. It is worth mentioning that,
we cannot exclude at the present time that this bump could also be due to a spot, which could
provide another proof of an existing magnetic field.
The CCF of HD 68725 further shows rapid shape changes (Fig. 2), probably
caused by pulsation of the ![]() Scuti-type as we indeed detected short-period variations
in the CCD photometric data. The light curve in Fig. 5 suggests a period of
Scuti-type as we indeed detected short-period variations
in the CCD photometric data. The light curve in Fig. 5 suggests a period of ![]() 0.12 days. HD 68725 is therefore a chemically peculiar star which also does pulsate as a typical
0.12 days. HD 68725 is therefore a chemically peculiar star which also does pulsate as a typical ![]() Scuti star. More spectra are however needed to decide whether it is
a mild Am or a Ap star. If it would prove to be a magnetic Ap star (showing magnetic variations along with spectral variations modulated by the rotational period), it would be an
exceptional case, together with HD 75425, a weak Ap Sr(CrEu) star (Martinez & Medupe 1998) and
HD 188136, a
Scuti star. More spectra are however needed to decide whether it is
a mild Am or a Ap star. If it would prove to be a magnetic Ap star (showing magnetic variations along with spectral variations modulated by the rotational period), it would be an
exceptional case, together with HD 75425, a weak Ap Sr(CrEu) star (Martinez & Medupe 1998) and
HD 188136, a ![]() Pup star (Kurtz 1980). Such cases suggest that the presence
of a global magnetic field does not inhibit
Pup star (Kurtz 1980). Such cases suggest that the presence
of a global magnetic field does not inhibit ![]() Scuti pulsation in all cases (in contradiction with the actual knowledge of the diffusion theory, see Kurtz & Martinez 2000)
Scuti pulsation in all cases (in contradiction with the actual knowledge of the diffusion theory, see Kurtz & Martinez 2000)
The HIPPARCOS Epoch photometry of HD 81995 varies with time in an unclear way (unsolved HIPPARCOS variable). The CCF is affected by short-term LPVs and by radial velocity variations due to the presence of a much fainter companion. The star is therefore SB1. We additionally obtained two light curves on JD 2 453 462 and JD 2 453 471. Both time series show a partial eclipse, with a drop in magnitude of about 0.06 mag. The standard deviations on the comparison minus check star data are 5 and 7 mmag respectively. The light curves are typical of a detached or semi-detached binary (Fig. 5). A third light curve obtained on JD 2 453 472 showed no changes and a standard deviation of only 4 mmag. In the latter time series, the comparison star appeared to be unreliable.
HD 221774 was found to be a double-lined spectroscopic binary in which the primary and the secondary components have spectral types A6 and F1, respectively. Small changes were detected in the high S/N CCFs of this binary. We therefore observed it photometrically for two partial nights. Both star minus comparison time series have a standard deviation of 4 mmag and do not show any detectable sign of short-period variability, while the standard deviation of comparison minus check star data was 6 mmag. The light curve in Fig. 5 illustrates the data obtained on JD 2 453 408. We thus classified HD 221774 as a photometrically constant star.
![\begin{figure}
\includegraphics[width=7.7cm,clip=]{5574fig11.eps}
\end{figure}](/articles/aa/full/2007/32/aa5574-06/img71.gif) |
Figure 11: Comparison between observed (black line) and synthetic spectra (red line) in the case of the SB2 system HD 11190 at HJD = 2 453 343.4033. The presence of the two components was taken into account in the fit. The significant disagreement between observations and model indicates that both components are Am stars. |
| Open with DEXTER | |
![\begin{figure}
\includegraphics[width=8.5cm,clip=]{5574fig12.eps}
\end{figure}](/articles/aa/full/2007/32/aa5574-06/img72.gif) |
Figure 12:
Location of the targets in the H-R diagram. Open circles
are the stars we identified as short-term variables of |
| Open with DEXTER | |
Table 12: List of interesting targets.
We obtained several high-resolution, high signal-to-noise spectra distributed over various
time scales ranging from a couple of hours to some days for a sample of 32 bright though
poorly investigated A-type stars
selected on the basis of their variable radial velocity (Grenier et al. 1999).
These spectra were supplemented by differential CCD light curves collected as time series
during parts of at least two nights in seven cases, in order to look for rapid light
variations. Among the 32 investigated targets, we discovered eight spectroscopic
binaries, one of which is a close (photometric) binary (HD 81995).
In one case, we claim the detection of ellipsoidal variability caused by the proximity
of both components (HD 3165). In all the cases, the components have projected rotational
velocities below 100 km s
![]() ,
which can be expected if spin-orbit synchronization already occurred.
We suggest this state explicitly in the case of the newly detected SB2 (HD 11190), a
twin system consisting of two similar components orbiting around one another with a period
of 9.1 days. If we except HD 13162, HD 25021 (Am star), HD 38771 and HD 217860 (a pulsating
star), all remaining targets have large
,
which can be expected if spin-orbit synchronization already occurred.
We suggest this state explicitly in the case of the newly detected SB2 (HD 11190), a
twin system consisting of two similar components orbiting around one another with a period
of 9.1 days. If we except HD 13162, HD 25021 (Am star), HD 38771 and HD 217860 (a pulsating
star), all remaining targets have large ![]() values associated to broad CCFs (duplicity or
multiplicity is not easily detectable in these stars, therefore the high scatter in the previous
radial velocity measurements can be misleading and should not be interpreted
as an indication of variability or multiplicity "per se'').
values associated to broad CCFs (duplicity or
multiplicity is not easily detectable in these stars, therefore the high scatter in the previous
radial velocity measurements can be misleading and should not be interpreted
as an indication of variability or multiplicity "per se'').
Among the 32 investigated targets, we also discovered three small-amplitude
![]() Scuti pulsators showing short-term line-profile variations (LPVs), an outcome
confirmed by their CCD differential light curves: one is the already known
Scuti pulsators showing short-term line-profile variations (LPVs), an outcome
confirmed by their CCD differential light curves: one is the already known ![]() Scuti
star HD 12389 (Schutt 1991), the other two are newly identified
Scuti
star HD 12389 (Schutt 1991), the other two are newly identified
![]() Scuti variable stars (HD 68725 and HD 217860). The former one (HD 68725) is also a
member of a marginally metal-enhanced spectroscopic binary showing strong strontium absorption
lines, making it the most intriguing system of our sample.
Scuti variable stars (HD 68725 and HD 217860). The former one (HD 68725) is also a
member of a marginally metal-enhanced spectroscopic binary showing strong strontium absorption
lines, making it the most intriguing system of our sample.
Because both the spectra and the light curves of the pulsating star HD 217860 displayed a highly
multiperiodic behaviour, we organised an extensive photometric campaign for this object
during the winter of 2005. Observations using the Bessell filters B and V were gathered
at three different sites. The independent analyses of two data sets (the sets "B All''
and "V All'') enabled us to identify eight frequencies common to both time series.
The adopted solution was confirmed by a simultaneous multi-frequency search of the
joint B- and V-data sets. The two most dominant frequencies detected show a ratio of 0.61;
this accurately determined ratio matches extremely well the standard value expected for 2H/F.
However, this ratio appears to be also compatible with the computation of the respective pulsation
constants (
Q1 = 0.016 and
Q2 = 0.027 days), which rather indicate 3H/1H (with a theoretical
period ratio of 0.60). As a next step, we computed theoretical versus observed frequency differences
using 19 appropriate models of mass 1.80, 1.85 and 1.90 ![]() ,
including convection modelling in
the outer layers (Montalbán & Dupret 2007). We performed a comparison between the observed amplitude
ratios and phase differences for F1 and F2 on the one hand and their theoretical counterparts on the
other hand for 11 models predicting frequencies close to F1 and F2 for
,
including convection modelling in
the outer layers (Montalbán & Dupret 2007). We performed a comparison between the observed amplitude
ratios and phase differences for F1 and F2 on the one hand and their theoretical counterparts on the
other hand for 11 models predicting frequencies close to F1 and F2 for ![]() = 0, 1, 2, or
3 modes.
From this amplitude ratio versus phase difference diagramme, we concluded that non-radial modes with
= 0, 1, 2, or
3 modes.
From this amplitude ratio versus phase difference diagramme, we concluded that non-radial modes with
![]() = 3 are not probable.
We also showed that most models indicate non-radial pulsation modes with
= 3 are not probable.
We also showed that most models indicate non-radial pulsation modes with ![]() = 1 for F1, and
= 1 for F1, and ![]() = 2 for F2.
However, there exists one model satisfying the derived stellar parameters for HD 217860 and predicting a radial mode for F2 (as the first overtone, 1H). In addition, we found
a less evolved 1.80
= 2 for F2.
However, there exists one model satisfying the derived stellar parameters for HD 217860 and predicting a radial mode for F2 (as the first overtone, 1H). In addition, we found
a less evolved 1.80 ![]() model (lying just outside of the range of allowed stellar parameters with
model (lying just outside of the range of allowed stellar parameters with
![]() ), which is consistent with the conclusion that both frequencies might correspond
to radial modes, with the second overtone (
), which is consistent with the conclusion that both frequencies might correspond
to radial modes, with the second overtone (![]() = 0, 2H) and the fundamental (
= 0, 2H) and the fundamental (![]() = 0, F) modes
being excited. Our conclusion is that some of the models in the right location of the H-R diagram predict pulsation in at least one radial overtone mode among the two major frequencies.
Among the remaining frequencies with almost equally small amplitudes, the presence of non-radial (mixed) modes is very probable, but we cannot exclude that another radial mode may co-exist (e.g. the frequency F3 with Q3 = 0.033 days).
= 0, F) modes
being excited. Our conclusion is that some of the models in the right location of the H-R diagram predict pulsation in at least one radial overtone mode among the two major frequencies.
Among the remaining frequencies with almost equally small amplitudes, the presence of non-radial (mixed) modes is very probable, but we cannot exclude that another radial mode may co-exist (e.g. the frequency F3 with Q3 = 0.033 days).
We also detected - though at the limit of the allowed significance level - a high-frequency
component at 31.852
![]() (or period of about 45 min), corresponding to the coupling
frequency F1+F2.
(or period of about 45 min), corresponding to the coupling
frequency F1+F2.
More importantly perhaps, we found clear evidence for a strong modulation of the
amplitude(s) and/or (radial) frequency content in this star since a frequency-analysis of the
HIPPARCOS Epoch Photometry did not reveal the presence of the frequency that we could
identify as the possible first radial overtone (F2). It is possible that this ![]() Scuti
star is a radial overtone pulsator with a variable (radial) modal content.
For this reason, it is an important case study for the comparison with models of pulsational stability in the middle of the
Scuti
star is a radial overtone pulsator with a variable (radial) modal content.
For this reason, it is an important case study for the comparison with models of pulsational stability in the middle of the ![]() Scuti instability strip (Bono et al. 1997).
Another, recently investigated, multiperiodic
Scuti instability strip (Bono et al. 1997).
Another, recently investigated, multiperiodic ![]() Scuti star shows a very similar behaviour: AN Lyn is an atypical
Scuti star shows a very similar behaviour: AN Lyn is an atypical ![]() Scuti star showing peculiar and highly multiperiodic light curves such as HD 217860, for which three independent frequencies (10.1756, 18.1309 and 9.5598
Scuti star showing peculiar and highly multiperiodic light curves such as HD 217860, for which three independent frequencies (10.1756, 18.1309 and 9.5598
![]() )
were determined (Rodríguez et al. 1997). Changes in amplitude on a long time scale are
confirmed for its main frequency (Zhou 2002). Furthermore, Montalbán & Dupret (2007)
concluded on the basis of a comparison between observed and theoretical values of the amplitude
ratio and the phase difference that radial (overtone) modes are most probably excited.
)
were determined (Rodríguez et al. 1997). Changes in amplitude on a long time scale are
confirmed for its main frequency (Zhou 2002). Furthermore, Montalbán & Dupret (2007)
concluded on the basis of a comparison between observed and theoretical values of the amplitude
ratio and the phase difference that radial (overtone) modes are most probably excited.
Given the circumstances and the data, we cannot extract more information for this target
at present, but the present results amply illustrate that new high-quality time series of
differential data organised at a later date would be very worthwhile in order to
accurately determine the full frequency content as well as its time-dependent behaviour.
A follow-up spectroscopic campaign would be needed to put additional contraints on the mode identification
and to enable an in-depth study of the pulsations of this new and atypical ![]() Scuti pulsator.
Scuti pulsator.
Our future work will be to analyse and further exploit the high-resolution spectra obtained here in the context of a broad study of the chemical composition of (poorly studied) main-sequence stars located in the lower end of the Cepheid instability strip, with the main objective to investigate the possible connection(s) between pulsation, radiative diffusion and multiplicity in this intriguing part of the H-R diagram.
Acknowledgements
We acknowledge funding from the Belgian Federal Science Policy in the framework of the projects "Modern Aspects of Theoretical and Observational (ground-based and space-borne) Astrophysics'' (Ref. IAP P5/36) and "Pulsation, chemical composition and multiplicity in main-sequence A- and F-type stars'' (Ref. MO/33/018). D.D. is grateful to Dr. Z. Kraicheva for many useful discussions and suggestions . This research is based on data obtained at the Observatoire de Haute-Provence, the Observatoire du Pic du Midi (France), the Hoher List Observatory (Germany) as well as the NAO Rozhen, operated by the Institute of Astronomy, Bulgarian Academy of Sciences (Bulgaria). We acknowledge the support of the Belgian Science Policy and the Bulgarian Academy of Sciences via bilateral project "Photometric and spectroscopic follow-up studies of binary systems of special interest''. The spectroscopic campaigns were funded by the Optical Infrared Coordination network (OPTICON) supported by the Research Infrastructures Programme of the European Commission. We kindly thank Drs. Hubeny and Lanz for making their computer codes available. We furthermore thank Dr. K. Reif, director of the Hoher List Observatory from the AIfA (Argelander Institute for Astronomy, University of Bonn), for the allocated telescope time. Part of the photometric data were acquired with equipment purchased thanks to a research fund financed by the Belgian National Lottery (1999). The referees made various useful suggestions which are gratefully appreciated. This research also made use of the SIMBAD database, operated at the Centre de Données Stellaires (Strasbourg, France).
Table 1: Target description. Nref is the number of references in SIMBAD at present. The spectral type is from Grenier et al. (1999).
Table 2: Journal of spectroscopic observations at NAO, OHP and TBL.
Table 4: Journal of CCD photometric exploratory observations of the variable candidates. Observations were made at the Beersel Hills Observatory (BHO) and the Hoher List Observatory from the Argelander Institute for Astronomy, Bonn (HLO).
Table 5: Log of the CCD differential multi-site photometric campaign conducted for HD 217860.
![\begin{figure}
\par\includegraphics[width=17cm,clip]{5574fig7.eps}
\end{figure}](/articles/aa/full/2007/32/aa5574-06/img75.gif) |
Figure 7: Successive frequency searches and spectral window of the Fourier analysis (Set All - filter V). |
| Open with DEXTER | |