A&A 461, 537-549 (2007)
DOI: 10.1051/0004-6361:20065210
A. Grigorieva1 - P. Artymowicz1,2 - Ph. Thébault1,3
1 - Stockholm Observatory, SCFAB, 10691 Stockholm, Sweden
2 -
University of Toronto at Scarborough, 1265 Military Trail,
Toronto, Ontario, M1C 1A4, Canada
3 -
Observatoire de Paris, Section de Meudon, 92195 Meudon Principal Cedex, France
Received 15 March 2006 / Accepted 29 August 2006
Abstract
We quantitatively investigate how collisional avalanches may develop
in debris discs as the result of
the initial breakup of a planetesimal or comet-like object,
triggering a collisional chain reaction due to outward
escaping small dust grains.
We use a specifically developed numerical code that follows both the
spatial distribution of the dust grains and
the evolution of their size-frequency distribution due to collisions.
We investigate how strongly avalanche propagation depends on
different parameters (e.g., amount of dust released in the initial breakup,
collisional properties of
dust grains, and their distribution in the disc).
Our simulations show that avalanches evolve on timescales of ![]() 1000 years,
propagating outwards following a spiral-like pattern, and
that their amplitude exponentially depends on the number density of dust grains
in the system.
We estimate the probability of witnessing an avalanche event as a function of
disc densities, for a gas-free case around an A-type star, and
find that features created by avalanche propagation can
lead to observable asymmetries for dusty systems with a
1000 years,
propagating outwards following a spiral-like pattern, and
that their amplitude exponentially depends on the number density of dust grains
in the system.
We estimate the probability of witnessing an avalanche event as a function of
disc densities, for a gas-free case around an A-type star, and
find that features created by avalanche propagation can
lead to observable asymmetries for dusty systems with a ![]() Pictoris-like
dust content or higher. Characteristic observable features include:
(i) a brightness asymmetry of the two sides for a disc viewed edge-on, and (ii) a one-armed open spiral or a lumpy structure in the case of face-on orientation.
A possible system in which avalanche-induced structures might
have been observed is the edge-on seen debris disc around HD 32297,
which displays a strong luminosity difference between its two sides.
Pictoris-like
dust content or higher. Characteristic observable features include:
(i) a brightness asymmetry of the two sides for a disc viewed edge-on, and (ii) a one-armed open spiral or a lumpy structure in the case of face-on orientation.
A possible system in which avalanche-induced structures might
have been observed is the edge-on seen debris disc around HD 32297,
which displays a strong luminosity difference between its two sides.
Key words: stars: circumstellar matter
- planetary systems: formation -
planetary systems: protoplanetary disks
- stars: individual: ![]() Pictoris - stars: individual: HD 32297
Pictoris - stars: individual: HD 32297
Direct imaging of circumstellar discs (e.g., Heap et al. 2000; Schneider et al. 2005; Liu 2004; Clampin et al. 2003)
have provided resolved disc morphologies for several systems
(e.g., ![]() Pic, HD 141569A, HD 100546, HD 32297) and have shown that
dust distribution is not always smooth and axisymmetric.
Warps, spirals, and other types of asymmetries are commonly
observed (e.g., Kalas & Jewitt 1995, for the
Pic, HD 141569A, HD 100546, HD 32297) and have shown that
dust distribution is not always smooth and axisymmetric.
Warps, spirals, and other types of asymmetries are commonly
observed (e.g., Kalas & Jewitt 1995, for the ![]() Pic system).
These morphological features can provide hints on important ongoing
processes in the discs and improve our
understanding of the evolution of circumstellar discs and of planetary formation.
Pic system).
These morphological features can provide hints on important ongoing
processes in the discs and improve our
understanding of the evolution of circumstellar discs and of planetary formation.
The usual explanation proposed for most of these asymmetries is the
perturbing influence of an embedded planet. As an example, the
warp in the ![]() Pic disc has been interpreted as induced
by a jovian planet on an inclined orbit (Mouillet et al. 1997; Augereau et al. 2001). Likewise,
for annulus-like
discs with sharp inner or outer edges, the most commonly proposed explanation
is truncation or gap opening due to planets or bound
stellar companions (e.g., Augereau & Papaloizou 2004), although alternative mechanisms such
as gas drag on dust grains within a gas disc of limited extent have also
been proposed (Takeuchi & Artymowicz 2001). For spiral structures, authors
have also been speculating on gravitational instabilities (Fukagawa et al. 2004),
as well as on a bound stellar companion (Augereau & Papaloizou 2004).
Pic disc has been interpreted as induced
by a jovian planet on an inclined orbit (Mouillet et al. 1997; Augereau et al. 2001). Likewise,
for annulus-like
discs with sharp inner or outer edges, the most commonly proposed explanation
is truncation or gap opening due to planets or bound
stellar companions (e.g., Augereau & Papaloizou 2004), although alternative mechanisms such
as gas drag on dust grains within a gas disc of limited extent have also
been proposed (Takeuchi & Artymowicz 2001). For spiral structures, authors
have also been speculating on gravitational instabilities (Fukagawa et al. 2004),
as well as on a bound stellar companion (Augereau & Papaloizou 2004).
The catastrophic breakup of one single large object
releasing a substantial amount of dust fragments could be
an alternative explanation for some of the observed asymmetries. Wyatt & Dent (2002)
have examined how such collisionally produced bright dust clumps
could be observed in Fomalhaut's debris disc. Likewise, such clumps have
been proposed by Telesco et al. (2005) as a possible explanation
for mid-infrared brightness asymmetries in the central ![]() Pictoris disc,
but only based on preliminary order of magnitude estimates.
More recently, the detailed study of Kenyon & Bromley (2005) investigated
the possibility of detecting catastrophic two-body collisions
in debris discs and found that such a detection would require
the breakup of 100-1000 km objects.
The common point between these different studies is that they focus
on global luminosity changes due to the debris cloud directly produced
by the shattering events themselves.
Pictoris disc,
but only based on preliminary order of magnitude estimates.
More recently, the detailed study of Kenyon & Bromley (2005) investigated
the possibility of detecting catastrophic two-body collisions
in debris discs and found that such a detection would require
the breakup of 100-1000 km objects.
The common point between these different studies is that they focus
on global luminosity changes due to the debris cloud directly produced
by the shattering events themselves.
In the present paper, we re-examine the consequences of isolated shattering impacts from a different perspective, i.e., by considering the collisional evolution of the produced dust cloud after its release by the shattering event. The main goal here is to study one possibly very efficient process, first proposed by Artymowicz (1997), but never quantitatively studied so far, i.e., the so-called collisional avalanche mechanism. The basic principle of this process is simple. After a localized disruptive event, such as the collisional breakup of a large cometary or planetesimal-like object, a fraction of the dust then produced is driven out by radiation pressure on highly eccentric or even unbound orbits. These grains moving away from the star with significant radial velocities can breakup or microcrater other particles farther out in the disc, creating in turn even more small particles propagating outwards and colliding with other grains. Should this collisional chain reaction be efficient enough, then a significant increase in the number of dust grains could be achieved. In this case, the consequences of a single shattering event, in terms of induced dust production, could strongly exceed that of the sole initially released dust population. The outward propagation of the dusty grains could then induce observable asymmetric features in the disc, even if the initially released dust cloud is undetectable.
The goal of this work is to perform the first quantitative study of the avalanche process and investigate the morphology of avalanches in debris discs, under the assumption that dust dynamics is not controlled by gas (Lagrange et al. 2000). For this purpose we have created a numerical code, described in Sect. 3, that enables us to simulate the coupled evolution of dynamics and size-frequency distribution of dusty grains. The results of our simulations, which explore the effect of several parameters (total mass and radial distribution of dust in the disc, mass and size distribution of the planetesimal debris, physical properties of the grains and the prescription for collisional outcome for grain-grain collisions) are presented in Sect. 4. In Sect. 5 we examine under which conditions avalanche-induced features might become observable. We end with a discussion of the probability of witnessing an avalanche (Sect. 6) and finally a summary (Sect. 7).
A dust avalanche is a chain reaction of outflowing debris impacting disc particles and creating even more debris accelerated outwards by the star's radiation pressure. The basic principle of this mechanism can be illustrated by a set of analytical equations. We present here a simplified theory of avalanches based on the order-of-magnitude approach of Artymowicz (1997), firstly for its pedagogical virtues, but also because it can serve as a reference that facilitates the understanding of the main results derived from our extensive numerical exploration.
Let us assume that N particles of size
![]() (radius)
move through a cloud of dust grains of size s
at a relatively high velocity. Let us further
assume that each collision produces a constant number
(radius)
move through a cloud of dust grains of size s
at a relatively high velocity. Let us further
assume that each collision produces a constant number
![]() of such debris,
which are quickly accelerated to velocities leading to further destructive collisions.
To derive the total number of debris produced by the avalanche,
we define the optical depth as
of such debris,
which are quickly accelerated to velocities leading to further destructive collisions.
To derive the total number of debris produced by the avalanche,
we define the optical depth as
 |
(2) |
In a disc, ![]() can be approximated by the optical thickness in the disc midplane,
can be approximated by the optical thickness in the disc midplane,
The number of dust grains in a circumstellar disc is far too large to follow every grain individually during the calculation; some kind of statistical approach must therefore be used. Models of dust disc evolution developed to date fall into two main categories. On the one hand, "particle in a box'' models divide the dust grains into statistical bins according to their size and enable us to compute the evolution of the size distribution within a given spatially homogeneous region (e.g., Thébault et al. 2003). While it is possible to mimic a spatially inhomogeneous system by integrating a set of coupled particle-in-a-box models, this can become unwieldy in the absence of strong simplifying symmetries. Kenyon & Bromley (2004) use a multiannulus code for example, but their model is one-dimensional in space. On the other hand, direct N-body simulations (treating the dust as test particles in the potential of a 2 or multi-body system) are used to accurately follow the spatial evolution of dynamical structures such as planet induced gaps or resonances (e.g., Augereau & Papaloizou 2004; Wyatt 2003). In this case, however, the sizes of the dust grains are either not taken into account or assumed to be equal.
For the present problem, however, we need to follow both the spatial distribution of the grains and their size distribution with reasonable accuracy. To do this, we developed a new code in which all grains with similar parameters (size, chemical composition, spatial coordinates, and velocity) are represented by a single superparticle (hereafter SP). We follow the dynamical evolution of these SPs and compute the collisional destruction and production of grains as SPs pass through each other. We represent newly created grains as new SPs. The maximum number of SPs our code can handle is about one million.
A detailed description of our SP modeling
is given in the appendix. Here we briefly outline
its main characteristics: a SP is described by the position and velocity of its
center of mass (which coincides with its geometrical center),
by its size, shape, and internal density profile,
and by the number of dust grains it contains.
For the present work all SPs are treated as cylinders and their geometrical
centers are constrained to lie in the midplane of the disc.
The cylinders have constant radii
![]() and variable heights
and variable heights
![]() ,
where R is the distance from the star (see Appendix A).
All grains inside a given SP are assumed to have the same physical properties.
We assume that all grains in our simulation are spheres with
identical densities, chemical compositions, and porosities.
The grains (and thus the SPs) are
distributed into mass bins separated by a factor 2
logarithmic mass increment (i.e., a factor of 1.26 in size).
,
where R is the distance from the star (see Appendix A).
All grains inside a given SP are assumed to have the same physical properties.
We assume that all grains in our simulation are spheres with
identical densities, chemical compositions, and porosities.
The grains (and thus the SPs) are
distributed into mass bins separated by a factor 2
logarithmic mass increment (i.e., a factor of 1.26 in size).
The trajectory of a SP corresponds to the trajectory of a test particle (with dynamical properties identical to the SP's grains) located at the SP's center of mass (see Sect. 3.2). SPs can overlap and freely pass through each other. In this event, collisional interactions between their respective grain populations is considered. This process is treated as a passage of two clouds of grains through each other (see Appendix A.3). It results in the loss, by destructive collisions, of a fraction of the initial grain populations and the production of smaller collisional fragments. These newly produced debris are placed into newly created SPs in accordance with the grain sizes and velocities. In the current version of the code, the centers of all SPs move in the same plane and the dust distribution is symmetric with respect to this midplane. However, the SPs representation method could in principle be used to model systems with vertical deformations (e.g., warps).
The size of a SP is fairly large (
![]() AU). This puts unavoidable constraints on
the spatial resolution of our simulations and prevents us from
modeling processes occurring on scales smaller than the SP radius.
It would, for example, be difficult to model fine resonant structures induced by
disc-planet interaction. Moreover, the current version of the method with a constant value of
the SP radius is not applicable to collisional evolution
in the inner regions (
AU). This puts unavoidable constraints on
the spatial resolution of our simulations and prevents us from
modeling processes occurring on scales smaller than the SP radius.
It would, for example, be difficult to model fine resonant structures induced by
disc-planet interaction. Moreover, the current version of the method with a constant value of
the SP radius is not applicable to collisional evolution
in the inner regions (![]() 20 AU) of debris discs. Although this limitation could be overcome
by introducing a dependence of the size of a SP on the distance
to the star (e.g.,
20 AU) of debris discs. Although this limitation could be overcome
by introducing a dependence of the size of a SP on the distance
to the star (e.g.,
![]() ), we have not implemented it in the current version
of the code, since our main goal here is to model collisional
avalanches that propagate outwards, inducing observationally significant
features in the outer (
), we have not implemented it in the current version
of the code, since our main goal here is to model collisional
avalanches that propagate outwards, inducing observationally significant
features in the outer (![]() 100 AU) regions of the disc.
100 AU) regions of the disc.
The grains inside a SP do not have explicit vertical velocity components. To check the validity of this assumption, we have performed test runs, for which an artificial vertical velocity dispersion term was added to the planar velocity, which showed no significant departure from the in-plane velocities case. Note that a vertical velocity component is, however, indirectly taken into account by the fact that SP heights increase with distance from the star (see Appendix A.3), accounting for the geometrical dilution of grain spatial densities.
As has been mentioned earlier, the trajectory of a SP is identical to
the trajectory of a test particle (with mass, size, and chemical
composition identical to those of the SP's grains)
located at the SP's center of mass.
Test particles move in the gravitational field of a star under the influence of the stellar
radiation force. The equation of motion reads:
The radiation pressure force is expressed as a function of the
gravitational force through the radiation pressure coefficient,
![]() , as
, as
A 7th-8th order Runge-Kutta method is used for integrating test particles trajectories. Although in the simulations presented in this paper the dynamics of the SPs is purely Keplerian, we have decided not to use analytical solutions since the Runge-Kutta integrator allows for an easy inclusion of any additional gravitational (due to planetary or stellar perturbers) or dissipative forces (such as PR and gas drag).
![\begin{figure}
\par\includegraphics[width=7.45cm,clip]{5210fig1.ps}\end{figure}](/articles/aa/full/2007/02/aa5210-06/img40.gif) |
Figure 1:
Ratio of the radiation pressure force to the gravitational
force vs. grain size for different grain materials and porosities, P,
calculated for an A5V ( |
| Open with DEXTER | |
The SP representation method is used to model the initial dusty disc structure.
The total number of SPs for each size bin is chosen so that, at any given
location in the disc, there are at least 2-5 overlapping SPs to account
for different dynamical characteristics of grains of this size at
this location.
Each of these overlapping SPs thus differs from the others by
its local velocity. To model the initial dust distribution in
the disc we use ![]() 5
5 ![]() 104 SPs (test runs with larger
number of SPs do not lead to significant changes in the results).
The number density of dust grains at a given location
in the disc is calculated as the sum of the grain densities of the overlapping SPs.
104 SPs (test runs with larger
number of SPs do not lead to significant changes in the results).
The number density of dust grains at a given location
in the disc is calculated as the sum of the grain densities of the overlapping SPs.
The archetypical, and still by far the best known,
debris disc of ![]() Pictoris is taken as
a reference system for the initial dusty disc structure.
In the present study we do not aim
to model this particular system and just adopt its
global properties for the dust distribution.
Alternative dust distributions are also explored in Sect. 4.5.
For the dust profile in
Pictoris is taken as
a reference system for the initial dusty disc structure.
In the present study we do not aim
to model this particular system and just adopt its
global properties for the dust distribution.
Alternative dust distributions are also explored in Sect. 4.5.
For the dust profile in ![]() Pictoris, we take
the results of Augereau et al. (2001), who numerically derived the dust distribution
giving the best fit to the resolved scattered light
images as well as the long-wavelength photometric data, as a reference.
We assume here that all grains are produced from parent bodies
on circular orbits following the best-fit parent body distribution given in
Augereau et al. (2001), where most of the bodies are located within an extended
annulus between 80 and 120 AU, with a depletion in the inner <50 AU region
and a sharp drop of the density distribution outside 120 AU (see for example Fig. 1 of Thébault & Augereau 2005). Grains with small
Pictoris, we take
the results of Augereau et al. (2001), who numerically derived the dust distribution
giving the best fit to the resolved scattered light
images as well as the long-wavelength photometric data, as a reference.
We assume here that all grains are produced from parent bodies
on circular orbits following the best-fit parent body distribution given in
Augereau et al. (2001), where most of the bodies are located within an extended
annulus between 80 and 120 AU, with a depletion in the inner <50 AU region
and a sharp drop of the density distribution outside 120 AU (see for example Fig. 1 of Thébault & Augereau 2005). Grains with small ![]() have almost the same orbits as their parent bodies (the biggest grains), while smaller grains (i.e., with higher
have almost the same orbits as their parent bodies (the biggest grains), while smaller grains (i.e., with higher ![]() )
have more elliptic orbits
depending on their
)
have more elliptic orbits
depending on their ![]() value. The initial number of grains as a function of their
size follows a classical single power law size-frequency distribution
value. The initial number of grains as a function of their
size follows a classical single power law size-frequency distribution
The vertical structure of the disc is expressed in terms of the vertical
geometrical optical thickness,
![]() ,
per unit
length, z, as
,
per unit
length, z, as
Collisions are the crucial mechanism for the development of the
avalanche phenomenon. The result of a collision,
in terms of the
size-frequency distribution of the debris, depends on several parameters:
projectile and target materials and structures, sizes, impact velocities,
and angle of incidence. Since it is not possible to model every collision in such
detail, we have to adopt a simplified algorithm.
We assume that the impact energy of colliding bodies,
![]() ,
is equally shared between them.
Laboratory experiments show that this is the case when both bodies are made from
identical material regardless of their sizes (Ryan et al. 1991).
,
is equally shared between them.
Laboratory experiments show that this is the case when both bodies are made from
identical material regardless of their sizes (Ryan et al. 1991).
![]() is:
is:
Collision outcomes are traditionally divided into two classes:
(1) catastrophic fragmentation, when the largest remaining fragment,
![]() ,
is less than half of the parent body mass, M,
and (2) cratering, when
,
is less than half of the parent body mass, M,
and (2) cratering, when
![]() .
The energy per unit mass that is
needed to get
.
The energy per unit mass that is
needed to get
![]() is called the threshold specific energy Q*.
If the specific energy
is called the threshold specific energy Q*.
If the specific energy
![]() received by a body is more than Q*, then the collision leads to catastrophic breakup, whereas cratering
occurs if Q < Q* (Fujiwara et al. 1977; Benz & Asphaug 1999; Petit & Farinella 1993). Q* is a function of size for
which we adopt a classical power law dependence (e.g., Ryan & Melosh 1998; Housen & Holsapple 1999).
The collisional response of the small objects considered in the present work
falls into the so-called strength regime, where the target's internal strength
is the dominant factor, for which
received by a body is more than Q*, then the collision leads to catastrophic breakup, whereas cratering
occurs if Q < Q* (Fujiwara et al. 1977; Benz & Asphaug 1999; Petit & Farinella 1993). Q* is a function of size for
which we adopt a classical power law dependence (e.g., Ryan & Melosh 1998; Housen & Holsapple 1999).
The collisional response of the small objects considered in the present work
falls into the so-called strength regime, where the target's internal strength
is the dominant factor, for which
To account for the effect of different incidence angles, we
correct the value of Q* by a correction factor
![]() corresponding to an average over all incidence angles
corresponding to an average over all incidence angles
In our calculations we do not consider changes in the orbital
parameters of the colliding bodies (i.e., SP), since
this effect is not important for the present study.
There are 2 reasons for this: (i) the lifetime of an avalanche
(typically ![]() 103 years) is very
short from the point of view of the global disc evolution,
thus we can neglect any changes in the disc dynamics
caused by mutual collisions
between the disc particles (i.e., "field SPs'' in our simulations);
(ii) the dynamics for the majority of the avalanche SPs are controlled
by the radiation pressure. Their orbital parameters are thus determined
mostly by their
103 years) is very
short from the point of view of the global disc evolution,
thus we can neglect any changes in the disc dynamics
caused by mutual collisions
between the disc particles (i.e., "field SPs'' in our simulations);
(ii) the dynamics for the majority of the avalanche SPs are controlled
by the radiation pressure. Their orbital parameters are thus determined
mostly by their ![]() values and only weakly depend on the velocities
at which these SPs are born (as is verified in Sect. 4.2.1
for the first generation of avalanche grains). In this respect, taking the velocity
of the center of mass of the colliding grains as the initial velocity for
the produced debris is a good approximation within the frame
of our simulations.
values and only weakly depend on the velocities
at which these SPs are born (as is verified in Sect. 4.2.1
for the first generation of avalanche grains). In this respect, taking the velocity
of the center of mass of the colliding grains as the initial velocity for
the produced debris is a good approximation within the frame
of our simulations.
As previously mentioned, we assume that the initial source of
the collisional avalanche is the breakup of a large, at least kilometer-sized object.
We do not perform a simulation of the initial shattering event itself,
but implement a simple parametric prescription for the dust released in the breakup. In most runs,
we consider a "nominal'' case, in which
M0=1020 g of dust is released in the ![]() m to 1 cm range at
m to 1 cm range at
![]() AU from the star, unless otherwise
explicitly specified. It should be noted that the released dust mass M0 is the only
relevant parameter for our simulations. In this respect, the exact process leading to the initial release is not crucial. However, when it comes to estimating the probability for such
a dust-release event to occur (as will be done in Sect. 6.1),
one has to consider the mass
AU from the star, unless otherwise
explicitly specified. It should be noted that the released dust mass M0 is the only
relevant parameter for our simulations. In this respect, the exact process leading to the initial release is not crucial. However, when it comes to estimating the probability for such
a dust-release event to occur (as will be done in Sect. 6.1),
one has to consider the mass
![]() of the parent
body whose shattering produces a mass M0 of dust. The ratio
of the parent
body whose shattering produces a mass M0 of dust. The ratio
![]() is obviously <1, but strongly depends on several poorly constrained parameters, mainly related to the physics
of the shattering event. For an idealized case when the largest fragment produced has mass
is obviously <1, but strongly depends on several poorly constrained parameters, mainly related to the physics
of the shattering event. For an idealized case when the largest fragment produced has mass
![]() and smaller fragments follow the Dohnanyi
"equilibrium'' size distribution (
and smaller fragments follow the Dohnanyi
"equilibrium'' size distribution (
![]() ),
one gets
),
one gets
![]() g. However,
laboratory and numerical studies as well as observations of asteroid families
(e.g., Tanga et al. 1999; Davis & Ryan 1990)
all point towards smaller
g. However,
laboratory and numerical studies as well as observations of asteroid families
(e.g., Tanga et al. 1999; Davis & Ryan 1990)
all point towards smaller
![]() and steeper size distributions for highly disruptive
impacts of large objects, with indexes typically in the -3.7 to -4 range
for the largest
and steeper size distributions for highly disruptive
impacts of large objects, with indexes typically in the -3.7 to -4 range
for the largest ![]()
![]() fragments and closer to -3.5for the smallest ones. Using for example the fragmentation prescription for
large objects of Thébault et al. (2003), we determine that for a typical shattering
at 1 km s-1,
fragments and closer to -3.5for the smallest ones. Using for example the fragmentation prescription for
large objects of Thébault et al. (2003), we determine that for a typical shattering
at 1 km s-1,
![]() g = 10M0, which corresponds to an object
of radius
g = 10M0, which corresponds to an object
of radius ![]() 40 km. We shall thus assume a nominal
40 km. We shall thus assume a nominal
![]() ratio of 0.1 for the discussion in Sect. 6.1.
For the size spectrum of the dust particles released in the
ratio of 0.1 for the discussion in Sect. 6.1.
For the size spectrum of the dust particles released in the
![]() m to 1 cm range, we assume a single power
law (Eq. (8) with
ps0=3.5) for our nominal case.
The dependence of the results on M0, ps0, and other
parameters related to the planetesimal debris is
explored in Sect. 4.2.
m to 1 cm range, we assume a single power
law (Eq. (8) with
ps0=3.5) for our nominal case.
The dependence of the results on M0, ps0, and other
parameters related to the planetesimal debris is
explored in Sect. 4.2.
For the sake of the readability of the results, it is convenient to
divide the system into two populations: 1) the avalanche particles,
representing all bodies initially released by the
planetesimal breakup plus all grains later created by
collisions between the avalanche particles and the disc material; and
2) the field particles, i.e., the population of grains in the disc
unaffected by the avalanche mechanism. To quantify the magnitude of an avalanche
we introduce the area amplification factor, ![]() ,
which is the ratio of the total cross-sectional area of the avalanche grains, within
500 AU from the star, to the initial cross-sectional area of planetesimal debris
released. The maximum value
,
which is the ratio of the total cross-sectional area of the avalanche grains, within
500 AU from the star, to the initial cross-sectional area of planetesimal debris
released. The maximum value
![]() reached by the amplification factor while the avalanche is propagating is used to measure the amplitude of a given avalanche and
to compare avalanches obtained for different initial
conditions. Time is expressed in orbital periods at 20 AU (
reached by the amplification factor while the avalanche is propagating is used to measure the amplitude of a given avalanche and
to compare avalanches obtained for different initial
conditions. Time is expressed in orbital periods at 20 AU (![]() 70 yr),
unless otherwise explicitly specified. Table 1 summarizes the set of initial parameters
chosen for our "nominal'' case. All free parameters of the simulations are then explored
in separate runs.
70 yr),
unless otherwise explicitly specified. Table 1 summarizes the set of initial parameters
chosen for our "nominal'' case. All free parameters of the simulations are then explored
in separate runs.
Table 1: Main model parameters for the nominal case.
![\begin{figure}
\par\includegraphics[height=4.25cm,width=4.25cm,angle=-90,clip]{5...
...cludegraphics[height=3.95cm,width=5.25cm,angle=-90,clip]{5210f2d.ps}\end{figure}](/articles/aa/full/2007/02/aa5210-06/img89.gif) |
Figure 2:
Nominal case. Color-coded maps (log-scale) of the
vertical optical thickness of avalanche grains,
|
| Open with DEXTER | |
Figure 2 shows the temporal evolution of an avalanche,
for the nominal case, in terms of the vertical optical thickness,
![]() ,
of the avalanche particles (
,
of the avalanche particles (
![]() ).
As expected, the first stages correspond to a fast development and multiplication of the avalanche grains. In this early expansion phase the surface density is dominated by the smallest high-
).
As expected, the first stages correspond to a fast development and multiplication of the avalanche grains. In this early expansion phase the surface density is dominated by the smallest high-![]() (
(![]() 0.5) particles, which contribute to
0.5) particles, which contribute to ![]()
![]() of
of
![]() .
The maximum value of the amplification factor is
.
The maximum value of the amplification factor is
![]() and is reached at
and is reached at
![]() (
(![]() 350 yr,
see Fig. 3). After that, the loss of small grains on unbound orbits dominates over the collisional production of new dust particles, and the avalanche begins to fade. In these later stages, the total cross sectional area of the avalanche grains (within 500 AU)
is increasingly dominated by the bigger grains on bound orbits.
It is important to point out that the timescale for the avalanche propagation
is short in comparison with orbital periods in the outer part of the disc
(e.g., only
350 yr,
see Fig. 3). After that, the loss of small grains on unbound orbits dominates over the collisional production of new dust particles, and the avalanche begins to fade. In these later stages, the total cross sectional area of the avalanche grains (within 500 AU)
is increasingly dominated by the bigger grains on bound orbits.
It is important to point out that the timescale for the avalanche propagation
is short in comparison with orbital periods in the outer part of the disc
(e.g., only ![]() 1/5 of the orbital period at 200 AU).
1/5 of the orbital period at 200 AU).
The amplification achieved by the avalanche mechanism is impressive, i.e.,
an increase in grain cross-sectional surface density by
two orders of magnitude compared to the particles initially released by
the planetesimal breakup (Fig. 3). However, absolute
values of
![]() are still very small compared to those of the field
particles, with
are still very small compared to those of the field
particles, with
![]() /
/
![]() never exceeding 10-2(see Sect. 5 for a more detailed discussion of this crucial parameter).
never exceeding 10-2(see Sect. 5 for a more detailed discussion of this crucial parameter).
To compare the results of our simulation with the simplified theory of Sect. 2,
we plot the ratio of the total number of grains
![]() produced by the avalanche until time t to the initial number
produced by the avalanche until time t to the initial number ![]() of released planetesimal debris
(Fig. 4). As can be clearly seen,
of released planetesimal debris
(Fig. 4). As can be clearly seen,
![]() quickly reaches
a plateau, and we take
quickly reaches
a plateau, and we take
![]() at t=15 as a reference value. Plugging values for the average number of particles produced by each grain-grain collision,
at t=15 as a reference value. Plugging values for the average number of particles produced by each grain-grain collision,
![]() ,
and
,
and
![]() into Eq. (5), we get
into Eq. (5), we get
![]() ,
i.e., a factor of
,
i.e., a factor of ![]() 7 difference with the result of our simulation. This is mainly due to the fact that
7 difference with the result of our simulation. This is mainly due to the fact that
![]() underestimates the real value of
underestimates the real value of ![]() ,
firstly
because the real path of a grain is curved rather
than parallel to a disc radius,
and secondly because in
,
firstly
because the real path of a grain is curved rather
than parallel to a disc radius,
and secondly because in
![]() the size of the avalanche grains
the size of the avalanche grains
![]() is neglected.
From our simulations, we were able to estimate the discrepancy
between
is neglected.
From our simulations, we were able to estimate the discrepancy
between ![]() and
and
![]() to be roughly of
a factor of 1.6. We thus get
to be roughly of
a factor of 1.6. We thus get
![\begin{figure}
\par\includegraphics[width=7.5cm,clip]{5210fig3.ps}\end{figure}](/articles/aa/full/2007/02/aa5210-06/img102.gif) |
Figure 3: Time evolution of the cross-sectional area amplification factor (the ratio of the total cross-sectional area of the avalanche grains within 500 AU to its initial value at t=0). Initial increase is due to dust production by outflowing planetesimal debris colliding with the disc material. When the grain removal (due to star radiation pressure) rate exceeds the grain production, the value of F drops (see text for more details). |
| Open with DEXTER | |
![\begin{figure}
\par\includegraphics[width=7.8cm,clip]{5210fig4.ps}\end{figure}](/articles/aa/full/2007/02/aa5210-06/img103.gif) |
Figure 4:
Ratio of the total number of grains produced by the avalanche
by the time t,
|
| Open with DEXTER | |
It is also interesting to link
![]() to the amplification factor parameter
to the amplification factor parameter
![]() .
By definition,
.
By definition,
The initial mass M0 of dust released has been explored as a free parameter. The simulations show that the maximum amplification factor,
![]() ,
does not vary with M0, at least in the
1012 g-1021 g range, a result that is in good agreement with
Eqs. (15) and (3). Likewise,
,
does not vary with M0, at least in the
1012 g-1021 g range, a result that is in good agreement with
Eqs. (15) and (3). Likewise,
![]() does not change much when varying the initial speed
does not change much when varying the initial speed ![]() of the center of mass of the planetesimal dust cloud.
There is only a 20% increase of
of the center of mass of the planetesimal dust cloud.
There is only a 20% increase of
![]() when
when ![]() is increased from
is increased from
![]() to
to
![]() .
This weak dependence on the initial velocity of the debris confirms the fact that avalanches are driven mostly by the smallest particles, which are accelerated to high speeds
weakly correlated to the initial release velocity.
.
This weak dependence on the initial velocity of the debris confirms the fact that avalanches are driven mostly by the smallest particles, which are accelerated to high speeds
weakly correlated to the initial release velocity.
For the nominal case we choose
![]() m. This value
is compatible with the lower limit for the size of the
interplanetary dust particles (Fraundorf et al. 1982). It is also in good agreement with the size distribution deduced from studies of cometary comas that show that the smallest particles are
about
m. This value
is compatible with the lower limit for the size of the
interplanetary dust particles (Fraundorf et al. 1982). It is also in good agreement with the size distribution deduced from studies of cometary comas that show that the smallest particles are
about
![]() m in diameter (Kolokolova et al. 2001). McDonnell et al. (1991)
observed smaller grains in comas, but their contribution to the
total dust population remained marginal. Even if grains smaller than
m in diameter (Kolokolova et al. 2001). McDonnell et al. (1991)
observed smaller grains in comas, but their contribution to the
total dust population remained marginal. Even if grains smaller than ![]() m are produced
abundantly in the planetesimal breakup, they are not expected to contribute
significantly to the avalanche process since they are
in the size range where
m are produced
abundantly in the planetesimal breakup, they are not expected to contribute
significantly to the avalanche process since they are
in the size range where ![]() decreases for smaller grains (see Fig. 1).
As a consequence, they have lower outgoing velocities which, together with their smaller masses,
lead to a marginal contribution in terms of impacting kinetic energy.
We thus believe
decreases for smaller grains (see Fig. 1).
As a consequence, they have lower outgoing velocities which, together with their smaller masses,
lead to a marginal contribution in terms of impacting kinetic energy.
We thus believe ![]() m to be a reliable minimum value for
m to be a reliable minimum value for
![]() and explored
and explored
![]() values in the
values in the ![]() m to
m to ![]() m range, the latter
value being the one considered by Kenyon & Bromley (2005). Although the impacting kinetic energy per grain is increasing in the
m range, the latter
value being the one considered by Kenyon & Bromley (2005). Although the impacting kinetic energy per grain is increasing in the ![]() m to
m to ![]() m size range (leading to an increase of the
m size range (leading to an increase of the
![]() ratio),
ratio),
![]() decreases with increasing
decreases with increasing
![]() (Fig. 5)
because of the decreasing value of the
(Fig. 5)
because of the decreasing value of the
![]() factor.
factor.
![\begin{figure}
\par\includegraphics[width=7.65cm,clip]{5210fig5.ps}\end{figure}](/articles/aa/full/2007/02/aa5210-06/img123.gif) |
Figure 5:
Maximum amplification factor as a function of the
minimum size assumed for the initial planetesimal debris. The power-law index for the size
distribution is equal to its nominal value
|
| Open with DEXTER | |
![\begin{figure}
\par\includegraphics[width=7.65cm,clip]{5210fig6.ps}\end{figure}](/articles/aa/full/2007/02/aa5210-06/img124.gif) |
Figure 6:
Dependence of the maximum amplification factor on the power-law index of the initial size-frequency distribution of the planetesimal debris (Eq. (8)),
|
| Open with DEXTER | |
Test runs have also been performed to check the
![]() dependence.
This exploration has shown that results do not depend on this parameter
for values higher than 1 cm. This is due to the fact that
grains bigger than this
size have very small
dependence.
This exploration has shown that results do not depend on this parameter
for values higher than 1 cm. This is due to the fact that
grains bigger than this
size have very small ![]() values, as well as a low
total cross-sectional area, which do not allow them to
significantly contribute to the avalanche propagation.
values, as well as a low
total cross-sectional area, which do not allow them to
significantly contribute to the avalanche propagation.
The dependence of
![]() on the power-law
index for the initial planetesimal debris size distribution,
on the power-law
index for the initial planetesimal debris size distribution,
![]() ,
is shown in Fig. 6.
It can be noted that increasing
,
is shown in Fig. 6.
It can be noted that increasing
![]() above 3.5 (value for the nominal case)
does not lead to a significant increase of
above 3.5 (value for the nominal case)
does not lead to a significant increase of
![]() ,
whereas
less steep power laws lead to a significant decrease in
,
whereas
less steep power laws lead to a significant decrease in
![]() .
.
We perform a set of runs in which the position of the planetesimal breakup, R0,
is varied between 20 and 100 AU (Fig. 7), but
all the other parameters remain identical to the
nominal case. The maximum amplification factor decreases with increasing R0 for two reasons: (i) the total amount of disc material through which
the outflowing grains propagate is higher when the grains are released
close to the star;
(ii) the unbound grains (
![]() )
have time to reach higher radial velocities
if they are released closer to the star (see Fig. 8),
which leads to more violent collisions and hence
higher dust production per collision.
)
have time to reach higher radial velocities
if they are released closer to the star (see Fig. 8),
which leads to more violent collisions and hence
higher dust production per collision.
![\begin{figure}
\par\includegraphics[width=7.6cm,clip]{5210fig7.ps}\end{figure}](/articles/aa/full/2007/02/aa5210-06/img127.gif) |
Figure 7: Dependence of the maximum amplification factor on the location of the primary planetesimal breakup. |
| Open with DEXTER | |
![\begin{figure}
\par\includegraphics[width=7.85cm,clip]{5210fig8.ps}\end{figure}](/articles/aa/full/2007/02/aa5210-06/img128.gif) |
Figure 8:
Radial velocities vs. distance from the star for grains with
different |
| Open with DEXTER | |
In the nominal case we assume that the minimum size,
![]() ,
for the debris produced by collisions and the minimum size of the initial
planetesimal debris,
,
for the debris produced by collisions and the minimum size of the initial
planetesimal debris,
![]() ,
are both equal to
,
are both equal to ![]() m.
We have seen in Sect. 4.2.2 that we do not expect
significant changes when
m.
We have seen in Sect. 4.2.2 that we do not expect
significant changes when
![]() m.
However, the situation is slightly different for avalanche grains,
since these grains are continuously produced through collisions.
We investigate this parameter's effect in
test runs exploring different values for
m.
However, the situation is slightly different for avalanche grains,
since these grains are continuously produced through collisions.
We investigate this parameter's effect in
test runs exploring different values for
![]() (Fig. 9).
As can easily be seen,
(Fig. 9).
As can easily be seen,
![]() does not strongly vary
with
does not strongly vary
with
![]() for
for
![]() m.
There are two reasons for that: i)
m.
There are two reasons for that: i) ![]() decreases with decreasing sizes for grains smaller then
decreases with decreasing sizes for grains smaller then
![]()
![]() m (Fig. 1), thus preventing them from
significantly contributing to the avalanche propagation;
ii) the broken power law for the debris size distribution, and
especially the flatter index q1=1.5 for the smallest grains, prevents
them from taking up most of the cross-sectional area of the avalanche grains.
m (Fig. 1), thus preventing them from
significantly contributing to the avalanche propagation;
ii) the broken power law for the debris size distribution, and
especially the flatter index q1=1.5 for the smallest grains, prevents
them from taking up most of the cross-sectional area of the avalanche grains.
![\begin{figure}
\par\includegraphics[width=7.6cm,clip]{5210fig9.ps}\end{figure}](/articles/aa/full/2007/02/aa5210-06/img132.gif) |
Figure 9:
Dependence of the maximum amplification factor on the minimum
size for debris produced in avalanche collisions
(Eq. (12) with
|
| Open with DEXTER | |
Numerical exploration of the position of the slope
change ms (with
![]() m) and of the m>ms power-law index q2
shows that the resulting amplification factor only weakly depends on
these parameters. Changing
m) and of the m>ms power-law index q2
shows that the resulting amplification factor only weakly depends on
these parameters. Changing
![]() from 1 to 10 leads to changes in
from 1 to 10 leads to changes in
![]() by only a factor
by only a factor ![]() 2.
On the contrary, variation in the q1 index can significantly
affect
2.
On the contrary, variation in the q1 index can significantly
affect
![]() ,
especially
for q1>5/3, when most of the produced cross-sectional area resides in
the smaller grains (Fig. 10).
,
especially
for q1>5/3, when most of the produced cross-sectional area resides in
the smaller grains (Fig. 10).
![\begin{figure}
\par\includegraphics[width=7.6cm,clip]{5210f10.ps}\end{figure}](/articles/aa/full/2007/02/aa5210-06/img135.gif) |
Figure 10: Dependence of the maximum amplification factor on the value q1 in Eq. (12) for collisionally produced grains (q2=1.83). |
| Open with DEXTER | |
The exact chemical composition of circumstellar
disc material is not well constrained and might in any case
vary from one system to the other.
There is observational evidence for silicates, ices, and metals
(e.g., Pantin et al. 1997; Bouwman et al. 2003), but their exact proportions in individual
grains are difficult to estimate. Several detailed studies have
addressed this issue for the specific ![]() Pic case
(e.g., Pantin et al. 1997; Li & Greenberg 1998), but the estimates remain
model dependent.
Changes in grain compositions might affect the results in two ways:
(i) compositional changes can lead to different values of
Pic case
(e.g., Pantin et al. 1997; Li & Greenberg 1998), but the estimates remain
model dependent.
Changes in grain compositions might affect the results in two ways:
(i) compositional changes can lead to different values of ![]() ,
so that
the grains experience different radiation pressure and
as a consequence reach different outgoing (and impacting) velocities; and
(ii) their collisional response properties can be significantly different.
,
so that
the grains experience different radiation pressure and
as a consequence reach different outgoing (and impacting) velocities; and
(ii) their collisional response properties can be significantly different.
We first explore the role of grain porosities by varying this parameter
between P=0 (compact grains, nominal case) and P=0.8 (highly porous grains),
with Q*0 remaining constant. This constant Q*0 prescription might seem counter-intuitive
at first, since more porous grains should be expected to be more
fragile, but it is, in fact, supported by numerical experiments showing
that porous targets often prove more resistant than non-porous ones
(e.g., Ryan et al. 1991; Flynn & Durda 2004; Love et al. 1993), the reason being that impact shock waves are effectively dissipated by the pores. Figure 11 shows that avalanche strength is maximum for the nominal case of
compact grains (
![]() )
and decreases for porous
grains (
)
and decreases for porous
grains (
![]() ).
).
We numerically explore the importance of chemical composition
by performing runs for the 2 extreme cases of pure (compact) silicates
(Mg
![]() Fe
Fe
![]() SiO3) and pure (compact) water ices.
Here again, we take the possibly
counter-intuitive constant Q*0 assumption, which is here again
supported by experimental results showing that for target-projectile pairs
of the same material, ices can be as strong as silicates (e.g., Ryan et al. 1999).
Furthermore, compact ices and silicates of equivalent sizes have similar
SiO3) and pure (compact) water ices.
Here again, we take the possibly
counter-intuitive constant Q*0 assumption, which is here again
supported by experimental results showing that for target-projectile pairs
of the same material, ices can be as strong as silicates (e.g., Ryan et al. 1999).
Furthermore, compact ices and silicates of equivalent sizes have similar ![]() values in the
values in the ![]() m range (see Fig. 1). It is thus
not surprising that our results show no significant difference
between the pure-ice (
m range (see Fig. 1). It is thus
not surprising that our results show no significant difference
between the pure-ice (
![]() )
and pure-silicate runs (
)
and pure-silicate runs (
![]() ).
).
In a third set of runs we separately explore the Q* parameter, whose
values for given grain compositions and dynamical conditions
are still not well constrained by experiments or theoretical studies.
The threshold energy estimates for silicate-silicate and ice-ice collisions
might vary between ![]() 106 and a few
106 and a few
![]() erg/g
(e.g., Ryan et al. 1999; Holsapple et al. 2002; Benz & Asphaug 1999).
We explore Q0* values between 106 and 108 erg/g and
obtain strong variations in
erg/g
(e.g., Ryan et al. 1999; Holsapple et al. 2002; Benz & Asphaug 1999).
We explore Q0* values between 106 and 108 erg/g and
obtain strong variations in
![]() (Fig. 12). For the lowest
explored Q0* value of 106 erg/g, we get
(Fig. 12). For the lowest
explored Q0* value of 106 erg/g, we get
![]() ,
which is about 50 times higher than
in the nominal case (
Q0* = 107 erg/g).
,
which is about 50 times higher than
in the nominal case (
Q0* = 107 erg/g).
![\begin{figure}
\par\includegraphics[width=7.4cm,clip]{5210f11.ps}\end{figure}](/articles/aa/full/2007/02/aa5210-06/img142.gif) |
Figure 11: Maximum amplification factor as a function of porosity for pure silicate grains. The value of the threshold energy, Q*, is assumed to be the same as in the nominal case. |
| Open with DEXTER | |
![\begin{figure}
\par\includegraphics[width=7.6cm,clip]{5210f12.ps}\end{figure}](/articles/aa/full/2007/02/aa5210-06/img143.gif) |
Figure 12: Maximum amplification factor vs. value of the threshold energy, Q*. Values for s0=1 cm grains are denoted on the axis. For the other sizes the threshold energy is given by Eq. (11). |
| Open with DEXTER | |
![\begin{figure}
\par\includegraphics[width=7.8cm,clip]{5210f13.ps}\end{figure}](/articles/aa/full/2007/02/aa5210-06/img145.gif) |
Figure 13:
Different test radial distributions for
|
| Open with DEXTER | |
As mentioned earlier, our reference field particle disc
was assumed to be similar to the ![]() Pictoris system, for which the
dust profile derived by Augereau et al. (2001) has been taken.
Here we explore alternative profiles
(Fig. 13). Results show that
Pictoris system, for which the
dust profile derived by Augereau et al. (2001) has been taken.
Here we explore alternative profiles
(Fig. 13). Results show that
![]() does not strongly depend on the shape of
the density distribution profile as long as the total
radial optical depth of the system (within 500 AU)
does not strongly depend on the shape of
the density distribution profile as long as the total
radial optical depth of the system (within 500 AU)
![]() remains the same.
This result is in agreement with the simplified theory presented in
Sect. 2.
remains the same.
This result is in agreement with the simplified theory presented in
Sect. 2.
On the other hand, we get drastic
![]() variations when changing the value of
variations when changing the value of
![]() (regardless of the radial profile). Figure 14 shows for example that
increasing the number density by a factor of 5 leads to a value of
(regardless of the radial profile). Figure 14 shows for example that
increasing the number density by a factor of 5 leads to a value of
![]() ,
which is a factor of
,
which is a factor of ![]() 1000 higher. This strong increase in
1000 higher. This strong increase in
![]() is in agreement with
Eq. (15), which predicts a strictly exponential growth with
is in agreement with
Eq. (15), which predicts a strictly exponential growth with
![]() ,
if
,
if
![]() is constant. However, in the simulations we find that
is constant. However, in the simulations we find that
![]() weakly varies with
weakly varies with
![]() through the empirical relation
through the empirical relation
![]() .
Plugging this expression for
.
Plugging this expression for
![]() and
and
![]() into Eq. (15) we get:
into Eq. (15) we get:
![\begin{figure}
\par\includegraphics[width=7.65cm,clip]{5210f14.ps}\end{figure}](/articles/aa/full/2007/02/aa5210-06/img149.gif) |
Figure 14:
Maximum amplification factor as a function of |
| Open with DEXTER | |
So far we have been concerned with the way an avalanche develops in a disc, in particular with how much dust can be created compared to the initial amount of released grains.
This was quantified by the amplification factor
![]() .
However, the crucial issue is under which conditions such
an avalanche might become observable.
In this respect, looking at
.
However, the crucial issue is under which conditions such
an avalanche might become observable.
In this respect, looking at
![]() is not enough.
What matters here is the ratio between the luminosity of the avalanche particles and
that of the "field'' particles,
is not enough.
What matters here is the ratio between the luminosity of the avalanche particles and
that of the "field'' particles,
![]() .
.
The value of
![]() corresponding to
the observability limit
depends on several factors, such as the physical parameters of the system,
observational conditions, and the observing devices' characteristics.
Since our current study is not dedicated to a specific system,
it is impossible to give a precise criterion for avalanche observability.
We shall thus adopt a simple and probably conservative criteria in which
an avalanche is deemed observable when
corresponding to
the observability limit
depends on several factors, such as the physical parameters of the system,
observational conditions, and the observing devices' characteristics.
Since our current study is not dedicated to a specific system,
it is impossible to give a precise criterion for avalanche observability.
We shall thus adopt a simple and probably conservative criteria in which
an avalanche is deemed observable when
![]() is reached at a given location in the disc.
is reached at a given location in the disc.
Most of the resolved debris disc images have been obtained
in the visual or near-infrared (NIR) domains,
dominated by scattered starlight.
We shall thus focus here more specifically on scattered
light luminosity.
The amount of light scattered towards an observer
coming from a given region of the disc is proportional to
![\begin{figure}
\par {\hspace*{6mm}\includegraphics[angle=-90,width=6.4cm,clip]{5...
...*{6mm}}\vspace*{3mm}
\includegraphics[width=7.7cm,clip]{5210f15b.ps}\end{figure}](/articles/aa/full/2007/02/aa5210-06/img156.gif) |
Figure 15: Top panel: face-on case: color-coded map of the ratio between the geometric surface densities of the avalanche grains and that of the "field'' population for the nominal case. Bottom panels: edge-on case: midplane fluxes (arbitrary units) for the nominal case at avalanche maximum, edge-on orientation. The 2 solid lines indicates the total midplane fluxes ("field''+avalanche) for each side of the disc (differences between the 2 sides are so small here that the 2 lines are almost indistinguishable). The dashed lines show the midplane fluxes for just the avalanche particles. Plot a) corresponds to the forward scattering function and b) to the isotropic case. |
| Open with DEXTER | |
For avalanche detection, the visible domain (![]()
![]() m)
is probably more favorable than the NIR (
m)
is probably more favorable than the NIR (![]() m).
This is because avalanches consist mostly of submicron grains,
which scatter very inefficiently at 1-
m).
This is because avalanches consist mostly of submicron grains,
which scatter very inefficiently at 1-![]() m compared to
bigger grains a few microns in size
(which is the average size for the "field'' population).
At the same time, in the visual domain
m compared to
bigger grains a few microns in size
(which is the average size for the "field'' population).
At the same time, in the visual domain
![]() is nearly the same (within
a factor of 2, depending on the exact chemical composition)
for submicron and micron grains. Thus the ratio
is nearly the same (within
a factor of 2, depending on the exact chemical composition)
for submicron and micron grains. Thus the ratio
![]() is expected to be higher
in the visual than in the NIR. For simplicity we assume that
is expected to be higher
in the visual than in the NIR. For simplicity we assume that ![]() is only a function of the scattering angle
is only a function of the scattering angle ![]() and that
and that
![]() is independent of the grain size.
Although it is not exactly the case, this simplification
can be considered as a reasonable starting point.
is independent of the grain size.
Although it is not exactly the case, this simplification
can be considered as a reasonable starting point.
Here we consider two extreme cases of disc orientation, i.e., discs
seen exactly edge-on and exactly pole-on. For the pole-on case, we determine that
![]()
![]() /
/
![]() and thus use maps of the ratio between these vertical optical depths. For the edge-on case, we consider the synthetic midplane flux in scattered light,
computed for different scattering functions. Since we do not know the exact optical properties of the circumstellar grains, two bracket cases have been considered for our calculations: isotropic and forward scattering. For the forward scattering function we use an analytical approximation
of the empirical
and thus use maps of the ratio between these vertical optical depths. For the edge-on case, we consider the synthetic midplane flux in scattered light,
computed for different scattering functions. Since we do not know the exact optical properties of the circumstellar grains, two bracket cases have been considered for our calculations: isotropic and forward scattering. For the forward scattering function we use an analytical approximation
of the empirical
![]() for cometary dust, obtained from measurements
of solar system comets (Artymowicz 1997, and references therein):
for cometary dust, obtained from measurements
of solar system comets (Artymowicz 1997, and references therein):
As can be clearly seen in Fig. 15,
in the nominal case
![]() never exceeds 10-2, neither in the edge-on nor
in the head-on configuration. This value is far below our observability
criterion and the asymmetries induced by the
corresponding avalanche would thus probably be undetectable by scattered
light observations.
never exceeds 10-2, neither in the edge-on nor
in the head-on configuration. This value is far below our observability
criterion and the asymmetries induced by the
corresponding avalanche would thus probably be undetectable by scattered
light observations.
The most straightforward way of getting a more prominent avalanche is to
increase the initially released amount of dust.
As shown in Sect. 4.2.1,
![]() remains constant with
varying M0, so that the ratio
remains constant with
varying M0, so that the ratio
![]() increases linearly with M0. As a consequence, the release of
increases linearly with M0. As a consequence, the release of ![]() 1022 g of dust would be required for the avalanche-induced luminosities to become comparable to that of the
rest of the disc. One might wonder however if a planetesimal shattering releasing
this large amount of dust is a common event (see discussion in Sect. 6.1).
1022 g of dust would be required for the avalanche-induced luminosities to become comparable to that of the
rest of the disc. One might wonder however if a planetesimal shattering releasing
this large amount of dust is a common event (see discussion in Sect. 6.1).
![\begin{figure}
\par {\hspace*{6mm}\includegraphics[angle=-90,width=6.5cm,clip]{5...
...s}\hspace*{6mm}}
\par\includegraphics[width=7.7cm,clip]{5210f16b.ps}\end{figure}](/articles/aa/full/2007/02/aa5210-06/img165.gif) |
Figure 16:
Same as Fig. 15, but
for collisionally weaker grains
with
|
| Open with DEXTER | |
As has been seen in Sect. 4.4,
![]() increases
strongly for grains with lower specific energy values Q*.
The lowest Q* value explored in Fig. 11,
increases
strongly for grains with lower specific energy values Q*.
The lowest Q* value explored in Fig. 11,
![]() erg/g, leads to
erg/g, leads to
![]() /
/
![]()
![]() 0.4-0.5. Thus, observability might be marginally reached when assuming
the minimum shattering resistance for dust grains.
0.4-0.5. Thus, observability might be marginally reached when assuming
the minimum shattering resistance for dust grains.
![\begin{figure}
\par {\hspace*{6mm}\includegraphics[angle=-90,width=6.5cm,clip]{5...
...{6mm}}\vspace*{3mm}
\includegraphics[width=7.95cm,clip]{5210f17b.ps}\end{figure}](/articles/aa/full/2007/02/aa5210-06/img167.gif) |
Figure 17: Same as Fig. 15, but for the case of a disc 5 times more massive than in the nominal case. |
| Open with DEXTER | |
The parameter exploration of Sect. 4 has clearly shown that
the most efficient parameter for reaching high
![]() values is the field particles number density
values is the field particles number density ![]() (Eq. (16)). An obvious way of increasing
(Eq. (16)). An obvious way of increasing ![]() is to assume a more massive disc, as has been done in Sect. 4.5.
In terms of avalanche observability, we find that
the observability criteria,
is to assume a more massive disc, as has been done in Sect. 4.5.
In terms of avalanche observability, we find that
the observability criteria,
![]() ,
is
reached for a disc that is 4-5 times more dusty than in the nominal
case. In this case, azimuthal asymmetries become clearly visible in the
face-on configuration and two-sided brightness
asymmetries for the edge-on case (Fig. 17).
A massive dusty disc thus looks very promising from the point of
view of avalanche observation.
,
is
reached for a disc that is 4-5 times more dusty than in the nominal
case. In this case, azimuthal asymmetries become clearly visible in the
face-on configuration and two-sided brightness
asymmetries for the edge-on case (Fig. 17).
A massive dusty disc thus looks very promising from the point of
view of avalanche observation.
![\begin{figure}
\par {\hspace*{6mm}\includegraphics[angle=-90,width=6.5cm,clip]{5...
...*{6mm}}\vspace*{3mm}
\includegraphics[width=7.7cm,clip]{5210f18b.ps}\end{figure}](/articles/aa/full/2007/02/aa5210-06/img169.gif) |
Figure 18: Same as Fig. 15, but for a vertically thinner disc, described by Eq. (19). The total mass of the disc is the same as in the nominal case, but the asymmetries become prominent. |
| Open with DEXTER | |
Another way to reach higher values of ![]() is to keep the same total amount of dust,
but distributed in a vertically thinner disc. In the nominal case the dusty disc has the characteristic width
is to keep the same total amount of dust,
but distributed in a vertically thinner disc. In the nominal case the dusty disc has the characteristic width ![]() (Eq. (10)), a superexponential vertical profile
(Eq. (9)), and a corresponding
(Eq. (10)), a superexponential vertical profile
(Eq. (9)), and a corresponding
![]() .
Assuming now a disc of thickness
.
Assuming now a disc of thickness
![]() ,
with a constant vertical profile
,
with a constant vertical profile
The numerical investigation of the previous
sections has shown that collisional avalanches are
a powerful and efficient mechanism that naturally
develops in debris discs after the breakup of a large planetesimal.
However, in our nominal case of a ![]() Pic-like system and
M0=1020 g of dust initially released, the asymmetric
features produced by the avalanche probably remain too weak
to be observable in scattered light (Sect. 5.1).
This result should, however, be taken with great care
since our parameter exploration has
shown that avalanche strength strongly depends
on several critical and often poorly constrained parameters.
The first set of parameters is those linked to the initial
breakup event. Here we obtain the intuitive result that
higher amounts of initially released dust leads to
more powerful avalanches (see Sect. 5.2),
with the avalanche strength scaling linearly with M0.
This is not unique to the avalanche mechanism: Kenyon & Bromley (2005)
find a similar dependence when only considering the signature of the
cloud of primary debris produced immediately after the planetesimal breakup.
What distinguishes our results from studies
in which only dust released at impact is considered is that avalanches
strongly depend on the number density of dust in the disc.
Section 4.5 has indeed shown that the global optical depth of
the dust disc
Pic-like system and
M0=1020 g of dust initially released, the asymmetric
features produced by the avalanche probably remain too weak
to be observable in scattered light (Sect. 5.1).
This result should, however, be taken with great care
since our parameter exploration has
shown that avalanche strength strongly depends
on several critical and often poorly constrained parameters.
The first set of parameters is those linked to the initial
breakup event. Here we obtain the intuitive result that
higher amounts of initially released dust leads to
more powerful avalanches (see Sect. 5.2),
with the avalanche strength scaling linearly with M0.
This is not unique to the avalanche mechanism: Kenyon & Bromley (2005)
find a similar dependence when only considering the signature of the
cloud of primary debris produced immediately after the planetesimal breakup.
What distinguishes our results from studies
in which only dust released at impact is considered is that avalanches
strongly depend on the number density of dust in the disc.
Section 4.5 has indeed shown that the global optical depth of
the dust disc ![]() is the parameter avalanche
development depends most on, the dependence being
close to an exponential.
We have seen that other parameters, mostly related to the way the
physical response of grains to collisions is modeled, might also
lead to observable events when stretched to the extreme values
that were numerically explored here. This is in particular the case for Q*,
for which very low
is the parameter avalanche
development depends most on, the dependence being
close to an exponential.
We have seen that other parameters, mostly related to the way the
physical response of grains to collisions is modeled, might also
lead to observable events when stretched to the extreme values
that were numerically explored here. This is in particular the case for Q*,
for which very low ![]() 106 erg/g values might lead to powerful
avalanches.
106 erg/g values might lead to powerful
avalanches.
We shall however leave these "technical'' parameters aside
to focus on the 2 parameters directly related to the system's properties themselves, i.e.,
the optical depth, both
![]() and
and ![]() ,
and the initial amount
of dust released M0, and derive an order-of-magnitude estimate
for the probability
of witnessing avalanche events as a function of these parameters.
From the results of Sect. 4, the
,
and the initial amount
of dust released M0, and derive an order-of-magnitude estimate
for the probability
of witnessing avalanche events as a function of these parameters.
From the results of Sect. 4, the
![]() criterion for observability might be written
criterion for observability might be written
We defer a detailed application of our model to specific circumstellar discs to a future study. However, the present results can already give a good idea of the typical profile for a "good'' avalanche-system candidate.
Our numerical exploration has shown that structures that are the most
likely to be associated with avalanche-events have
two-sided asymmetry for discs viewed edge-on and
open spiral patterns for discs viewed pole-on
or at intermediate inclinations. An additional requirement is that
these discs should be dust-rich systems, with a dustiness
at least equal to, and preferably higher than that of ![]() -Pic.
Note also that our model makes an additional prediction,
i.e., that avalanche affected regions should consist of
grains significantly smaller than the "field'' particles in
the rest of the disc. If the blow-out radius of grains
is of the order of the wavelength of the observed light,
then this should translate into color
differences between avalanche (bluer) and non-avalanche
(redder) regions.
-Pic.
Note also that our model makes an additional prediction,
i.e., that avalanche affected regions should consist of
grains significantly smaller than the "field'' particles in
the rest of the disc. If the blow-out radius of grains
is of the order of the wavelength of the observed light,
then this should translate into color
differences between avalanche (bluer) and non-avalanche
(redder) regions.
In this respect, one good edge-on candidate might be the recently discovered
HD 32297 system, which exhibits a strong two-sided asymmetry.
As reported by Schneider et al. (2005) and Kalas (2005), this system is a ![]() Pic
analog with its SW side significantly brighter than
the NE one within
Pic
analog with its SW side significantly brighter than
the NE one within ![]() 100 AU (Schneider et al. 2005)
and possibly outside 500 AU (Kalas 2005). Such a two-sided asymmetry would be compatible
with the ones obtained in our simulations (as shown for example
in the bottom panel of Fig. 18).
Furthermore, Kalas (2005) also reported a color asymmetry
between the two sides, with the brighter one (SW) being
significantly bluer. This seems to indicate that this side
is made of smaller, possibly submicron grains (Kalas 2005).
As previously discussed, this is
what should be expected for an avalanche-affected region.
However, an alternative scenario, like the collision with a clump of interstellar medium proposed by (Kalas 2005), might also explain the HD 32287 disc structure. Future imaging
and spectroscopic observations are probably needed before
reaching any definitive conclusions.
100 AU (Schneider et al. 2005)
and possibly outside 500 AU (Kalas 2005). Such a two-sided asymmetry would be compatible
with the ones obtained in our simulations (as shown for example
in the bottom panel of Fig. 18).
Furthermore, Kalas (2005) also reported a color asymmetry
between the two sides, with the brighter one (SW) being
significantly bluer. This seems to indicate that this side
is made of smaller, possibly submicron grains (Kalas 2005).
As previously discussed, this is
what should be expected for an avalanche-affected region.
However, an alternative scenario, like the collision with a clump of interstellar medium proposed by (Kalas 2005), might also explain the HD 32287 disc structure. Future imaging
and spectroscopic observations are probably needed before
reaching any definitive conclusions.
Among all head-on observed systems, the one displaying the most
avalanche-like structure is without doubt
HD 141569 (Clampin et al. 2003), with its pronounced spiral
pattern. Furthermore, the disc's mass, significantly
higher than ![]() -Pictoris, makes it a perfect candidate in terms
of witnessing probabilities. Of course, avalanche is
not the only possible scenario here, and several alternative
explanations, like an eccentric bound planet or
stellar companion, or a stellar flyby
have already been proposed (e.g., Augereau & Papaloizou 2004; Ardila et al. 2005; Wyatt 2005).
One should, however, be aware that
this system is strictly speaking not a "standard'' debris disc
as defined by Lagrange et al. (2000) and as considered in the present study.
Indeed, several studies seem to suggest the presence
of large amounts of primordial gas (Zuckerman et al. 1995; Ardila et al. 2005).
-Pictoris, makes it a perfect candidate in terms
of witnessing probabilities. Of course, avalanche is
not the only possible scenario here, and several alternative
explanations, like an eccentric bound planet or
stellar companion, or a stellar flyby
have already been proposed (e.g., Augereau & Papaloizou 2004; Ardila et al. 2005; Wyatt 2005).
One should, however, be aware that
this system is strictly speaking not a "standard'' debris disc
as defined by Lagrange et al. (2000) and as considered in the present study.
Indeed, several studies seem to suggest the presence
of large amounts of primordial gas (Zuckerman et al. 1995; Ardila et al. 2005).
Gas drag effects have been left out of the present study on purpose,
mainly because, in the strict sense of the term,
debris discs are systems where dust dynamics is
not dominated by gas friction (Lagrange et al. 2000).
Moreover, the correct description of dust-gas coupling adds several
additional free parameters (gas density and temperature distributions,
etc.) and requires a full 2D or 3D treatment of gas
by far exceeding the scope of the present paper.
However, the issue of avalanches in a gaseous medium might
be a crucial one for those systems that are most favorable
for avalanches, i.e., discs more dusty than
![]() -Pic, a system which is already at the upper end
of debris-discs in terms of dustiness (e.g., Spangler et al. 2001).
Such more massive systems should fall into a loosely defined
category of "transition'' discs between T-Tauri or Herbig Ae
protoplanetary systems and "proper'' debris discs
(see for example Sect. 4 of Dutrey et al. 2004).
For such systems (of which HD 141569 is a typical example),
which are younger than the more evolved
debris discs, risks (or chances) of encountering
large amounts of remaining gas are high.
This crucial issue will be the subject of a forthcoming paper.
-Pic, a system which is already at the upper end
of debris-discs in terms of dustiness (e.g., Spangler et al. 2001).
Such more massive systems should fall into a loosely defined
category of "transition'' discs between T-Tauri or Herbig Ae
protoplanetary systems and "proper'' debris discs
(see for example Sect. 4 of Dutrey et al. 2004).
For such systems (of which HD 141569 is a typical example),
which are younger than the more evolved
debris discs, risks (or chances) of encountering
large amounts of remaining gas are high.
This crucial issue will be the subject of a forthcoming paper.
This paper presents the first quantitative study of the collisional avalanche process in debris discs, i.e., the chain reaction of dust grain collisions triggered by the initial breakup of a planetesimal-like body. We have developed a code that allows us to simultaneously follow both spatial and size distributions of the dust grain population, which is collisionally evolving because of impacts caused by small particles blown out of the system by the star's radiation pressure. Our results can be summarized as follows:
All SPs are cylinders with variable height
![]() and constant radius
and constant radius
![]() .
Their geometrical centers always stay in the disc midplane.
For most of the runs we take
.
Their geometrical centers always stay in the disc midplane.
For most of the runs we take
![]() AU.
Test runs showed that an avalanche development weakly depends on the
value for
AU.
Test runs showed that an avalanche development weakly depends on the
value for
![]() .
The maximum amplification factor
for runs with
.
The maximum amplification factor
for runs with
![]() in the 4-8 AU range differs by less then
in the 4-8 AU range differs by less then ![]()
![]() .
SPs are modeled in different ways depending on
the physical origin of the grains they represent. We distinguish between 3 types of SP.
.
SPs are modeled in different ways depending on
the physical origin of the grains they represent. We distinguish between 3 types of SP.
All SPs that represent the initial structure of the dusty disc
(i.e., non-avalanche SPs)
have a superexponential vertical density profile
 |
(A.3) |
When a planetesimal is shattered the fragments are created with
an initial spread in velocities.
Ryan & Melosh (1998) show that the fragment velocities depend on grain sizes
and that for small
grains they are about a few percent of the impact velocity, with
![]() .
Fragments produced from a body on a Keplerian orbit
would spread in the vertical direction, and the height of the layer can be estimated as
.
Fragments produced from a body on a Keplerian orbit
would spread in the vertical direction, and the height of the layer can be estimated as
 |
(A.4) |
If the debris have velocities with isotropic distributions around the center of mass then
the vertical distribution of grains of the same ![]() can be approximated
as a constant. Thus these SPs are assumed to have no internal density structure and constant
grain density.
can be approximated
as a constant. Thus these SPs are assumed to have no internal density structure and constant
grain density.
As mentioned in Sect. 3,
when two SPs are passing through each other, a fraction of their grains
can be destroyed producing new and smaller grains, which are
then combined into new SPs.
The number of grains that are destroyed in each SP, if the relative velocity is high
enough to reach catastrophic fragmentation (see Sect. 3.4),
is calculated as
The structure of the new SPs (one SP for each size bin),
which are produced after a collision, is obtained through the following equations.
The initial height of the SP is equal to
 |
(A.7) |
| fk(z)=fi(z) fj(z), | (A.8) |
![\begin{displaymath}%
w_{{{\rm sp}},k}=\left[ \left(\frac{1}{w_{{{\rm sp}},i}}\ri...
...{\rm sp}},j}}\right)^{-p_{\rm z}} \right]^{-1/p_{\rm z}}\cdot
\end{displaymath}](/articles/aa/full/2007/02/aa5210-06/img221.gif) |
(A.9) |
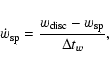 |
(A.10) |
 |
(A.11) |
To keep the total number of SPs manageable (we can trace the evolution of about one million of them) we have developed an algorithm that allows us to recombine SPs with similar parameters (grain size, velocities, positions in the disc). This allows us to avoid a too fast increase of the total number of SPs while keeping it to a value large enough from a statistical point of view.
The merging procedure is applied only between SPs standing for grains of the same size.
The proximity condition is obtained by dividing the disc plane into
a 2D space grid with the cell size equal to the SP's diameter. For each cell we list all SPs whose
centers are located within the cell. Thus a given list contains SPs from the same spatial
volume and with the same grain size. For each SP from a given list we calculate the "normalized''
velocity
![]() ,
where v is the SP velocity and R is the distance from the star to the SP center. If several SPs fall into one velocity bin (of width
,
where v is the SP velocity and R is the distance from the star to the SP center. If several SPs fall into one velocity bin (of width
![]() ),
they are combined into one SPs with the number of grains being equal
to the sum of
),
they are combined into one SPs with the number of grains being equal
to the sum of
![]() of the combined SPs. The vertical structure of the new SP is
obtained through the averaged values
of the combined SPs. The vertical structure of the new SP is
obtained through the averaged values
![]() and
and
![]() .
The velocity and the position of the new SP are
chosen to be equal to those of one SP, randomly chosenfrom the list of the recombined SPs. This SP is chosen randomly with the probability proportional to
.
The velocity and the position of the new SP are
chosen to be equal to those of one SP, randomly chosenfrom the list of the recombined SPs. This SP is chosen randomly with the probability proportional to
![]() .
Choosing positions and velocities this way
has the advantage of not introducing new trajectories for SPs,
and this makes us more certain about the general shape of an avalanche. We have also tested another procedure for SPs recombination in which all SPs from the same velocity bin are recombined into one SP with position and velocity such that the total angular momentum and
kinetic energy are preserved. In both cases we obtain similar results.
.
Choosing positions and velocities this way
has the advantage of not introducing new trajectories for SPs,
and this makes us more certain about the general shape of an avalanche. We have also tested another procedure for SPs recombination in which all SPs from the same velocity bin are recombined into one SP with position and velocity such that the total angular momentum and
kinetic energy are preserved. In both cases we obtain similar results.
The recombination described above makes a significant reduction
of the total number of avalanche SP spossible. However,
an additional optimization procedure has been implemented
to speed up the calculations. The idea is the following: the dust
production rate is approximately proportional to the number density
of avalanche grains (multiplied by the number density of the field population).
As a consequence, regions with the lowest density of avalanche grains
(of a given size) cannot make a significant contribution to avalanche dust production.
Thus these regions are not very interesting for our simulations
and there is no need to do very accurate representations of the avalanche
grains' population there. A very rough representation is enough here.
The question is to determine which number density values
should be considered as "unproductive''. Since midplane densities for the field population
vary by a factor ![]() 100 throughout the disc, regions where the density of
avalanche grains (of a given size bin) are less than 1/1000that of the most dense regions will be considered as "not important''.
In these regions all SPs from the same space cell
(the proximity condition as defined above) representing grains of
the same size bin are combined into one SP regardless of their velocities.
Test runs have proved the efficiency of this optimization procedure:
i) the general shape of an avalanche and the amplification factor evolution are
not modified by it, since the "important'' regions are not affected;
ii) the total number of SPs is significantly reduced, significantly
speeding up the calculations. However, this procedure is limited to
cases for which there is a significant density gradient.
At later stages of avalanche propagation (
100 throughout the disc, regions where the density of
avalanche grains (of a given size bin) are less than 1/1000that of the most dense regions will be considered as "not important''.
In these regions all SPs from the same space cell
(the proximity condition as defined above) representing grains of
the same size bin are combined into one SP regardless of their velocities.
Test runs have proved the efficiency of this optimization procedure:
i) the general shape of an avalanche and the amplification factor evolution are
not modified by it, since the "important'' regions are not affected;
ii) the total number of SPs is significantly reduced, significantly
speeding up the calculations. However, this procedure is limited to
cases for which there is a significant density gradient.
At later stages of avalanche propagation (![]() 12 orbital periods)
it is inefficient. Figure B.1 shows the evolution of the
total number of SPs with time.
12 orbital periods)
it is inefficient. Figure B.1 shows the evolution of the
total number of SPs with time.

![\begin{displaymath}%
\frac{{\rm d}\tau_{\rm\bot}}{{\rm d}z} =C_{\rm\tau} \frac{\...
...eft[ - \left(\frac{\vert z\vert}{w}\right)^{p_{\rm z}}\right],
\end{displaymath}](/articles/aa/full/2007/02/aa5210-06/img48.gif)
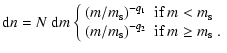
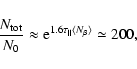
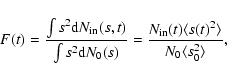
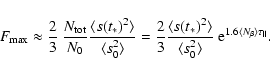
![\begin{displaymath}%
\begin{array}{ll}
F_{\rm max} & \simeq
\exp\left[240~ \tau...
...}}{\tau_{\rm\Vert,nom}}
\right)^{0.55}\right]\cdot
\end{array}\end{displaymath}](/articles/aa/full/2007/02/aa5210-06/img148.gif)
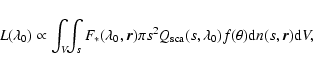
![\begin{displaymath}%
f_{\rm scat}(\theta) =f_0 \left[ \frac{0.3}{(0.2+\theta/2)^3} +1.4
\left(\frac{\theta}{3.3}\right)^4
+0.2\right].
\end{displaymath}](/articles/aa/full/2007/02/aa5210-06/img162.gif)
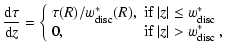
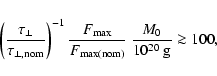
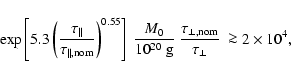
![\begin{figure}
\par\includegraphics[width=7.7cm,clip]{5210f19.ps}\end{figure}](/articles/aa/full/2007/02/aa5210-06/img227.gif)