![[*]](/icons/foot_motif.gif)
A&A 461, 261-275 (2007)
DOI: 10.1051/0004-6361:20065999
L. Mashonkina1,2 - A. J. Korn3 - N. Przybilla4
1 - Institut für Astronomie und Astrophysik der Universität
München, Scheinerstr. 1, 81679 München, Germany
2 -
Institute of Astronomy, Russian Academy of Science, Pyatnitskaya 48,
119017 Moscow, Russia
3 -
Department of Astronomy and Space Physics, Uppsala University,
Box 515, 75120 Uppsala, Sweden
4 -
Dr. Remeis-Sternwarte Bamberg, Sternwartstrasse 7,
96049 Bamberg, Germany
Received 10 July 2006 / Accepted 4 September 2006
Abstract
Aims. Non-local thermodynamical equilibrium (NLTE) line formation for neutral and singly-ionized calcium is considered through a range of spectral types when the Ca abundance varies from the solar value down to [Ca/H] = -5. We evaluate the influence of departures from LTE on Ca abundance determinations and inspect the possibility of using Ca I / Ca II line-strength ratios as indicators of surface gravity for extremely metal-poor stars.
Methods. A comprehensive model atom for Ca I and Ca II is presented. Accurate radiative and electron collisional atomic data are incorporated. The role of inelastic collisions with hydrogen atoms in the statistical equilibrium of Ca I/II is estimated empirically from inspection of their different influences on the Ca I and Ca II lines in selected stars with well determined stellar parameters and high-quality observed spectra.
Results. The dependence of NLTE effects on the atmospheric parameters is discussed. Departures from LTE significantly affect the profiles of Ca I lines over the whole range of stellar parameters being considered. However, at [Ca/H]  -2, NLTE abundance correction of individual lines have a low absolute value due to the different influence of NLTE effects on line wings and the line core. At lower Ca abundances, NLTE leads to systematically depleted total absorption in the line and positive abundance corrections, exceeding +0.5 dex for Ca I
 at [Ca/H] = -4.9. In contrast, the NLTE effects strengthen the Ca II lines and lead to negative abundance corrections. NLTE corrections are small,
  0.02 dex, for the Ca II resonance lines, and they grow in absolute value with decreasing Ca abundance for the IR lines of multiplet 3d-4p, exceeding 0.4 dex in the metal-poor models with [Fe/H]
-3. As a test and first application of the Ca I/II model atom, Ca abundances are determined on the basis of plane-parallel LTE model atmospheres for the Sun, Procyon (F IV-V), and seven metal-poor stars, using high S/N and high-resolution spectra at visual and near-IR wavelengths. Lines of Ca I and Ca II give consistent abundances for all objects (except Procyon) when collisions with hydrogen atoms are taken into account. The derived absolute solar Ca abundance (from Ca I and Ca II lines) is
0.02 dex, for the Ca II resonance lines, and they grow in absolute value with decreasing Ca abundance for the IR lines of multiplet 3d-4p, exceeding 0.4 dex in the metal-poor models with [Fe/H]
-3. As a test and first application of the Ca I/II model atom, Ca abundances are determined on the basis of plane-parallel LTE model atmospheres for the Sun, Procyon (F IV-V), and seven metal-poor stars, using high S/N and high-resolution spectra at visual and near-IR wavelengths. Lines of Ca I and Ca II give consistent abundances for all objects (except Procyon) when collisions with hydrogen atoms are taken into account. The derived absolute solar Ca abundance (from Ca I and Ca II lines) is
 = 6.38
  0.06. For Procyon, the mean Ca abundance from Ca I lines is markedly subsolar, [Ca/H] = -0.14
0.03. All metal-poor stars within our sample show an overabundance of calcium relative to iron with [Ca/Fe] abundance ratios of 0.26 to 0.46 that are typical of the halo population. The W(Ca I4226) / W(Ca II8498) equivalent width ratio is predicted to be sensitive to surface gravity for extremely metal-poor stars, while this is not the case for the ratio involving the Ca II resonance line(s).
0.06. For Procyon, the mean Ca abundance from Ca I lines is markedly subsolar, [Ca/H] = -0.14
0.03. All metal-poor stars within our sample show an overabundance of calcium relative to iron with [Ca/Fe] abundance ratios of 0.26 to 0.46 that are typical of the halo population. The W(Ca I4226) / W(Ca II8498) equivalent width ratio is predicted to be sensitive to surface gravity for extremely metal-poor stars, while this is not the case for the ratio involving the Ca II resonance line(s).
Key words: line: formation - Sun: atmosphere - stars: abundances - stars: late-type - line: profiles
Calcium is one of the best observable chemical elements in
late-type stars. The subordinate
lines of neutral Ca located in the relatively uncrowded
yellow-to-red spectral regions are suitable for spectroscopic
analysis over a wide range of Ca abundance from
super-solar values down to [Ca/H] = -4 (Cayrel et al. 2004).
The resonance lines of Ca I at
 and Ca II at
 and
3968 Å lie in the visual spectral range and can be measured
even in extremely metal-poor stars with metallicity [Fe/H] < -5(Christlieb et al. 2002; Frebel et al. 2005).
In such stars, Ca is the only chemical element that is visible in
two ionization stages, and the Ca I and Ca II lines
can be potent tools in deriving accurate values for
fundamental stellar parameters and for the Ca abundance itself. Calcium is
an important chemical element for studing the history of
and
3968 Å lie in the visual spectral range and can be measured
even in extremely metal-poor stars with metallicity [Fe/H] < -5(Christlieb et al. 2002; Frebel et al. 2005).
In such stars, Ca is the only chemical element that is visible in
two ionization stages, and the Ca I and Ca II lines
can be potent tools in deriving accurate values for
fundamental stellar parameters and for the Ca abundance itself. Calcium is
an important chemical element for studing the history of
 -process nucleosynthesis in the Galaxy.
The subordinate lines of ionized Ca at
 ,
8542,
and 8662 Å are among the strongest features in the
near-infrared spectra of late-type stars with metallicity down to
[Fe/H] = -3 (Mallik 1997).
The Ca II triplet lies at the focus of cool star research
with the advent of large spectroscopic surveys of the Galaxy like the
Radial Velocity Experiment (RAVE, Steinmetz et al. 2006)
and the upcoming ESA Gaia satellite mission (Perryman et al. 2001). These broad lines are also powerful abundance and metallicity indicators out to large distances
via medium-resolution spectroscopy, favorably located near the flux maximum
of red giants. Applications range from quantitative analyses of individual
stars in globular clusters (e.g. Armandroff & da Costa 1991;
Rutledge et al. 1997) to stars and stellar populations
in nearby galaxies (e.g. Tolstoy et al. 2001; Ibata et al. 2005). Moreover, the Ca II triplet is useful for analyzing of unresolved stellar
systems like early-type galaxies (e.g. Saglia et al. 2002).
However, as an increasing number of high-quality (echelle) spectra of stars
and unresolved stellar systems becomes available, an equally high level in
the theoretical modelling is required.
,
8542,
and 8662 Å are among the strongest features in the
near-infrared spectra of late-type stars with metallicity down to
[Fe/H] = -3 (Mallik 1997).
The Ca II triplet lies at the focus of cool star research
with the advent of large spectroscopic surveys of the Galaxy like the
Radial Velocity Experiment (RAVE, Steinmetz et al. 2006)
and the upcoming ESA Gaia satellite mission (Perryman et al. 2001). These broad lines are also powerful abundance and metallicity indicators out to large distances
via medium-resolution spectroscopy, favorably located near the flux maximum
of red giants. Applications range from quantitative analyses of individual
stars in globular clusters (e.g. Armandroff & da Costa 1991;
Rutledge et al. 1997) to stars and stellar populations
in nearby galaxies (e.g. Tolstoy et al. 2001; Ibata et al. 2005). Moreover, the Ca II triplet is useful for analyzing of unresolved stellar
systems like early-type galaxies (e.g. Saglia et al. 2002).
However, as an increasing number of high-quality (echelle) spectra of stars
and unresolved stellar systems becomes available, an equally high level in
the theoretical modelling is required.
Previous investigations of the statistical equilibrium (SE) of
neutral Ca in the Sun and Procyon (Watanabe & Steenbock
1985) and in the models with effective
temperatures
 = 4500 K-6200 K, surface gravities
  = 4.5-1.0 and metal abundance, [Fe/H] = 0 and -1 (Drake
1991) found rather small departures from LTE.
Drake (1991) concluded that
"overionization effects (for Ca I) are not expected to
increase in severity in metal-poor stars''.
Non-local thermodynamical equilibrium (NLTE) analysis of neutral Ca in the sample of 252 dwarf and
subgiant stars was performed by Idiart & Thevenin
(2000). Previous NLTE investigations for Ca II
were only concerned with the resonance lines in the Sun (we cite
only the first paper, Shine & Linsky 1974) and the IR
lines of multiplet
= 4.5-1.0 and metal abundance, [Fe/H] = 0 and -1 (Drake
1991) found rather small departures from LTE.
Drake (1991) concluded that
"overionization effects (for Ca I) are not expected to
increase in severity in metal-poor stars''.
Non-local thermodynamical equilibrium (NLTE) analysis of neutral Ca in the sample of 252 dwarf and
subgiant stars was performed by Idiart & Thevenin
(2000). Previous NLTE investigations for Ca II
were only concerned with the resonance lines in the Sun (we cite
only the first paper, Shine & Linsky 1974) and the IR
lines of multiplet
 (
,
8542 and 8662 Å)
in moderately metal-poor stars by Jørgensen et al. (1992)
for [Fe/H]
-1 and by Andretta et al. (2005) for [Fe/H] -2.
(
,
8542 and 8662 Å)
in moderately metal-poor stars by Jørgensen et al. (1992)
for [Fe/H]
-1 and by Andretta et al. (2005) for [Fe/H] -2.
The need for a new analysis is motivated by two points. First, a fairly extensive set of
accurate atomic data on photoionization cross-sections and
oscillator strengths was recently calculated in the Opacity
Project (OP; see Seaton et al. 1994 for a general review).
We include 66 terms of Ca I in the model atom, in contrast to
16 terms in the works of Watanabe & Steenbock (1985) and
Drake (1991), and 36 terms of Ca II in
contrast to 3 terms considered by Jørgensen et al. (1992) and Andretta et al. (2005). This allows us to
investigate the detailed line formation of the high excitation lines of
Ca I and Ca II. All our results are based on line-profile
analysis, and they take advantage of the advanced theory of
collisional broadening by atomic hydrogen treated recently by
Anstee & O'Mara (1995), Barklem & O'Mara
(1997, 1998), and Barklem et al.
(1998). Hereafter, these four important papers are
referred to collectively as  .
The second point is connected
with an extension of the metallicity range observed in stars down
to [Fe/H] = -5.45 (Aoki et al. 2006). It is highly
desirable to have an understanding of the likely influence of any
departures from LTE over this whole range. In stars
differing significantly in their metal abundance, different
subsets of Ca lines are used to calculate the
Ca II/Ca I ionization equilibrium and Ca abundance.
We investigate here the NLTE line formation of our extended list of
Ca I and Ca II lines in the metallicity range
between [Fe/H] = 0 and -4.34. An exception is the resonance lines
of Ca I and Ca II and the Ca II lines of
multiplet
in solar metallicity stars: their cores
and inner wings are most probably influenced by the chromospheric
temperature rise and a non-thermal and depth-dependent chromospheric
velocity field neither of which are part of the homogeneous photospheric models used in this study.
.
The second point is connected
with an extension of the metallicity range observed in stars down
to [Fe/H] = -5.45 (Aoki et al. 2006). It is highly
desirable to have an understanding of the likely influence of any
departures from LTE over this whole range. In stars
differing significantly in their metal abundance, different
subsets of Ca lines are used to calculate the
Ca II/Ca I ionization equilibrium and Ca abundance.
We investigate here the NLTE line formation of our extended list of
Ca I and Ca II lines in the metallicity range
between [Fe/H] = 0 and -4.34. An exception is the resonance lines
of Ca I and Ca II and the Ca II lines of
multiplet
in solar metallicity stars: their cores
and inner wings are most probably influenced by the chromospheric
temperature rise and a non-thermal and depth-dependent chromospheric
velocity field neither of which are part of the homogeneous photospheric models used in this study.
For the statistical equilibrium of atoms in cool stars, an important
issue debated for decades, from Gehren (1975) to Belyaev &
Barklem (2003), is the role of inelastic collisions with
hydrogen atoms. One of our aims is to empirically constrain the
efficiency of this type of collision in the SE
of Ca I/II from inspection of their different influences on
the Ca I and Ca II lines in the Sun, Procyon, and
seven metal-poor (-1.35
[Fe/H]
-2.43) stars with
well-determined stellar parameters and high-quality observed spectra.
The paper is organized as follows. The model atom of Ca I/II and atomic data are described in Sect. 2. Departures from LTE for Ca I and Ca II, NLTE trends with metallicity, effective temperature and surface gravity, and errors in the NLTE results caused by the uncertainties of atomic data are discussed in Sect. 3. In Sect. 4, the solar Ca spectrum is studied to provide the basis for further differential analysis of stellar spectra. We determine the absolute solar Ca abundance using four different sets of oscillator strengths based on laboratory measurements, OP calculations, and collected from the NIST (http://physics.nist.gov/PhysRefData) and VALD (Kupka et al. 1999) databases and, thus, estimate the accuracy of the available atomic data. Observations and stellar parameters of our sample of stars are described in Sect. 5. For the selected stars, Sect. 6 investigates whether or not Ca abundances derived from the Ca I and Ca II lines agree. NLTE formation of the Ca I resonance line in the atmospheres of metal-poor stars is tested in Sect. 7. The predictions are made in Sect. 8 for the Ca I/Ca II line-strength ratios as indicators of surface gravity for extremely metal-poor stars. Our recommendations and conclusions are given in Sect. 9.
In this section, we treat the model atom of Ca I/II and briefly describe the programs used for computing the Ca I/II level populations and spectral line profiles.
Energy levels. Calcium is almost completely ionized
throughout the atmosphere of stars with an effective temperature
between 5000 K and 6500 K, and a fraction of Ca I does not exceed
several parts in a thousand. Minority species are particularly sensitive to NLTE effects because any small change in the ionization rates changes their populations a lot. In order to provide close
collisional coupling of Ca I to the continuum electron
reservoir and consequently establish a realistic ionization balance between the
atomic and singly-ionized species, the atomic model for calcium has
to be fairly complete. Energy levels up to 0.17/0.67 eV below the
ionization threshold are explicitly included in our Ca I/II model atom. Only the ground state of Ca III is considered.
The Ca I levels belong to singlet and triplet terms of the
 (
( and
and  ),
),
 (nl = 4p and 3d), and
  electronic configurations. Triplet fine
structure is neglected except for the
electronic configurations. Triplet fine
structure is neglected except for the
 and
and
 splitting. Singlet and triplet ng,
  ,
,
 ,
and
,
and  levels are combined into a single level due to their small
energy differences. The final model atom includes 63 levels of Ca I. The Ca II levels belong to doublet terms of
the nl (n = 4-9 and
levels are combined into a single level due to their small
energy differences. The final model atom includes 63 levels of Ca I. The Ca II levels belong to doublet terms of
the nl (n = 4-9 and  ),
),  ,
and
,
and  electronic
configurations. Fine structure splitting sub-levels are included
explicitly for the terms
electronic
configurations. Fine structure splitting sub-levels are included
explicitly for the terms
 ,
,
 ,
and
,
and
 .
The ng and nh (n = 7, 8, and 9) levels are
combined into a single level. The final model atom contains 37 levels of Ca II.
.
The ng and nh (n = 7, 8, and 9) levels are
combined into a single level. The final model atom contains 37 levels of Ca II.
The energy levels were taken from the NIST atomic spectra database
(Sugar & Corliss 1985) for all the Ca I electronic configurations with  and Ca II electronic configurations with
  .
For the remainder,
Opacity-Project data from the TOPBASE database (Cunto & Mendoza
1992) are used. The corresponding term diagram is shown
in Fig. 1.
.
For the remainder,
Opacity-Project data from the TOPBASE database (Cunto & Mendoza
1992) are used. The corresponding term diagram is shown
in Fig. 1.
![\begin{figure}
\par\includegraphics[width=7.1cm,clip]{5999fi1a.ps}\vspace*{3mm}
\includegraphics[width=7cm,clip]{5999fi1b.ps}\end{figure}](/articles/aa/full/2007/01/aa5999-06/img56.gif) |
Figure 1: The Ca I/II model atom. The Ca I and Ca II spectral lines used in Ca abundance analysis arise in the transitions shown as continuous lines. |
| Open with DEXTER | |
Radiative transitions. Our NLTE calculations rely heavily on
the OP radiative data. They cover the whole range of allowed
transitions in our model atom. Currently available OP calculations
do not include the effects of spin-orbit interaction, and only
average-multiplet oscillator strengths are reported. Where
required, we decompose the LS multiplet averages into their
LSJ fine structure components in correspondence with their
relative line strengths. Additional radiative coupling between the
different spin systems of Ca I is provided by the
transition  -
-
 (Drozdowski et al.
1997) and by all intercombination transitions listed by
Smith & Raggett (1981). The radiative transfer
equation is solved, in total, for 421 line transitions in Ca I and 213 transitions in Ca II.
(Drozdowski et al.
1997) and by all intercombination transitions listed by
Smith & Raggett (1981). The radiative transfer
equation is solved, in total, for 421 line transitions in Ca I and 213 transitions in Ca II.
We compared OP fij for Ca I with the experimental
values from Shabanova (1963), Smith & Gallagher
(1966), Smith & O'Neil (1975), Smith & Raggett
(1981), and Smith (1988) for a total of 24 multiplets with  ranging between 0.73 and -2.25. The difference
 shows no
correlation with the multiplet strength, and the mean value equals
-0.07
0.28. For Ca II, measured oscillator strengths
are available only for the multiplets
shows no
correlation with the multiplet strength, and the mean value equals
-0.07
0.28. For Ca II, measured oscillator strengths
are available only for the multiplets
 and
(Theodosiou 1989). They agree within 12% with the
corresponding OP values. The OP data for the remaining Ca I and
Ca II transitions were compared with the calculations of Kurucz
(1992). For the 151 strongest ((OP) > -2.5)
Ca I multiplets, the mean difference
and
(Theodosiou 1989). They agree within 12% with the
corresponding OP values. The OP data for the remaining Ca I and
Ca II transitions were compared with the calculations of Kurucz
(1992). For the 151 strongest ((OP) > -2.5)
Ca I multiplets, the mean difference
 (Kurucz - OP) = -0.03
0.93. The Kurucz calculations predict, on
average, lower transition probabilities compared to the OP data for
the 58 strongest ((OP) > -2.5) Ca II multiplets,
and the mean difference
(Kurucz - OP) =
-0.17
0.86. With respect to systematical errors, the OP data for
Ca I and Ca II transitions are expected to be
accurate within 15%. Additional arguments for the validity of
this statement come from the analysis of solar Ca spectrum (see
Sect. 4).
(Kurucz - OP) = -0.03
0.93. The Kurucz calculations predict, on
average, lower transition probabilities compared to the OP data for
the 58 strongest ((OP) > -2.5) Ca II multiplets,
and the mean difference
(Kurucz - OP) =
-0.17
0.86. With respect to systematical errors, the OP data for
Ca I and Ca II transitions are expected to be
accurate within 15%. Additional arguments for the validity of
this statement come from the analysis of solar Ca spectrum (see
Sect. 4).
Photoionization from all energy levels is treated by utilizing OP cross-sections as available through the TOPBASE database. Cross-sections for the combined ngh levels in Ca II are assumed to be equal to that for the corresponding ng levels.
Collisional transitions. In our calculations we take into
account inelastic collisions with electrons and hydrogen atoms
leading to both excitation and ionization.
Drawin's (1968) formula as described by Steenbock &
Holweger (1984) is widely used to calculate hydrogenic
collisions, and it suggests that their influence is comparable
to electron impact. Recently it was shown both experimentally
(Belyaev et al. 1999, for Na I) and theoretically
(Belyaev & Barklem 2003, for Li I) that Drawin's
formula overestimates the collision rate of the resonance
transitions by several orders of magnitude. However, for SE calculations, estimates are required for transitions between all states that might affect the population of the states of
interest. In this study, we constrain the efficiency of
hydrogenic collisions empirically. It is represented by a scaling factor
 applied to Steenbock & Holweger's formula. The
cross-sections calculated using this formula were multiplied by
= 0 (no hydrogenic collisions), 0.01, 0.1, and 1 in order to
make the Ca abundances derived from the Ca I and Ca II lines in the Sun and selected stars consistent.
applied to Steenbock & Holweger's formula. The
cross-sections calculated using this formula were multiplied by
= 0 (no hydrogenic collisions), 0.01, 0.1, and 1 in order to
make the Ca abundances derived from the Ca I and Ca II lines in the Sun and selected stars consistent.
For electron impact excitation, detailed results are available
from the R-matrix calculations of Samson & Berrington
(2001) for the transitions from the ground state to all the
excited levels up to
 in Ca I and from
the calculations of Burgess et al. (1995) in a non-exchange
distorted-wave approximation for the transitions between the
lowest seven terms (up to
in Ca I and from
the calculations of Burgess et al. (1995) in a non-exchange
distorted-wave approximation for the transitions between the
lowest seven terms (up to
 )
in Ca II.
Uncertainties in data obtained by the R-matrix method are
typically on the order of a few 10%, and Samson & Berrington
note the excellent agreement of their results with experimentally
derived rates for 4
)
in Ca II.
Uncertainties in data obtained by the R-matrix method are
typically on the order of a few 10%, and Samson & Berrington
note the excellent agreement of their results with experimentally
derived rates for 4 -
-
 .
For the
remaining bulk of the transitions, approximate formulae must be
used. Basically, we apply the impact parameter method (IPM) of
Seaton (1962a) to the allowed transitions and the Allen's
formula (1973) with a collision strength of 1.0 to the
optically forbidden transitions. Electronic collision rates based
on Samson & Berrington and Burgess et al. data where they are
available, IPM data, and the Allen's formula for the remaining
transitions are referred to below as the standard collisional
recipe. For test purposes (see Sect. 3.3), we treat the
allowed transitions absent in the Samson & Berrington and Burgess
et al. papers using the van Regemorter's formula (1962).
.
For the
remaining bulk of the transitions, approximate formulae must be
used. Basically, we apply the impact parameter method (IPM) of
Seaton (1962a) to the allowed transitions and the Allen's
formula (1973) with a collision strength of 1.0 to the
optically forbidden transitions. Electronic collision rates based
on Samson & Berrington and Burgess et al. data where they are
available, IPM data, and the Allen's formula for the remaining
transitions are referred to below as the standard collisional
recipe. For test purposes (see Sect. 3.3), we treat the
allowed transitions absent in the Samson & Berrington and Burgess
et al. papers using the van Regemorter's formula (1962).
Electron impact ionization cross-sections are calculated by applying the formula of Seaton (1962b) with threshold photoionization cross-sections from the OP data.
Calcium is assumed to be a trace element because its contribution to the continuous opacity and the reservoir of free electrons is smaller by, at least, one order of magnitude than the contribution from the more abundant elements Mg, Si, and Fe. Thus, we obtain statistical equilibrium populations for Ca I/II while keeping the atmospheric structure fixed. All calculations are performed with plane-parallel, homogeneous, LTE, and blanketed model atmospheres computed with the MAFAGS code (Fuhrmann et al. 1997).
We use a revised version of the DETAIL program (Butler & Giddings
1985) based on the accelerated lambda iteration
following the efficient method described by Rybicki &
Hummer (1991, 1992) in order to solve the coupled
radiative transfer and statistical equilibrium equations. All
bound-bound (b-b) and bound-free (b-f) transitions of
Ca I and Ca II are explicitly taken into account in
the SE calculations. The 15 strongest b-b transitions in Ca I
and all LSJ transitions
and
in Ca II
are treated using the Voigt profile. Microturbulence is accounted for
by inclusion of an additional term in the Doppler width. The van der Waals damping parameters based on the Anstee & O'Mara's (1995) theory are taken from the VALD database (Kupka
et al. 1999). The remaining b-b transitions are treated
using depth-dependent Doppler profiles.
In addition to the continuous background opacity, the line opacity introduced by both H I and metal lines is taken into account by explicitly including it in solving the radiation transfer. The metal line list has been extracted from Kurucz' (1992) compilation and contains about 650 000 atomic and molecular lines between 1300 Å and 300 000 Å. The Ca lines are excluded from the background.
The departure coefficients obtained from DETAIL are then used to compute the
synthetic line profiles via the SIU program
(www.usm.uni-muenchen.de/people/reetz/siu.html). In this step of
the calculations, Voigt profile functions are adopted and the same
microturbulence value
 as in DETAIL is applied. Oscillator
strengths and van der Waals damping constants of the Ca I
and Ca II lines and their accuracy are discussed in
Sect. 4.
as in DETAIL is applied. Oscillator
strengths and van der Waals damping constants of the Ca I
and Ca II lines and their accuracy are discussed in
Sect. 4.
In the solar system's matter, Ca is represented by several isotopes
with the isotope abundance ratio
 :
:
 :
:
 :
:
 :
:
 :
:
 = 96.9:0.647:0.135:2.09:0.004:0.187 (Anders & Grevesse
1989). In this study, we account for the isotope structure of the
Ca II
line with the isotope shifts measured by
Nörtershäuser et al. (1998). The wavelengths and the
product of gf and solar fractional isotope abundance
= 96.9:0.647:0.135:2.09:0.004:0.187 (Anders & Grevesse
1989). In this study, we account for the isotope structure of the
Ca II
line with the isotope shifts measured by
Nörtershäuser et al. (1998). The wavelengths and the
product of gf and solar fractional isotope abundance  are given in Table 1 for each isotope component. The
oscillator strength is taken from the measurements of Theodosiou
(1989),
are given in Table 1 for each isotope component. The
oscillator strength is taken from the measurements of Theodosiou
(1989),
 .
Isotope
shifts are much smaller (<10 mÅ) for the resonance lines in
Ca I and Ca II (Lucas et al. 2004) and
we treat them as single lines. No data is available for the
remaining Ca lines. We neglect the hyperfine structure of Ca lines
due to the very low fractional abundance of the only odd isotope
(0.135%).
.
Isotope
shifts are much smaller (<10 mÅ) for the resonance lines in
Ca I and Ca II (Lucas et al. 2004) and
we treat them as single lines. No data is available for the
remaining Ca lines. We neglect the hyperfine structure of Ca lines
due to the very low fractional abundance of the only odd isotope
(0.135%).
Table 1:
Atomic data for the isotopic components of Ca II
.
The fractional isotope abundances
correspond to solar-system matter.
In this section, we investigate the NLTE effects for Ca I/II in
the following range of stellar parameters:
between 5000 K and 6000 K,
 3.0 and 4.0, and [Fe/H] between 0 and -3.
Everywhere
= 1 km s-1. For the
models with [Fe/H] = 0, the Ca abundance was assumed to follow
the global metallicity. Ca enhancement with [Ca/Fe] = 0.4 was
assumed for the metal-poor models. Statistical
equilibrium was computed using the standard recipe for electronic
collisions and no hydrogenic collisions were taken into account
( = 0).
3.0 and 4.0, and [Fe/H] between 0 and -3.
Everywhere
= 1 km s-1. For the
models with [Fe/H] = 0, the Ca abundance was assumed to follow
the global metallicity. Ca enhancement with [Ca/Fe] = 0.4 was
assumed for the metal-poor models. Statistical
equilibrium was computed using the standard recipe for electronic
collisions and no hydrogenic collisions were taken into account
( = 0).
Our calculations indicate a general behavior of departure
coefficients,
 ,
independent of
effective temperature, surface gravity, and metallicity. Here,
,
independent of
effective temperature, surface gravity, and metallicity. Here,
 and
and
 are the statistical
equilibrium and thermal (Saha-Boltzmann) number densities,
respectively. The departure coefficients of the
important levels of Ca I are plotted in Fig. 2
for selected models of our grid.
As can be seen, all levels of Ca I are underpopulated
in the atmospheric layers above
are the statistical
equilibrium and thermal (Saha-Boltzmann) number densities,
respectively. The departure coefficients of the
important levels of Ca I are plotted in Fig. 2
for selected models of our grid.
As can be seen, all levels of Ca I are underpopulated
in the atmospheric layers above
 .
Overionization is caused by superthermal radiation of a non-local origin below the thresholds of the low excitation levels of Ca I. In atmospheres with solar or mildly deficient Ca abundance, [Ca/H]
-1, the most important levels are
.
Overionization is caused by superthermal radiation of a non-local origin below the thresholds of the low excitation levels of Ca I. In atmospheres with solar or mildly deficient Ca abundance, [Ca/H]
-1, the most important levels are
 ,
,
and
with the thresholds at 3898 Å, 3450 Å,
and 2930 Å, correspondingly. At the lower metallicity and Ca
abundance, depopulation processes in Ca I are dominated by
enhanced ionization of the ground state due to a reduction of the
continuous absorption coefficient below the threshold of this
level at 2028 Å.
,
,
and
with the thresholds at 3898 Å, 3450 Å,
and 2930 Å, correspondingly. At the lower metallicity and Ca
abundance, depopulation processes in Ca I are dominated by
enhanced ionization of the ground state due to a reduction of the
continuous absorption coefficient below the threshold of this
level at 2028 Å.
![\begin{figure}
\par\includegraphics[width=3.7cm,clip]{5999fi2a.ps}\hspace*{4mm}
...
...i2g.ps}\hspace*{4mm}
\includegraphics[width=3.5cm,clip]{5999fi2h.ps}\end{figure}](/articles/aa/full/2007/01/aa5999-06/img87.gif) |
Figure 2:
Departure coefficients  as a
function of
as a
function of
 for selected levels of Ca I,
plotted for selected models of the grid. For each term of
and
,
departure
coefficients of the fine structure splitting sublevels are obtained to be
close together and only the lowest sublevels,
for selected levels of Ca I,
plotted for selected models of the grid. For each term of
and
,
departure
coefficients of the fine structure splitting sublevels are obtained to be
close together and only the lowest sublevels,
 and
and
 ,
are shown. The stellar parameters are
quoted in each panel. ,
are shown. The stellar parameters are
quoted in each panel. |
| Open with DEXTER | |
The statistical equilibrium of Ca I in the metallicity
range between 0 and -1 is discussed in detail by Drake
(1991). Referring to the main continuous opacity sources
in the near ultraviolet wavelength regime, caused by the H- ions
and excited neutral H atoms, Drake shows that overionization
effects decrease with increasing model temperature, decreasing
surface gravity, and decreasing Ca abundance. Our calculations for
the stellar parameters overlapping with that of Drake support
his conclusions qualitatively. However, quantitatively,
overionization effects are found to be smaller in our work. The
explanation lies with our extended model atom that contains
energy levels up to 0.17 eV below the ionization threshold, in
contrast to 1.06 eV in Drake's paper. Overionization effects on
Ca I are partially cancelled due to collisional coupling of
the Ca I high excitation levels to the ground state of the
majority species, Ca II, that keeps thermodynamic
equilibrium population. Our model atom provides this closer
coupling and in this respect is more realistic than the one by Drake.
The smaller departures from LTE
for level populations result in weaker NLTE effects for
spectral lines and smaller differences between derived NLTE and LTE
Ca abundance,
 .
We refer
to
.
We refer
to
 as the NLTE abundance correction. For
example, for atmospheric parameters
as the NLTE abundance correction. For
example, for atmospheric parameters
 5800 K, 4.5, [Fe/H] = 0, Drake gives nearly equal values
 0.11 dex for
 (multiplet 22),
 (multiplet 19), and
 (multiplet 20). The corresponding values from our calculations are 0.04 dex, 0.05 dex, and 0.07 dex.
In contrast to the models with [Fe/H]
-1, overionization
effects increase with increasing model temperature and decreasing
global metallicity, when ones goes to the lower metallicity and Ca abundance, [Fe/H] and [Ca/H] < -1. The explanation lies with the
behavior of the continuous absorption coefficient below 2028 Å that is, in metal-poor atmospheres, mainly due to quasi-molecular
hydrogen absorption (Doyle 1968), the H- ion, and the
H+2 ion. The contribution of the H- ion increases with
increasing effective temperature and decreases with decreasing
metallicity, while the contribution of quasi-molecular hydrogen
absorption changes in the opposite direction. Their competition
results in the effects seen in Fig. 2.
![\begin{figure}
\par\includegraphics[width=7.25cm,clip]{5999fi3a.ps}\vspace*{3mm}...
...i3b.ps}\vspace*{3mm}
\includegraphics[width=7.3cm,clip]{5999fi3c.ps}\end{figure}](/articles/aa/full/2007/01/aa5999-06/img98.gif) |
Figure 3:
NLTE (continuous line) and LTE (dotted line)
theoretical profiles of the selected Ca I lines for the
models with the same
5500 K and
 but with
different metallicities. For the
but with
different metallicities. For the
 and
and
 lines, [Fe/H] = 0, -2, and -3 from bottom to
top; for lines, [Fe/H] = 0, -2, and -3 from bottom to
top; for
 ,
[Fe/H] = 0, -1, and -2. ,
[Fe/H] = 0, -1, and -2. |
| Open with DEXTER | |
The NLTE effects on spectral lines are illustrated in
Fig. 3 and Table 2.
Figure 3 shows the NLTE and LTE profiles of three representative lines of neutral calcium computed for the models with a different global metal abundance. These are (i) the low
excitation line
,
which is the strongest among all
subordinate lines; (ii)
with the largest oscillator
strength,
fij = 0.390, but relatively small van der Waals
damping constant
 ,
which is lower by 1.28 dex
than that of
;
and (iii) the intermediate strength line
,
which is lower by 1.28 dex
than that of
;
and (iii) the intermediate strength line
 .
Table 2 presents NLTE abundance
corrections,
,
for 16 Ca I lines. Three
other Ca I lines,
.
Table 2 presents NLTE abundance
corrections,
,
for 16 Ca I lines. Three
other Ca I lines,
 ,
,
 ,
and
,
and
 ,
have
close to those of
,
,
and
,
respectively. The NLTE and LTE line profiles and equivalent widths
were calculated with the laboratory oscillator strengths and C6 values given in Table 4. The microturbulence value,
,
have
close to those of
,
,
and
,
respectively. The NLTE and LTE line profiles and equivalent widths
were calculated with the laboratory oscillator strengths and C6 values given in Table 4. The microturbulence value,
 1 km s-1, was adopted for all the models. Departures from
LTE for spectral lines can be understood by considering the depths
of formation of various parts of the lines and by inspecting the
level departure coefficients and line source functions.
In the metallicity regime, [Fe/H]
-1, our results support the
conclusions of Drake (1991): for each
investigated line, NLTE effects lead to enhanced absorption in the
line core and depleted absorption in the line wings (Fig. 3).
This can be understood because the line wings are formed in deep layers where overionization
depopulates all Ca I levels, but the line cores are
formed at small depths, above
1 km s-1, was adopted for all the models. Departures from
LTE for spectral lines can be understood by considering the depths
of formation of various parts of the lines and by inspecting the
level departure coefficients and line source functions.
In the metallicity regime, [Fe/H]
-1, our results support the
conclusions of Drake (1991): for each
investigated line, NLTE effects lead to enhanced absorption in the
line core and depleted absorption in the line wings (Fig. 3).
This can be understood because the line wings are formed in deep layers where overionization
depopulates all Ca I levels, but the line cores are
formed at small depths, above
 ,
where the upper
levels of the transitions are underpopulated to a greater extent than are the lower levels due
to photon losses in the line wings. The most prominent example is
a steep decrease in
,
where the upper
levels of the transitions are underpopulated to a greater extent than are the lower levels due
to photon losses in the line wings. The most prominent example is
a steep decrease in
 above
in all metal-poor models
(Fig. 2). The line source function drops below the
Planck function at these depths resulting in the enhanced
absorption in the line cores. The combined effect on the line strength is
that the NLTE abundance correction is small in most cases. Its
sign and value depend on the contributions of the line core and
wings to the overall line strength. The NLTE corrections tend toward negative
values with increasing
and decreasing .
They are
more negative for the lines of multiplet 18,
,
above
in all metal-poor models
(Fig. 2). The line source function drops below the
Planck function at these depths resulting in the enhanced
absorption in the line cores. The combined effect on the line strength is
that the NLTE abundance correction is small in most cases. Its
sign and value depend on the contributions of the line core and
wings to the overall line strength. The NLTE corrections tend toward negative
values with increasing
and decreasing .
They are
more negative for the lines of multiplet 18,
,
 ,
,
 ,
and
,
and
 (Table 2). All these trends reflect the behavior of the van der Waals broadened line
wings.
(Table 2). All these trends reflect the behavior of the van der Waals broadened line
wings.
In contrast to the solar metallicity models, the energy levels
become weakly coupled far inside the metal-poor atmospheres with [Fe/H] < -1 due to
deficient collisions (Fig. 2). For each model, at the
depths where the weak lines are formed, the upper levels are all
depleted to a lesser extent relative to their LTE populations than
are the lower levels. The lines are weaker relative to their LTE strengths not only due to the general overionization but also due
to
 resulting in the line source function
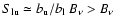 and the depleted line absorption.
Here,
and the depleted line absorption.
Here,  and
and  are the departure coefficients for the upper
and lower levels of the transition. For example, this is valid for
in the model with
= 5500 K, =
4.0, [Fe/H] = -2 and
and
in the
model 5500 K / 4.0 / -3. The corresponding NLTE and LTE profiles
are shown in Fig. 3. If the line is strong for a given
set of stellar parameters (e.g.,
and
for the models with [Fe/H] =
-2), the NLTE effects on line profiles are similar to the effects for the
models with [Fe/H] -1.
are the departure coefficients for the upper
and lower levels of the transition. For example, this is valid for
in the model with
= 5500 K, =
4.0, [Fe/H] = -2 and
and
in the
model 5500 K / 4.0 / -3. The corresponding NLTE and LTE profiles
are shown in Fig. 3. If the line is strong for a given
set of stellar parameters (e.g.,
and
for the models with [Fe/H] =
-2), the NLTE effects on line profiles are similar to the effects for the
models with [Fe/H] -1.
Table 2:
NLTE abundance corrections* (dex) for the Ca I and
Ca II lines depending on effective temperature, surface
gravity, and metallicity as computed by ignoring hydrogenic collisions ( = 0) in SE calculations.
![\begin{figure}
\par\includegraphics[width=3.7cm,clip]{5999fi4a.ps}\hspace*{4mm}
...
...i4g.ps}\hspace*{4mm}
\includegraphics[width=3.5cm,clip]{5999fi4h.ps}\end{figure}](/articles/aa/full/2007/01/aa5999-06/img114.gif) |
Figure 4: The same as in Fig. 2 for Ca II. |
| Open with DEXTER | |
Figure 4 shows the departure coefficients for some important
levels of Ca II plotted for selected models of our grid. In
the temperature regime we are concerned with here (
=
5000 K-6000 K), Ca II dominates the element number
density over atmospheric depths. Thus, no process seems to affect
the Ca II ground-state population, and 4s keeps its
thermodynamic equilibrium value. An exception is the uppermost layers above
= -4 in the very metal-poor ([Fe/H]
-2)
models with
= 6000 K. Ca II competes there
with Ca III in contributing to the element population,
and enhanced ionization of the low excitation levels of Ca II leads to underpopulation of the total Ca II. This effect is amplified with decreasing metallicity. The levels 3d
and 4p follow the ground state in deep layers, and their
coupling is lost at the depths where, for each model, photon
losses in the weakest line
of the multiplet
start to become important. These are the uppermost layers
above
= -5 in the solar metallicity models and
above
= -3 in the models with [Fe/H] = -2. At
[Fe/H] = -3, detailed balance in the transition
is destroyed in the deeper layers
around
= -2. The departure coefficients of
 and the higher excitation levels begin to deviate from 1 far inside the atmosphere even in the solar
metallicity models due to photon losses in the transitions to low
excitation levels.
and the higher excitation levels begin to deviate from 1 far inside the atmosphere even in the solar
metallicity models due to photon losses in the transitions to low
excitation levels.
Table 3: Uncertainties in the NLTE analysis of Ca I/II, where blanks denote NLTE theoretical equivalent widths below 5 mÅ.
NLTE leads to strengthened Ca II lines and negative NLTE abundance corrections. The behavior of individual lines is as follows.
In the stellar parameter range we are concerned with in this
paper, departures from LTE occur only in the very core of
Ca II K
.
The NLTE abundance correction does
not exceed 0.02 dex in absolute value. This can be understood
because the line continues to be strong even at [Ca/H] = -3, and its
line strength is dominated by the line wings.
Similar to the resonance line, the IR lines of multiplet
,
,
 ,
and
,
and
 ,
reveal NLTE effects only in the Doppler core.
The line core is strengthened because the line source function drops
below the Planck function due to
,
reveal NLTE effects only in the Doppler core.
The line core is strengthened because the line source function drops
below the Planck function due to
 and the lower
level of the transition is overpopulated (
and the lower
level of the transition is overpopulated (
 )
at the line
core formation depths. The NLTE correction is larger in absolute value
for the weakest line,
,
compared to the other two due
to a smaller contribution from the line wings to the overall line strength.
However, even for
,
is small
for the models with [Fe/H] = 0 and -1,
)
at the line
core formation depths. The NLTE correction is larger in absolute value
for the weakest line,
,
compared to the other two due
to a smaller contribution from the line wings to the overall line strength.
However, even for
,
is small
for the models with [Fe/H] = 0 and -1,
 (Table 2). The van der Waals
broadened wings are weakened with decreasing Ca abundance and, at a fixed metallicity, with decreasing surface gravity, and increasing temperature. The NLTE effects
are amplified in the same directions such that
(
)
reaches -0.41 dex for the model 6000 K / 3.0
/ -3. Significant NLTE effects can be expected in the
low-density atmospheres of metal-poor red giants. Further investigations
will be conducted when we have proper observations at our disposal.
(Table 2). The van der Waals
broadened wings are weakened with decreasing Ca abundance and, at a fixed metallicity, with decreasing surface gravity, and increasing temperature. The NLTE effects
are amplified in the same directions such that
(
)
reaches -0.41 dex for the model 6000 K / 3.0
/ -3. Significant NLTE effects can be expected in the
low-density atmospheres of metal-poor red giants. Further investigations
will be conducted when we have proper observations at our disposal.
The IR high excitation lines of multiplets
 ,
,
 and
and
 ,
and
,
and
 ,
,
 and
and
 ,
can be good candidates for
determining the Ca II abundance in close to solar-metallicity cool
stars. They are of intermediate strength and nearly free of blends.
It can be seen from Fig. 4 that the high excitation levels are all depleted
relative to their LTE populations at line formation depths in the
models with [Fe/H]
-2. However, the lower levels of the
considered transitions, 5p and 4d, are underpopulated to a lesser
extent than are the upper levels, 5d and 4f, resulting in
smaller line source functions compared to the Planck function and
enhanced line absorption. The NLTE effects are significant even for
the solar metallicity models and become stronger with
increasing
and decreasing .
The lines of multiplet
are weaker compared to
and
and, in general, reveal smaller NLTE effects. In
Table 2, we present
for
and
.
The NLTE corrections for the
second line of multiplet
are close to the corresponding
values for
and, in general, are smaller by up to
0.03 dex in absolute value. For
,
the NLTE effects are
very small with
at the level of a few parts in a hundred.
,
can be good candidates for
determining the Ca II abundance in close to solar-metallicity cool
stars. They are of intermediate strength and nearly free of blends.
It can be seen from Fig. 4 that the high excitation levels are all depleted
relative to their LTE populations at line formation depths in the
models with [Fe/H]
-2. However, the lower levels of the
considered transitions, 5p and 4d, are underpopulated to a lesser
extent than are the upper levels, 5d and 4f, resulting in
smaller line source functions compared to the Planck function and
enhanced line absorption. The NLTE effects are significant even for
the solar metallicity models and become stronger with
increasing
and decreasing .
The lines of multiplet
are weaker compared to
and
and, in general, reveal smaller NLTE effects. In
Table 2, we present
for
and
.
The NLTE corrections for the
second line of multiplet
are close to the corresponding
values for
and, in general, are smaller by up to
0.03 dex in absolute value. For
,
the NLTE effects are
very small with
at the level of a few parts in a hundred.
To assess the effects of crucial atomic data on the accuracy of
NLTE Ca abundances derived from the Ca I and Ca II lines, test calculations were performed for three models with
= 5500 K, = 4.0, and [Fe/H] = -1, -2, and -3.
For each parameter or set of cross-sections that we varied, we computed a small
grid for a given line at different abundances to determine the systematic shift in
Ca abundance needed to fit the NLTE equivalent width evaluated using our
standard set of atomic data. The results of the tests are
summarized for selected lines in Table 3.
The OP photoionization data based on the R-matrix calculations are typically accurate to 10%. In test computations, we assumed a factor of two uncertainty of photoionization cross-sections as a worst case. As expected, a variation in the photoionization rates affects the lines of the minority species (Ca I) by way of a displaced ionization balance and does not affect the lines of the majority species (Ca II). Corrections for the Ca I lines decrease with decreasing metallicity. The explanation lies with an increasing fraction of Ca III at the same optical depth in the models with decreasing metallicity. When cross-sections of both the Ca I and Ca II levels change, the Ca I/Ca II/Ca III ionization balance is established in such way that the Ca I/Ca II ratio is influenced to a lesser extent in the more metal-poor models.
In the present work, detailed electronic collision
excitation data are used for a considerable number of transitions
in Ca II and for all important transitions from the ground
state in Ca I. In test calculations, we varied collisional
rates for the remaining transitions applying the van Regemorter's
formula (1962) instead of IPM data. Van Regemorter's
collisional rates Cij(Reg) are, in general, higher than the
corresponding IPM-based values, by up to 2 orders of
magnitude for the transitions with energy separation
 2 eV (see Fig. 2 in Mashonkina 1996, for the transitions in Mg I). As a result, NLTE effects are weakened compared to the
standard collisional recipe, and a NLTE Ca abundance is obtained to
be closer to the LTE one (lower from the Ca I lines and
higher from the Ca II lines, Table 3). The
only exception is Ca I 5857 for which NLTE effects are
strengthened. In any case, a variation in the electronic collision
rates only weakly affects the Ca I lines, such that the
derived Ca abundance changes by 0.04 dex, at maximum. In
contrast, the effect is significant for the Ca II lines, and a change in Ca abundance may consist of 0.07 dex to 0.14 dex for different lines. A different reaction of the Ca I and
Ca II lines can be understood because the main mechanism of
departures from LTE is connected with b-f transitions for Ca I, while with b-b transitions for Ca II.
2 eV (see Fig. 2 in Mashonkina 1996, for the transitions in Mg I). As a result, NLTE effects are weakened compared to the
standard collisional recipe, and a NLTE Ca abundance is obtained to
be closer to the LTE one (lower from the Ca I lines and
higher from the Ca II lines, Table 3). The
only exception is Ca I 5857 for which NLTE effects are
strengthened. In any case, a variation in the electronic collision
rates only weakly affects the Ca I lines, such that the
derived Ca abundance changes by 0.04 dex, at maximum. In
contrast, the effect is significant for the Ca II lines, and a change in Ca abundance may consist of 0.07 dex to 0.14 dex for different lines. A different reaction of the Ca I and
Ca II lines can be understood because the main mechanism of
departures from LTE is connected with b-f transitions for Ca I, while with b-b transitions for Ca II.
We also inspected the effect of including hydrogenic collisions
in our SE calculations. Table 3 shows the
difference in Ca abundance derived assuming = 1 and ignoring
H collisions ( = 0). As expected, departures from LTE are weakened
for the Ca II lines. Changes in Ca II abundance are
comparable to those obtained when varying electronic collision
rates. A somewhat unexpected behavior is seen for most Ca I lines in
the model with [Fe/H] = -1 and for
in the model
with [Fe/H] = -2: NLTE effects seem to be amplified when the total
collisional rates increase.
This can be understood because departures from LTE go down in the line
wings, as expected, but are hardly changed in the cores of strong lines
due to the inefficiency of collisions in the uppermost atmospheric
layers. Thus, the line wings act no longer to reduce the
combined NLTE effect on the overall line strength, and it becomes larger
compared to the case of electronic collisions alone.
In addition, we examined the effect of a shift of the line
formation depths due to increasing the microturbulence value in the
model. An increase in
by 0.5 km s-1 has a negligible effect
on
for every Ca line in the models with [Fe/H] = -2 and -3 and leads to strengthening NLTE effects for the
model with [Fe/H] = -1. The maximum correction amounts to -0.03 dex.
Table 4:
Atomic data for the Ca I and Ca II lines, solar
 values determined from NLTE analysis of the Ca line profiles
in the Kitt Peak Solar Atlas (Kurucz et al. 1984) neglecting
hydrogenic collisions ( = 0), and abundance corrections
values determined from NLTE analysis of the Ca line profiles
in the Kitt Peak Solar Atlas (Kurucz et al. 1984) neglecting
hydrogenic collisions ( = 0), and abundance corrections
 where X takes the meaning 0.1, 1, and LTE for = 0.1, = 1
and the LTE assumption, respectively.
where X takes the meaning 0.1, 1, and LTE for = 0.1, = 1
and the LTE assumption, respectively.
Thus, the largest uncertainty of NLTE results for Ca I/II is caused by poor knowledge of collision processes. Below we empirically constrain collisional data by analyzing the Ca lines in solar (Sect. 4) and stellar (Sect. 6) spectra.
In this section, we derive the solar Ca abundance from the Ca I subordinate lines and the Ca II high excitation lines and examine the atomic data used in SE calculations and element abundance determinations. By taking advantage of the applied NLTE approach,
both weak and strong Ca lines are included in the analysis. An exception is the resonance lines in Ca I and Ca II and
the Ca II lines of multiplet
,
because their cores
and inner wings are influenced by the chromospheric temperature
rise and by the non-thermal and depth-dependent chromospheric velocity
field that is not part of the MAFAGS model of the solar atmosphere.
However, here we check the wings of Ca I
and
Ca II
.
We used solar flux observations taken from the Kitt Peak Solar
Atlas (Kurucz et al. 1984) and selected the Ca lines free of
blends, the ones with only one distorted line wing (e.g., Ca I
 ), or those where the blending lines can
be taken into account correctly (e.g., Ca I
), or those where the blending lines can
be taken into account correctly (e.g., Ca I  6572 in
the wing of Balmer line H). The investigated lines are
listed in Table 4.
6572 in
the wing of Balmer line H). The investigated lines are
listed in Table 4.
Four different sets of oscillator strengths were applied and compared in this study. (i) The fij values obtained from laboratory measurements are available for all selected Ca I lines and shown in Table 4 (column LAB), together with their sources; (ii) The fij based on OP calculations are available for all optically permitted transitions in Ca I and Ca II, as are the data from (iii) the NIST; and (iv) VALD databases. We used the radiative widths obtained by Kurucz (1992) from radiative lifetimes which are accessible via the VALD database.
For 17 Ca I lines, the C6 values were computed from
damping parameters given by Smith (1981) and based on the
measured parameters for broadening by helium. For the remaining
lines, we adopted C6 values based on either
or Kurucz
calculations, giving a preference to the first source. The
necessary data are accessible via the VALD database. The van der Waals damping parameters based on the perturbation theory of
agree within 0.1 dex of  with the quantum mechanic
computations by Spielfiedel et al. (1991) for the
Ca I multiplet 3 (
-
with the quantum mechanic
computations by Spielfiedel et al. (1991) for the
Ca I multiplet 3 (
-
 )
and by Kerkeni et al. (2004) for the Ca I resonance line
.
For four among five common Ca I multiplets, the predicted parameters
lead to stronger collisional broadening compared to that from the
experimental data of Smith (1981). The difference in
ranges from 0.19 dex to 0.32 dex. The opposite is the case
for the Ca I
line with the experimental value
of
larger by 0.25 dex compared to the predicted one.
For Ca I
and the lines of Ca II
multiplets
and
,
the C6 values are obtained
empirically from the fitting of solar line profiles. We note that
not only
but also two other lines of the
Ca I multiplet
-
)
and by Kerkeni et al. (2004) for the Ca I resonance line
.
For four among five common Ca I multiplets, the predicted parameters
lead to stronger collisional broadening compared to that from the
experimental data of Smith (1981). The difference in
ranges from 0.19 dex to 0.32 dex. The opposite is the case
for the Ca I
line with the experimental value
of
larger by 0.25 dex compared to the predicted one.
For Ca I
and the lines of Ca II
multiplets
and
,
the C6 values are obtained
empirically from the fitting of solar line profiles. We note that
not only
but also two other lines of the
Ca I multiplet
-
 ,
,
 and
and
 ,
though being blended,
certainly cannot be fitted with
,
though being blended,
certainly cannot be fitted with
 as computed from
data. We find
as computed from
data. We find
 for these lines. The
best fit of
is shown in Fig. 5. For
the Ca II multiplet
,
for these lines. The
best fit of
is shown in Fig. 5. For
the Ca II multiplet
,
 is
found from the requirement that element abundances derived from
the weaker line,
(
is
found from the requirement that element abundances derived from
the weaker line,
( = 18 mÅ), and the
stronger line,
(
= 18 mÅ), and the
stronger line,
(
 65 mÅ), must be
equal. In contrast to multiplet
,
the lines of the
Ca II multiplet
,
and
,
are both sensitive to a variation in the van der Waals damping constant. We assumed that the broadening parameter calculated by Kurucz is underestimated to the same
extent as the corresponding value for multiplet
and,
thus, obtained
65 mÅ), must be
equal. In contrast to multiplet
,
the lines of the
Ca II multiplet
,
and
,
are both sensitive to a variation in the van der Waals damping constant. We assumed that the broadening parameter calculated by Kurucz is underestimated to the same
extent as the corresponding value for multiplet
and,
thus, obtained
 for multiplet
.
The best
fit of
is shown in Fig. 5. The
atomic data we used are presented in Table 4.
for multiplet
.
The best
fit of
is shown in Fig. 5. The
atomic data we used are presented in Table 4.
![\begin{figure}
\par\includegraphics[width=6.95cm,clip]{5999fi5a.ps}\vspace*{3mm}...
...5c.ps}\vspace*{3mm}
\includegraphics[width=7.35cm,clip]{5999fi5d.ps}\end{figure}](/articles/aa/full/2007/01/aa5999-06/img156.gif) |
Figure 5:
Synthetic NLTE ( = 0, continuous line) and LTE (dotted line) flux profiles of the Ca I
,
,
and
and
Ca II
lines compared with the observed
spectrum of the Kurucz et al. (1984) solar flux atlas (bold dots).
The fitting parameters are presented in Table 4. It
should be stressed that different Ca abundances are required to
achieve the best fits of the observed profile in the NLTE ( = 0) and LTE cases. Everywhere
 km s-1. km s-1. |
| Open with DEXTER | |
A depth-independent microturbulence of 0.9 km s-1 is adopted. Our
synthetic flux profiles are convolved with a profile that combines
a rotational broadening of 1.8 km s-1 and broadening by
macroturbulence with a radial-tangential profile of
 =
3 km s-1 to
= 4 km s-1 for different lines.
=
3 km s-1 to
= 4 km s-1 for different lines.
For each investigated line, the product
was obtained from solar line-profile fitting under various
line-formation assumptions: NLTE = 0, = 0.1, and
= 1 and LTE. Table 4 presents the NLTE values
derived assuming = 0 and abundance corrections
where X takes the meaning of 0.1, 1, and LTE for = 0.1,
= 1, and the LTE assumption, respectively. By definition,
 (Table 4) =
 (Table 2). It is interesting to note that, for every investigated line,
the
given in the first string of
Table 2 does not coincide in absolute value with
in Table 4. This can be understood because the NLTE corrections in Table 2
were calculated from comparison of NLTE and LTE equivalent
widths, while abundance corrections in Table 4 are
based on the analysis of line profiles. For
each spectral line, the best NLTE fit, independent of its value,
reproduces the line core better than the LTE one. However, for
many lines, even the NLTE fit is not perfect. As an example, we
show the best NLTE ( = 0) and LTE fits in Fig. 5 for
three lines of Ca I and
of Ca II. It is clearly seen that the observed line core of Ca I
is asymmetric. This is, most probably,
due to atmospheric inhomogeneity and, therefore, cannot be
reproduced in the framework of a 1D analysis.
(Table 2). It is interesting to note that, for every investigated line,
the
given in the first string of
Table 2 does not coincide in absolute value with
in Table 4. This can be understood because the NLTE corrections in Table 2
were calculated from comparison of NLTE and LTE equivalent
widths, while abundance corrections in Table 4 are
based on the analysis of line profiles. For
each spectral line, the best NLTE fit, independent of its value,
reproduces the line core better than the LTE one. However, for
many lines, even the NLTE fit is not perfect. As an example, we
show the best NLTE ( = 0) and LTE fits in Fig. 5 for
three lines of Ca I and
of Ca II. It is clearly seen that the observed line core of Ca I
is asymmetric. This is, most probably,
due to atmospheric inhomogeneity and, therefore, cannot be
reproduced in the framework of a 1D analysis.
![\begin{figure}
\par\includegraphics[width=7.2cm,clip]{5999fi6a.ps}\par\includegr...
...lip]{5999fi6b.ps}\par\includegraphics[width=7.2cm,clip]{5999fi6c.ps}\end{figure}](/articles/aa/full/2007/01/aa5999-06/img159.gif) |
Figure 6:
Solar NLTE (
= 0) Ca abundances from the
Ca I (filled circles) and Ca II (open diamonds)
lines plotted as a function of the line equivalent width. Top,
middle, and bottom panels show results based on the measured
fij, OP, and NIST data, respectively. In each panel, the mean abundance derived from the Ca I lines is shown by the dotted line and the mean values and their standard deviations are quoted for Ca I and Ca II. |
| Open with DEXTER | |
Using the obtained values
and fij from different sets, we computed Ca abundances from individual lines. Figure 6 illustrates results
for NLTE ( = 0) calculations. It can be seen that the laboratory
oscillator strengths provide the highest accuracy in the absolute solar abundance derived from the lines of Ca I. The NLTE
and LTE averages from 23 lines are
 (LAB, = 0) =
6.37
0.06,
(LAB, = 0.1) = 6.36
0.06,
(LAB, = 1) = 6.35
0.06, and
(LAB,
LTE) = 6.34
0.06. Throughout this paper, the standard
deviations are quoted. The NLTE effects for Ca I in the Sun
are very small, and we present the results only for =
0. The Ca abundances based on OP fij for 20 Ca I lines reveal
a large spread of data with the mean values
(OP, =
0) = 6.49
0.23 and
(OP, LTE) = 6.46
0.21.
Excluding the one line,
(LAB, = 0) =
6.37
0.06,
(LAB, = 0.1) = 6.36
0.06,
(LAB, = 1) = 6.35
0.06, and
(LAB,
LTE) = 6.34
0.06. Throughout this paper, the standard
deviations are quoted. The NLTE effects for Ca I in the Sun
are very small, and we present the results only for =
0. The Ca abundances based on OP fij for 20 Ca I lines reveal
a large spread of data with the mean values
(OP, =
0) = 6.49
0.23 and
(OP, LTE) = 6.46
0.21.
Excluding the one line,
 ,
with the largest contribution to
standard deviation, we obtain
(OP, = 0) = 6.45
0.14 and
(OP, LTE) = 6.43
0.14. From 20 Ca I lines with the NIST data available, the averages
equal
(NIST, = 0) = 6.29
0.13 and
(NIST, LTE) = 6.26
0.13. The results based on the
VALD data are close to those for laboratory measurements because,
for most lines investigated, the VALD's oscillator strengths were taken from Smith & Raggett
(1981). Tests show that the NLTE abundance from Ca I lines is not sensitive to a variation in electronic collisional rates in SE calculations. The use of the
formula of van Regemorter (1962) and the IPM data (Seaton
1962a) leads to the mean Ca abundances, consistent
within 0.01 dex. In either case, either NLTE or LTE, for any set of fij, no significant correlation of individual Ca abundance is found with the line strength.
,
with the largest contribution to
standard deviation, we obtain
(OP, = 0) = 6.45
0.14 and
(OP, LTE) = 6.43
0.14. From 20 Ca I lines with the NIST data available, the averages
equal
(NIST, = 0) = 6.29
0.13 and
(NIST, LTE) = 6.26
0.13. The results based on the
VALD data are close to those for laboratory measurements because,
for most lines investigated, the VALD's oscillator strengths were taken from Smith & Raggett
(1981). Tests show that the NLTE abundance from Ca I lines is not sensitive to a variation in electronic collisional rates in SE calculations. The use of the
formula of van Regemorter (1962) and the IPM data (Seaton
1962a) leads to the mean Ca abundances, consistent
within 0.01 dex. In either case, either NLTE or LTE, for any set of fij, no significant correlation of individual Ca abundance is found with the line strength.
Only predicted oscillator strengths are available for the
Ca II lines that were used to determine the absolute solar abundance
from Ca II lines. OP data provide high accuracy for the desired value
provided that an SE approach is applied. NLTE corrections remove a trend of the
Ca II abundance with a line strength obtained under the LTE assumption. Averages from eight lines are
 (OP, = 0) = 6.38
0.07,
(OP, = 0.1) = 6.40
0.06, and
(OP, = 1) = 6.43
0.08.
It should be noted that a variation in values within 0.6 dex for the
lines of the multiplets
and
sensitive to van der Waals broadening changes the mean Ca II abundance by only 0.01 dex.
The NIST database contains only three Ca II lines of interest, and their
fij are very close to the corresponding values from OP calculations. For the VALD data, the NLTE and LTE mean Ca II abundances equal
(VALD, = 0) = 6.65
0.32 and
(VALD, LTE) = 6.74
0.29. The large
standard deviation is mainly caused by
(OP, = 0) = 6.38
0.07,
(OP, = 0.1) = 6.40
0.06, and
(OP, = 1) = 6.43
0.08.
It should be noted that a variation in values within 0.6 dex for the
lines of the multiplets
and
sensitive to van der Waals broadening changes the mean Ca II abundance by only 0.01 dex.
The NIST database contains only three Ca II lines of interest, and their
fij are very close to the corresponding values from OP calculations. For the VALD data, the NLTE and LTE mean Ca II abundances equal
(VALD, = 0) = 6.65
0.32 and
(VALD, LTE) = 6.74
0.29. The large
standard deviation is mainly caused by
 and
and
 .
In contrast to Ca I, the NLTE Ca II abundance is sensitive to a variation in electronic collisional rates in SE calculations. The value determined using the formula of van Regemorter (1962) and assuming = 0 is higher by
0.05 dex compared to the corresponding value obtained for the
standard recipe of electronic collisional rates.
.
In contrast to Ca I, the NLTE Ca II abundance is sensitive to a variation in electronic collisional rates in SE calculations. The value determined using the formula of van Regemorter (1962) and assuming = 0 is higher by
0.05 dex compared to the corresponding value obtained for the
standard recipe of electronic collisional rates.
Taking the highest accuracy of the mean values into account, we preferred
to use as final values the Ca II abundance based on OP oscillator strengths and Ca I abundance based on the laboratory fij. They agree within 0.04 dex
provided that
0.1 and the standard recipe of electronic
collisional rates is applied. In any other case, the difference
equals 0.08 dex ( = 1 or van Regemorter's electronic
collisional rates) to 0.12 dex (LTE). Thus, using the theoretical
MAFAGS model atmosphere, we find the solar Ca abundance
to lie between 6.36 and 6.40.
We also obtain here the fitting parameters of solar Ca I
and Ca II
lines necessary for further analysis of metal-poor stars.
For both lines, oscillator strengths are taken from laboratory measurements (Smith &
Gallagher 1966 for
;
Theodosiou
1989 for
), and the van der Waals damping
constants are based on 's data (Table 4).
For
,
the isotope structure is taken into account with
atomic data from Table 1. A good fit of the observed solar flux profile of
in the wings is achieved for
 = 6.29 when
hydrogenic collisions are ignored and for
= 6.21 in the
LTE case. The NLTE effects are negligible for the
line wings. The
best fit is achieved at a Ca abundance of
= 6.28.
= 6.29 when
hydrogenic collisions are ignored and for
= 6.21 in the
LTE case. The NLTE effects are negligible for the
line wings. The
best fit is achieved at a Ca abundance of
= 6.28.
Table 5: Stellar parameters and obtained NLTE elemental abundance ratios of the selected stars.
Recent determinations of solar photospheric Ca abundance based on a 3D LTE analysis (Asplund et al. 2005) give "excellent agreement between the two ionization stages'' and the average of
the two:
= 6.31
0.04. The average obtained from our
1D NLTE analysis is
= 6.38
0.06. We showed above
that the absolute Ca abundance depends on the adopted values of
oscillator strengths and van der Waals damping constants. The
cited paper of Asplund et al. does not give enough information for a discussion of the possible sources of the found discrepancy.
Our sample consists of eight stars. HD 61421 (Procyon) is selected as
a fundamental star with nearly the same list of detected Ca lines as in the
Sun. It is especially important for checking the Ca II high
excitation lines. The other objects are metal-poor stars with
metallicity ranging between [Fe/H] = -1.35 and [Fe/H] = -2.43.
They give an opportunity to study a formation of some of the
strongest Ca lines, Ca I
and Ca II
,
which presumably have a purely photospheric origin in this metallicity range.
Four metal-poor stars, HD 29907, HD 59392, HD 140283, and
BD  3208, were observed using the Ultraviolet and Visual
Echelle Spectrograph UVES at the 8 m ESO VLT UT2 telescope on Cerro
Paranal. At least two exposures were obtained for each star.
The spectral resolving power is about 60 000. The data cover an approximate spectral range of 4000-7000 Å. The signal-to-noise
ratio is 200 or higher over the whole spectral range. No near-IR spectra for HD 29907 and HD 59392 are available to us.
3208, were observed using the Ultraviolet and Visual
Echelle Spectrograph UVES at the 8 m ESO VLT UT2 telescope on Cerro
Paranal. At least two exposures were obtained for each star.
The spectral resolving power is about 60 000. The data cover an approximate spectral range of 4000-7000 Å. The signal-to-noise
ratio is 200 or higher over the whole spectral range. No near-IR spectra for HD 29907 and HD 59392 are available to us.
Observational data for all other stars (and for Ca II 8498 in BD 3208) were taken from Korn et al. (2003) with overall similar data-quality specifications as for the UVES data. For these data, the wavelength coverage is 4200-9000 Å. High-quality observations for Ca II 8498 in HD 140283 were taken from the ESO UVESPOP survey (Bagnulo et al. 2005).
We used stellar parameters determined in our earlier studies (Korn
et al. 2003; Mashonkina et al. 2003). In short,
effective temperatures were determined from Balmer line-profile
fitting, H
and H ,
with a statistical error
estimated at the level of 70 K, surface gravities from the H
IPPARCOS parallaxes with masses determined from the tracks of
VandenBerg et al. (2000). The errors obtained from
adding the squared errors of parallax and mass are quoted in
Table 5. The iron abundance and microturbulence
velocity were obtained requiring the derived [Fe/H]
,
with a statistical error
estimated at the level of 70 K, surface gravities from the H
IPPARCOS parallaxes with masses determined from the tracks of
VandenBerg et al. (2000). The errors obtained from
adding the squared errors of parallax and mass are quoted in
Table 5. The iron abundance and microturbulence
velocity were obtained requiring the derived [Fe/H] abundances not to depend on line
strength. For metal-poor stars, -enhanced models were
calculated with the abundances of -elements O, Mg, Si, and Ca,
scaled by the stellar Mg/Fe ratio. The latter was determined in
this study from NLTE analysis of four Mg I lines,
abundances not to depend on line
strength. For metal-poor stars, -enhanced models were
calculated with the abundances of -elements O, Mg, Si, and Ca,
scaled by the stellar Mg/Fe ratio. The latter was determined in
this study from NLTE analysis of four Mg I lines,
 ,
,
 ,
,
 ,
and
,
and
 .
We used the model atom and atomic data for
Mg I described by Gehren et al. (2004). Stellar
parameters are given in Table 5.
.
We used the model atom and atomic data for
Mg I described by Gehren et al. (2004). Stellar
parameters are given in Table 5.
The microturbulence values are somewhat lower than values
previously published by us, since we now utilize the broadening
parameters of Barklem & Aspelund-Johansson (2005), which
play a role even in the metal-poor stars as the analysis is
differential to the Sun. In all metal-poor stars,
distinguishing of the microturbulence values relies heavily on the
three strong Fe II lines of multiplet 42 (
 4923, 5018, and 5169 Å). All three lines seem to require
substantially higher microturbulence values in the Sun. Enforcing
a fixed solar microturbulence of
= 0.9 km s-1 thus means
that they cannot be well-fitted. We estimate that, depending on
the choices made in the fitting of solar lines and the line
selection for the metal-poor stars, microturbulence values can
easily vary by 0.2 km s-1. In particular, lower values seem
possible (e.g. disregarding Fe II 5169 Å). This is
important to bear in mind for the discussion of the strong lines
in Sects. 6 and 7.
4923, 5018, and 5169 Å). All three lines seem to require
substantially higher microturbulence values in the Sun. Enforcing
a fixed solar microturbulence of
= 0.9 km s-1 thus means
that they cannot be well-fitted. We estimate that, depending on
the choices made in the fitting of solar lines and the line
selection for the metal-poor stars, microturbulence values can
easily vary by 0.2 km s-1. In particular, lower values seem
possible (e.g. disregarding Fe II 5169 Å). This is
important to bear in mind for the discussion of the strong lines
in Sects. 6 and 7.
Our results are based on line profile analysis. In order to compare
with observations, computed synthetic profiles are convolved with
a profile that combines instrumental broadening with a Gaussian
profile and broadening by macroturbulence with a radial-tangential
profile. Only slow rotators are included in our sample,
 km s-1, except for Procyon with
 km s-1 (Fuhrmann 1998) and therefore the rotational velocity and
macroturbulence value cannot be separated at the spectral
resolving power of our spectra. We thus treat their overall effect as
radial-tangential macroturbulence. Rotational broadening and broadening
by macroturbulence are treated separately only for Procyon.
The macroturbulence value was determined for each star in our previous
studies from the analysis of an extended list of lines of Fe I/II,
Mg I, etc. Here,
was allowed to vary by
0.3 km s-1 (1
km s-1 (Fuhrmann 1998) and therefore the rotational velocity and
macroturbulence value cannot be separated at the spectral
resolving power of our spectra. We thus treat their overall effect as
radial-tangential macroturbulence. Rotational broadening and broadening
by macroturbulence are treated separately only for Procyon.
The macroturbulence value was determined for each star in our previous
studies from the analysis of an extended list of lines of Fe I/II,
Mg I, etc. Here,
was allowed to vary by
0.3 km s-1 (1 ).
).
In this section, we test NLTE formation of the Ca II lines
in two steps. In the first one, the Ca II high-excitation
lines are examined in the solar metallicity star Procyon. These
lines are more sensitive to details of NLTE calculations than
(see Table 3). We then derive element abundances from
the Ca I lines and from Ca II
for five metal-poor stars and
inspect the difference
 (Ca I - Ca II).
In the temperature regime we are concerned with, and
at metallicities [Fe/H] between -2 and -3, the equivalent width
ratio W(Ca I)/W(Ca II 8498) is weakly sensitive
to a variation in
and ,
independent of what
Ca I line is taken. For example,
(Ca I - Ca II).
In the temperature regime we are concerned with, and
at metallicities [Fe/H] between -2 and -3, the equivalent width
ratio W(Ca I)/W(Ca II 8498) is weakly sensitive
to a variation in
and ,
independent of what
Ca I line is taken. For example,  (Ca I 6439)/W(Ca II 8498) = -0.88, -0.81, -0.77, and -0.78 for
the models with
/ / [Fe/H] = 5000 K / 3.0 / -2,
5000 K / 4.0 / -2, 6000 K / 3.0 / -2, and 6000 K / 4.0 / -2,
respectively. This can be understood because the van der Waals
broadened line wings significantly contribute to
W(Ca II 8498), even at [Ca/H] = -2.6 (for the models with
[Fe/H] = -3). When
increases, strengthening of the
line wings is compensated for by weakening NLTE effects. In such conditions, a difference between Ca abundances determined from two ionization stages, if present, will point to
shortcomings in the NLTE treatment of Ca lines rather than to the
uncertainty of stellar parameters.
(Ca I 6439)/W(Ca II 8498) = -0.88, -0.81, -0.77, and -0.78 for
the models with
/ / [Fe/H] = 5000 K / 3.0 / -2,
5000 K / 4.0 / -2, 6000 K / 3.0 / -2, and 6000 K / 4.0 / -2,
respectively. This can be understood because the van der Waals
broadened line wings significantly contribute to
W(Ca II 8498), even at [Ca/H] = -2.6 (for the models with
[Fe/H] = -3). When
increases, strengthening of the
line wings is compensated for by weakening NLTE effects. In such conditions, a difference between Ca abundances determined from two ionization stages, if present, will point to
shortcomings in the NLTE treatment of Ca lines rather than to the
uncertainty of stellar parameters.
Analysis of stellar spectra is made line-by-line differentially with respect to the Sun. At the LTE assumption, the cores of many lines cannot be fitted. In such cases, the Ca abundance is derived from the line wing fitting.
Procyon
Irrespective of the assumed efficiency of hydrogen collisions, average NLTE effects are very small among weak Ca I lines (
 100 mÅ) and vary between -0.02 dex ( = 1) and -0.03 dex ( = 0). However, the SE approach is able to remove a steep trend with line strength among strong Ca I lines seen in LTE (see Fig. 7). For individual strong lines (like Ca I 6439 Å), NLTE corrections exceed -0.3 dex.
Among weak lines ( < 100 mÅ), the line-to-line scatter is reduced by all three NLTE models and attains its minimal value ( = 0.027 dex) at = 0.1. Surprisingly, the mean abundance derived from Ca I lines is clearly subsolar,
[Ca/H]
100 mÅ) and vary between -0.02 dex ( = 1) and -0.03 dex ( = 0). However, the SE approach is able to remove a steep trend with line strength among strong Ca I lines seen in LTE (see Fig. 7). For individual strong lines (like Ca I 6439 Å), NLTE corrections exceed -0.3 dex.
Among weak lines ( < 100 mÅ), the line-to-line scatter is reduced by all three NLTE models and attains its minimal value ( = 0.027 dex) at = 0.1. Surprisingly, the mean abundance derived from Ca I lines is clearly subsolar,
[Ca/H] = -0.12
0.04 (LTE) to -0.15
0.04 ( = 0).
= -0.12
0.04 (LTE) to -0.15
0.04 ( = 0).
![\begin{figure}
\par\includegraphics[width=8cm,clip]{5999fig7.ps}\end{figure}](/articles/aa/full/2007/01/aa5999-06/img180.gif) |
Figure 7:
Trends in abundance with line strength determined from the Ca I lines in Procyon for our best NLTE model ( top) and under the assumption of LTE ( bottom). Note the steep trend of the LTE [Ca/H] values with line strength above = 100 mÅ. The mean values given are computed only from weak lines (
100 mÅ). |
| Open with DEXTER | |
Abundances for Ca II are derived from six high-excitation
lines. The mean NLTE value is [Ca/H](NLTE) = 0.07
0.05,
independent of the assumed strength of hydrogenic
collisions. The LTE abundances show a mean value of [Ca/H](LTE) = 0.14
0.05. Applying the formula
of van Regemorter (1962) to a calculation of electronic
collisional rates results in an even larger difference
(Ca I - Ca II).
Can the stellar parameters cause this discrepancy?
Allende Prieto et al. (2002) estimated an error of 49 K for the
effective temperature. Ramirez & Melendez
(2005) revised the fundamental effective temperature of
Procyon to
 39 K and derived
 73 K using their infrared
flux method. Assuming
73 K using their infrared
flux method. Assuming
 K (a value favored by Korn
et al. 2003 for the NLTE ionization equilibrium of Fe I/II) and keeping the values of ,
[Fe/H], and
unchanged, we obtain mean values [Ca/H](NLTE) =
-0.10
0.04 and [Ca/H](NLTE) = 0.05
0.05. As the discrepancy lies with weak lines, modifications to the microturbulence value cannot remove this
discrepancy either. Aufdenberg et al. (2005)
conclude that the interferometric data provide evidence of
convective overshooting in Procyon's atmosphere. We checked a model that includes an "approximate overshooting'' prescription for convective flux transport in a mixing-length formalism
according to Castelli et al. (1997). The investigated
lines of both Ca I and Ca II become weaker in this
model compared to our standard MAFAGS model, and the derived
abundances of Ca I and Ca II increase by 0.08-0.10 dex for different lines. However, the difference
(Ca I - Ca II) remains at the same
level.
K (a value favored by Korn
et al. 2003 for the NLTE ionization equilibrium of Fe I/II) and keeping the values of ,
[Fe/H], and
unchanged, we obtain mean values [Ca/H](NLTE) =
-0.10
0.04 and [Ca/H](NLTE) = 0.05
0.05. As the discrepancy lies with weak lines, modifications to the microturbulence value cannot remove this
discrepancy either. Aufdenberg et al. (2005)
conclude that the interferometric data provide evidence of
convective overshooting in Procyon's atmosphere. We checked a model that includes an "approximate overshooting'' prescription for convective flux transport in a mixing-length formalism
according to Castelli et al. (1997). The investigated
lines of both Ca I and Ca II become weaker in this
model compared to our standard MAFAGS model, and the derived
abundances of Ca I and Ca II increase by 0.08-0.10 dex for different lines. However, the difference
(Ca I - Ca II) remains at the same
level.
![\begin{figure}
\par\includegraphics[width=6.9cm,clip]{5999fig8.ps}\end{figure}](/articles/aa/full/2007/01/aa5999-06/img184.gif) |
Figure 8:
The best NLTE (
= 0.1) fits (continuous line) of
the observed profiles of Ca II
in spectra
of HD 19445 and HD 103095 (bold dots). The obtained NLTE Ca abundances are presented in Table 5. For HD 19445, line profiles are shifted along Y axis. |
| Open with DEXTER | |
The effect of atmospheric temperature inhomogeneities on Ca I/II is expected to be within the same order of magnitude as that for neutral and singly-ionized iron lines, as calculated by Allende Prieto et al. (2002). They show that weak lines (
 50 mÅ) of both ionization stages, Fe I and Fe II, are weakened compared to a classical 1D analysis, such that the derived Fe abundance increases by 0.05 dex and 0.04 dex, respectively. Three-dimensional simulations might lead to the higher Ca abundance for Procyon compared to our results; however, the discrepancy between Ca I and Ca II is unlikely to be removed.
Thus, while our NLTE analysis leads to a better agreement of the Ca abundance from the two ionization stages, the discrepancy exceeds 3
under standard assumptions about Procyon's stellar parameters.
50 mÅ) of both ionization stages, Fe I and Fe II, are weakened compared to a classical 1D analysis, such that the derived Fe abundance increases by 0.05 dex and 0.04 dex, respectively. Three-dimensional simulations might lead to the higher Ca abundance for Procyon compared to our results; however, the discrepancy between Ca I and Ca II is unlikely to be removed.
Thus, while our NLTE analysis leads to a better agreement of the Ca abundance from the two ionization stages, the discrepancy exceeds 3
under standard assumptions about Procyon's stellar parameters.
HD 19445
The abundance is determined from 15 Ca I lines with
equivalent widths between 4 mÅ and 63 mÅ. The accuracy of
the obtained differential abundances is at the level of
 dex for = 0, 0.1 and the LTE case and slightly worse,
 dex, for = 1. The difference between NLTE and
LTE Ca I abundances depends strongly on the assumed value
of .
It equals +0.13 dex for = 0 and reduces down to
+0.03 dex for = 1. In contrast, NLTE abundances from
Ca II
are lower than in LTE. The best fit
of
achieved at = 0.1 and [Ca/Fe] = 0.40 is
shown in Fig. 8. The difference between Ca I and Ca II abundances is
found to be 0.04 dex, -0.04 dex, -0.11 dex, and -0.19 dex
for = 0, = 0.1, = 1, and LTE, respectively. An uncertainty in microturbulence of 0.2 km s-1 hardly affects the Ca I abundance and leads to a change in Ca II of
0.03 dex. This does not destroy the agreement of the NLTE Ca I and Ca II abundances if = 0 or 0.1 is assumed.
dex, for = 1. The difference between NLTE and
LTE Ca I abundances depends strongly on the assumed value
of .
It equals +0.13 dex for = 0 and reduces down to
+0.03 dex for = 1. In contrast, NLTE abundances from
Ca II
are lower than in LTE. The best fit
of
achieved at = 0.1 and [Ca/Fe] = 0.40 is
shown in Fig. 8. The difference between Ca I and Ca II abundances is
found to be 0.04 dex, -0.04 dex, -0.11 dex, and -0.19 dex
for = 0, = 0.1, = 1, and LTE, respectively. An uncertainty in microturbulence of 0.2 km s-1 hardly affects the Ca I abundance and leads to a change in Ca II of
0.03 dex. This does not destroy the agreement of the NLTE Ca I and Ca II abundances if = 0 or 0.1 is assumed.
HD 84937
The abundance obtained from Ca I lines varies between
[Ca/Fe] = 0.47
0.04 and [Ca/Fe] =
0.39
0.04, when changing
between 0 and  (LTE). Similar to HD 19445, the abundances from the two ionization stages agree much more closely in the NLTE case than in LTE one -
(Ca I - Ca II) = +0.11 dex and
-0.02 dex for NLTE abundances at = 0 and 1, respectively -
while the difference of LTE abundances equals -0.23 dex. The
best agreement is found for an value between 0.1 and 1.
(LTE). Similar to HD 19445, the abundances from the two ionization stages agree much more closely in the NLTE case than in LTE one -
(Ca I - Ca II) = +0.11 dex and
-0.02 dex for NLTE abundances at = 0 and 1, respectively -
while the difference of LTE abundances equals -0.23 dex. The
best agreement is found for an value between 0.1 and 1.
HD 103095
The determined NLTE abundances range between [Ca/Fe] =
0.37
0.04 and [Ca/Fe] = 0.29
0.04,
depending on the assumed value. NLTE effects for Ca II
occur only in the very core, and the same Ca abundance is obtained with [Ca/Fe] = 0.29, independent
of the theory of line formation used. The best fit of this line is
achieved for = 0.1 (Fig. 8). The difference
between Ca I and Ca II is within the mutual error
bars in all cases:
(Ca I - Ca II) =
+0.08 dex, +0.01 dex, 0.00 dex, and +0.03 dex for = 0,
0.1, 1, and LTE, respectively. It should be noted that the
discrepancy is larger when hydrogenic collisions are neglected
(cf. HD 84937 above).
HD 140283
The [Ca/Fe]
ratios vary between +0.16
0.03 (LTE)
and +0.33
0.03 ( = 0) and are determined from six lines with equivalent widths between 6 and 40 mÅ. At a microturbulence value of
= 1.65 km s-1, the Ca I resonance line ( = 146 mÅ) is in good agreement with
the weak lines under the assumption of LTE, but yields
abundances that are too low for all NLTE models. We comment on this behavior in the
next section. As in the case of HD 84937,
(Ca I - Ca II) vanishes between
= 0.1 and 1. In LTE, however, its value is -0.3 dex.
BD 3208
This star is found to be very similar to HD 84937, both with
respect to its stellar parameters and its behavior in terms of
(Ca I - Ca II). The abundances
obtained from 14 Ca I lines with equivalent widths between
4 mÅ and 40 mÅ give mean values of [Ca/Fe]( = 0.1) = 0.43
0.04 and [Ca/Fe](LTE) =
0.34
0.04. Good agreement between Ca I and Ca II is again found for an
range of 0 to 0.1, while the difference increases above = 0.1 and reaches -0.35 dex
in the case of LTE.
Summarizing our results for the five metal-poor stars, we conclude
that, within the modelling uncertainties, NLTE leads to consistent
Ca abundances derived from the two ionization stages, while LTE
fails to give consistent results. We find that ignoring hydrogenic
collisions results in NLTE effects that are too strong for Ca I/II.
Based on the results obtained for the Sun and the stars presented
in this section, our best choice for a scaling factor applied to
Steenbock & Holweger's (1984) formula is = 0.1. Final
Ca I and Ca II abundances corresponding to = 0.1 are presented in Table 5.
Ca I
is the only neutral calcium line that
can be detected in extremely metal-poor stars. In this section, we
test the NLTE formation of this line using the metal-poor stars where,
on one hand, the resonance line has a probably purely
photospheric origin and, on other hand, Ca I subordinate
lines are still measurable and provide a reliable value for the Ca abundance. In addition to the five metal-poor stars discussed
above, another two stars are studied here. We start by determining
the [Ca/Fe] ratio for them.
HD 29907
The Ca I abundance is determined from 16 lines with equivalent widths between 18 mÅ and 174 mÅ. NLTE removes a trend with the line strength displayed by LTE abundances
and results in the smaller standard deviation,
 dex, compared to
 dex in the LTE case. Mean
NLTE ( = 0.1) and LTE abundances agree within 0.01 dex.
dex in the LTE case. Mean
NLTE ( = 0.1) and LTE abundances agree within 0.01 dex.
![\begin{figure}
\par\includegraphics[width=6.9cm,clip]{5999fig9.ps}\end{figure}](/articles/aa/full/2007/01/aa5999-06/img191.gif) |
Figure 9:
Theoretical NLTE (
= 0.1, continuous line) profiles of the Ca I
line compared with the observed spectra of HD 29907 and HD 103095 (bold dots).
For each star, the Ca abundance taken from the analysis of
the Ca I subordinate lines (see Table 5) fits the resonance line as well.
Offsets in y are applied for better illustration. |
| Open with DEXTER | |
HD 59392
The NLTE and LTE mean abundances derived from 17 Ca I lines
turn out to be quite similar, [Ca/Fe]( = 0.1) =
0.26
0.04 and [Ca/Fe](LTE) = 0.24 0.05.
Our calculations show that, for every star, overionization in the
atmospheric layers below
 (Fig. 2) leads to weakening the line wings of
compared to the LTE case, while a steep decrease in the departure coefficient ratio
(Fig. 2) leads to weakening the line wings of
compared to the LTE case, while a steep decrease in the departure coefficient ratio
 above that depth
point results in the opposite effect for the line core. In the two coolest stars of our small sample, HD 29907 and HD 103095, the
Ca I resonance line is very strong with the core formed in
the uppermost atmospheric layers near
above that depth
point results in the opposite effect for the line core. In the two coolest stars of our small sample, HD 29907 and HD 103095, the
Ca I resonance line is very strong with the core formed in
the uppermost atmospheric layers near
 and -4.9, respectively (we indicate here a location of line-center optical-depth unity). However, total line absorption is
dominated by the van der Waals broadened wings and not by the
core. For both stars, we find that the NLTE theoretical profile
computed with Ca abundance determined from the Ca I subordinate lines describes the observed profile well, except for the very core, which can be influenced by the star's chromosphere.
Results are illustrated in Fig. 9.
and -4.9, respectively (we indicate here a location of line-center optical-depth unity). However, total line absorption is
dominated by the van der Waals broadened wings and not by the
core. For both stars, we find that the NLTE theoretical profile
computed with Ca abundance determined from the Ca I subordinate lines describes the observed profile well, except for the very core, which can be influenced by the star's chromosphere.
Results are illustrated in Fig. 9.
For HD 84937 and HD 19445, the agreement between subordinate
lines of Ca I, Ca II 8498, and Ca I 4226 is excellent
when = 0.1 is assumed. Ca I 4226 requires a [Ca/Fe] ratio of 0.41
for HD 84937 and of 0.36 for HD 19445.
A less consistent picture emerges for the remaining three stars.
When Ca abundance is fixed at the value derived from the analysis of the Ca I subordinate lines, the half-width of the theoretical NLTE profile of
is found to be larger than the observed one.
To fit the observed line width, a smaller Ca abundance is required: by 0.08 dex for HD 59292,
0.09 dex for HD 140283, and 0.22 dex for BD
 .
Discrepancies are
smaller in LTE for these stars, but larger for e.g. HD 84937. The found discrepancies could well be related to uncertainties in the microturbulence value, because,
in each star investigated, Ca I 4226 lies on the saturated part of the curve of
growth, and
.
Discrepancies are
smaller in LTE for these stars, but larger for e.g. HD 84937. The found discrepancies could well be related to uncertainties in the microturbulence value, because,
in each star investigated, Ca I 4226 lies on the saturated part of the curve of
growth, and
 km s-1 translates to
 =
+0.03 dex to +0.04 dex for different stars. However, for a star
like BD
,
a substantial reduction of the
microturbulence would be required, which in turn would affect the
good agreement between Ca I and Ca II reported
above. We note in passing that a similar discrepancy is found for
subordinate lines of Mg I and the Mg I b triplet
lines in these stars.
=
+0.03 dex to +0.04 dex for different stars. However, for a star
like BD
,
a substantial reduction of the
microturbulence would be required, which in turn would affect the
good agreement between Ca I and Ca II reported
above. We note in passing that a similar discrepancy is found for
subordinate lines of Mg I and the Mg I b triplet
lines in these stars.
Are these then shortcomings of our SE calculations?
Collisions are inefficient in the statistical equilibrium of atoms in
the layers, where the Doppler core of
is formed,
between
and -3, for the most metal-poor
stars of our sample, BD
and HD 140283. The
related non-LTE effect is therefore entirely due to
photoionization, which should be modelled accurately (given the
correctness of the OP photoionization cross-sections.)
The explanation can lie with the adopted one-dimensional atmospheric models.
Based on the recent results of Shchukina et al. (2005) for the
weak and moderately strong (
80 mÅ) lines of Fe I in HD 140283, we expect an overall small effect of atmospheric-temperature and velocity inhomogeneities on the
Ca I subordinate lines in our sample of metal-poor stars.
The Ca I resonance line may be a different case, because it
is formed over the more extended range of atmospheric depths. For
a fully quantitative understanding of its formation in cool stars,
more studies are required on the basis of advanced model
atmospheres. One clear advantage of such studies will be the
removal of adjustable parameters like microturbulence, from which
the current modelling potentially suffers.
In this section, we consider the possibility of using the
W(Ca I 4226)/W(Ca II 3933) and W(Ca I 4226)/W(Ca II 8498) equivalent width ratios as indicators of surface gravity for extremely metal-poor stars. At
extremely low Ca abundance, the line wings contribute no longer
to W(Ca II 8498). The line is expected to be
strengthened with decreasing
due to decreasing the H- continuous absorption. The NLTE effects for Ca II
are amplified in the same direction. Thus, the
W(Ca I 4226)/W(Ca II 8498) ratio should
increase when
goes up. The Ca II resonance lines
remain strong even at [Ca/H] = -5, and their van der Waals
broadened wings are weakened with decreasing .
The
Ca I resonance line is weakened in the same direction due
to amplified overionization. Thus, the W(Ca I 4226) /
W(Ca II 3933) ratio is rather insensitive to any variation in .
Both ratios were calculated for a small grid of models with [Fe/H] = -4.34; the Ca abundance was adopted to be [Ca/H] = -4.9. The results corresponding to
 are plotted
in Fig. 10 as a function of .
It is clear that the
W(Ca I 4226)/W(Ca II 8498) ratio can be used
to determine the surface gravity for extremely metal-poor stars, contrary to
the ratio involving the Ca II resonance line(s), which is
nearly constant over the
range between 2.5 and 4.5.
An application of this technique to the two known ultra-metal-poor stars
(HE 0107-5240, Christlieb et al. 2002; HE 1327-2326, Frebel et al. 2005)
will be presented in a forthcoming paper.
are plotted
in Fig. 10 as a function of .
It is clear that the
W(Ca I 4226)/W(Ca II 8498) ratio can be used
to determine the surface gravity for extremely metal-poor stars, contrary to
the ratio involving the Ca II resonance line(s), which is
nearly constant over the
range between 2.5 and 4.5.
An application of this technique to the two known ultra-metal-poor stars
(HE 0107-5240, Christlieb et al. 2002; HE 1327-2326, Frebel et al. 2005)
will be presented in a forthcoming paper.
![\begin{figure}
\par\includegraphics[width=7.5cm,clip]{5999fi10.ps}\end{figure}](/articles/aa/full/2007/01/aa5999-06/img199.gif) |
Figure 10:
The Ca I 4226 / Ca II 3933 and
Ca I 4226 / Ca II 8498 equivalent-width ratios as a function of the surface gravity for the models with
 K and [Fe/H] = -4.34. A Ca abundance of [Ca/H] = -4.9 has been adopted everywhere. K and [Fe/H] = -4.34. A Ca abundance of [Ca/H] = -4.9 has been adopted everywhere. |
| Open with DEXTER | |
In this study, NLTE line formation of an extended list of
Ca I and Ca II lines was considered for the
temperatures ranging between
 and
and
 ,
for surface gravities
3.0 and 4.0, and for metallicities
from [Fe/H] = 0 down to [Fe/H] = -4.34. For every Ca I line, departures from LTE affect its profile significantly over
the whole range of stellar parameters. If a line is strong
(multiplets 2, 3, 4, 18, 21, and 47 at [Fe/H]
-2 and the
remaining multiplets at [Fe/H]
-1), its wings are weakened
but the core is strengthened compared to the LTE case. The value
and sign of the NLTE abundance correction are defined by a relative
contribution of the core and the wings to the overall line
strength. When the line becomes weak due to decreasing Ca abundance, NLTE leads to depleted total absorption in the line and
positive abundance correction. The NLTE effects are very large at
extremely low Ca abundance. For example, at [Ca/H] = -4.9 NLTE abundance correction for Ca I
can exceed 0.5 dex. Thus, for a given line,
depends on
,
,
[Ca/H], and microturbulence value, and, for a given model,
is different in value and sign for a variety of Ca I lines. Any interpolation of NLTE results for Ca I has to be performed with caution.
,
for surface gravities
3.0 and 4.0, and for metallicities
from [Fe/H] = 0 down to [Fe/H] = -4.34. For every Ca I line, departures from LTE affect its profile significantly over
the whole range of stellar parameters. If a line is strong
(multiplets 2, 3, 4, 18, 21, and 47 at [Fe/H]
-2 and the
remaining multiplets at [Fe/H]
-1), its wings are weakened
but the core is strengthened compared to the LTE case. The value
and sign of the NLTE abundance correction are defined by a relative
contribution of the core and the wings to the overall line
strength. When the line becomes weak due to decreasing Ca abundance, NLTE leads to depleted total absorption in the line and
positive abundance correction. The NLTE effects are very large at
extremely low Ca abundance. For example, at [Ca/H] = -4.9 NLTE abundance correction for Ca I
can exceed 0.5 dex. Thus, for a given line,
depends on
,
,
[Ca/H], and microturbulence value, and, for a given model,
is different in value and sign for a variety of Ca I lines. Any interpolation of NLTE results for Ca I has to be performed with caution.
A different situation is found for Ca II. For every
Ca II line, NLTE leads to enhanced absorption in the line
core and negative abundance correction over the whole range of
stellar parameters. The absolute value of
is
defined by the relative contribution of the core and the wings to
equivalent width. For example, NLTE corrections remain very small
(0.02 dex) for the resonance lines and grow in absolute
value with decreasing Ca abundance for the IR lines of multiplet 3d-4p exceeding 0.4 dex in a metal-poor model with
= 6000 K, = 3.0, and [Fe/H] = -3. Such
corrections are important to consider for correctly
interpreting the near-IR spectroscopic data collected in the
RAVE survey and the future ESA Gaia satellite mission.
Empirical evidence is found from the analysis of stellar spectra
that inelastic collisions with hydrogen atoms serve as an additional source of thermalization in cool (metal-poor) stars. Our best choice for a scaling factor to the formula of Steenbock & Holweger (1984) for calculating hydrogenic collisions is = 0.1. Disregarding hydrogenic collisions completely will lead to
an overestimated NLTE effect at low metallicity.
Taking advantage of our SE approach and accurate atomic data for the
investigated lines, we obtain good agreement, within 0.04 dex, between
absolute solar Ca I (from 23 lines) and Ca II (from 8 lines)
abundances, and the average of the two is
 = 6.38
0.06.
Likewise, calcium abundances from two ionization stages are examined for the first time
for five metal-poor stars. We show that NLTE largely removes obvious discrepancies between
Ca I and Ca II obtained under the LTE assumption.
= 6.38
0.06.
Likewise, calcium abundances from two ionization stages are examined for the first time
for five metal-poor stars. We show that NLTE largely removes obvious discrepancies between
Ca I and Ca II obtained under the LTE assumption.
Solving the restricted NLTE problem for calcium in "classical'' one-dimensional LTE model atmospheres, we qualitatively understand the formation of the Ca I resonance line in metal-poor stars, where it has a purely photospheric origin. In agreement with observations, NLTE predicts weakening of the line wings and strengthening of the line core compared to the LTE case. Residual discrepancies may be related to the use of classical model atmospheres with adjustable parameters like microturbulence.
Acknowledgements
We are grateful to Thomas Gehren for providing a Windows version of the code DETAIL and Tatyana Ryabchikova for help with collecting atomic data. L.M. acknowledges with gratitude the Institute of Astronomy and Astrophysics of Munich University for warm hospitality during a productive stay in May-August 2005. This research was supported by the Deutsche Forschungsgemeinschaft with grant 436 RUS 17, the Russian Foundation for Basic Research with grant 05-02-39005-GFEN-a, the Royal Swedish Academy of Sciences with grant 11630102, and the Presidium RAS Programme "Origin and evolution of stars and the Galaxy''. A.J.K. acknowledges support from the Leopoldina foundation/Germany under grant BMBF-LPD 9901/8-87 and the Swedish Research Council. A.J.K. also thanks Nikolai Piskunov for travel support for a visit to Moscow in April 2005. We thank the anonymous referee for valuable suggestions and comments. We made ample use of data collected in the NIST and VALD databases.
 )
(In the text))
(In the text))
(In the text))
(In the text)
)
(In the text))
(In the text))
(In the text))
(In the text)