A&A 453, 1111-1116 (2006)
DOI: 10.1051/0004-6361:20064993
D. Tripathi1 - H. Isobe1, 2 - H. E. Mason1
1 - Department of Applied Mathematics and
Theoretical Physics, University of Cambridge, Wilberforce Road,
Cambridge, CB3 0WA, UK
2 -
Department of Earth and Planetary Science, University of
Tokyo, Hongo, Bunkyo-ku, Tokyo 113-0033, Japan
Received 9 February 2006 / Accepted 27 March 2006
Abstract
Aims. To study the relationship between the propagation of brightening and erupting filaments/prominences in order to get some insight into the three-dimensional picture of magnetic reconnection.
Methods. Analysis of the observations taken with the EIT (Extreme-ultraviolet Imaging Telescope) aboard SoHO (Solar and Heliospheric Observatory).
Results. When the prominences/filaments erupted having one point fixed - asymmetric eruption - the brightening propagated along the neutral line together with the expansion/separation from the polarity inversion line (PIL) as expected from the standard models. However in case of symmetric eruptions, the brightening propagated towards both end points starting at the middle. When the prominence/filament erupted faster then the speed of the propagating brightening was faster and vice-versa.
Conclusions. Based on these observations we conclude that the eruption and magnetic reconnection - propagation (along the PIL) and separation (away from PIL) of the brightening - are dynamically coupled phenomena. These observations can be explained by a simple extension of the 2D models illustrating eruption and magnetic reconnection to a 3D model.
Key words: Sun: corona - Sun: coronal mass ejections (CMEs) - Sun: prominences - Sun: filaments - Sun: flares
The formation of transient large-scale post-flare loops (Carmichael
1964; Sturrock 1966; Hirayama 1974; Kopp & Pneuman 1976, the
classical CSHKP model; Cargill & Priest 1983) or post-eruptive
arcades (e.g., Webb & Hundhausen 1987: Skylab; Svestka et al. 1997:
SXT; Tripathi et al. 2004; Tripathi 2005, 2006: EIT) has been found
to be one of the best foot prints of CMEs on the solar disk. Post
Flare Loops (PFLs) and Post-Eruptive Arcades (PEAs) are physically
the same phenomena, namely solar plasma tracing out the closed field
lines after magnetic reconnection. However, we use PEA instead of PFL hereafter because PEAs provides more general picture of the physical
process. The use of the term PFL can be misleading as it appears to
be associated only with strong flares. These loops are very often
seen in the X-ray images recorded by Soft X-ray Telescope (SXT)
aboard Yohkoh (e.g., Svestka et al. 1997) and also in the EUV images
from the EIT (Extreme-ultraviolet Imaging Telescope, Delaboudinière
et al. 1995) aboard the Solar and Heliospheric Observatory (SoHO,
Domingo et al. 1995). The PEAs are interpreted to be the consequence
of magnetic reconnection processes (Kopp & Pneuman 1976; Tripathi
et al. 2004; Tripathi 2005, 2006). The chromospheric counterpart of
these PEAs are the two bright ribbons frequently observed in H![]() following eruptions. These ribbons demark the foot-points of the
loops observed in SXR and EUV images. The expansion/separation of
flare ribbons are interpreted as a consequence of the rising of the
reconnection point at the current sheet formed during the CME or
flare eruption (e.g., Lin & Forbes 2000). The separation of these
flare ribbons has been used to estimate the electric field in the
reconnecting current sheet (e.g., Qiu et al. 2002; Asai et al. 2004)
and also the coronal magnetic field strength and the reconnection
rate (Isobe et al. 2002b, 2005).
following eruptions. These ribbons demark the foot-points of the
loops observed in SXR and EUV images. The expansion/separation of
flare ribbons are interpreted as a consequence of the rising of the
reconnection point at the current sheet formed during the CME or
flare eruption (e.g., Lin & Forbes 2000). The separation of these
flare ribbons has been used to estimate the electric field in the
reconnecting current sheet (e.g., Qiu et al. 2002; Asai et al. 2004)
and also the coronal magnetic field strength and the reconnection
rate (Isobe et al. 2002b, 2005).
The separation of the foot-point away from the neural line, together with the propagation of the loop (arcade) formations along the neutral line have also been observed by the Yohkoh/SXT (Isobe et al. 2002a). For an illustration of the terms separation and propagation in this context, see Fig. 1. Although their work was motivated by the search for an analogical phenomena to what is known as dawn-dusk asymmetry in magnetospheric substorms (e.g., Miyashita et al. 1999) (where kinetic effects of collision-less plasma play an important role), they attributed the origin of the propagation of the loop formation to the global asymmetry of the magnetic configuration.
Recently Grigis & Benz (2005) reported a RHESSI observation showing that the motions of the hard X-ray (HXR) sources do not show the separation from the neutral line, as expected from standard classical two-dimensional model (CSHKP, see also Priest & Forbes 2002; Lin 2004), but instead they move along the neutral line. Such apparent motions of loop formations and HXR sources are probably due to the successive magnetic reconnection along the coronal current sheet, and hence they provide information on how magnetic reconnection proceeds in three dimensions. Grigis & Benz (2005) proposed that such successive reconnection may occur if the filament/prominence erupts in a way that one end does not move while the other end starts to rise. However, to the best of our knowledge, the relationship between the filament/prominence eruptions and successive reconnection (propagation of brightening) has not so far been examined. Note that filaments and prominences are the same entities, one being seen on the disk in absorption and other on the limb in emission. The EIT observations provide a suitable data set for this kind of study because the EIT can observe both the dark filaments and the PEAs along with foot-point brightening, with full disk coverage and regular observations.
PEAs are very often observed by the EIT after the CME eruption and are found to be closely (92%) associated with CMEs observed by LASCO/C2 coronagraph. Tripathi et al. (2004) has provided a unique data-set of all the identified PEAs based on the observations made by EIT catalogue from 1997-2002. This can be accessed from (http://vizier.u-strasbg.fr/viz-bin/VizieR?-source=J/A+A/422/337). Based on this catalogue we identified 17 events associated with filament eruptions followed by the propagation of the brightening.
![\begin{figure}
\par\includegraphics[width=6cm,clip]{4993fg1.eps}\end{figure}](/articles/aa/full/2006/27/aa4993-06/img2.gif) |
Figure 1: Figure illustrating the definition of separation from the neutral line (polarity inversion line) and propagation along the neutral line of the brightness following the filament/prominence eruptions. |
| Open with DEXTER | |
In this paper we present EIT observations of the propagation of the brightening and loop formation following an eruption for several events. The criteria for the data selection and methods of analysis are provided in Sect. 2. A table summarizing all the relevant observations to the corresponding events is provided. We summarize our result in Sect. 3 followed by a brief discussion and conclusions in the Sect. 4.
The EIT on board SoHO observes the Sun in four different wavelengths namely 171 (Fe IX-X; 1.0 MK), 195 (Fe XII; 1.5 MK), 284 (Fe XV; 1.8 MK), and 304 (He II; 0.05 MK) Å. Apart from some specific observations, EIT records images with regular cadence of 12 min at 195 Å. For the other wavelengths, it has a cadence of about 6 h. Observations taken at 195 Å provide simultaneous information about closed field regions (e.g., active regions), filaments as well as open field regions e.g., coronal holes (e.g., Moses et al. 1997). For instrumental and operation details see Delaboudienere et al. (1995).
The formation of PEAs on the solar disk, following eruptions,
have often been observed by EIT at 195 Å. Tripathi et al. (2004)
have identified all the observed EUV PEA events at 195 Å from 1997
to 2002. Under the classical CSHKP scenario, the PEAs seen in EIT
are the cooled remnants of hotter loops which could be associated with
reconnection process. Being a potential disk tracer of the source
regions of coronal mass ejections (CMEs) on the solar disk (Tripathi
et al. 2004), these PEAs also provide a unique data set. They can be
used to perform many different studies such as the one presented in
this paper. Though this list contains many events (236) along with a tremendous amount of information (for details see, Tripathi et al. 2004; Tripathi 2005), in this study we only considered those
events when the heliographic length of the PEAs was greater than or
equal to
![]() and which were associated with an erupting
filaments. The lengths were taken into account because the longer the
event is, the less magnetically complex the region is, since the
diffused regions are quite long. Moreover, the time-scale of eruption
is longer making it feasible to observe with a time cadence of 12 min by the EIT. This selection therefore avoids any complications and doubts in the interpretation of the data.
and which were associated with an erupting
filaments. The lengths were taken into account because the longer the
event is, the less magnetically complex the region is, since the
diffused regions are quite long. Moreover, the time-scale of eruption
is longer making it feasible to observe with a time cadence of 12 min by the EIT. This selection therefore avoids any complications and doubts in the interpretation of the data.
Based on the above described criteria, we short listed 17 events in Table 1. Table 1 provides, from left to right, the date of observations of the PEAs, the time of observations at their maximum emission at 195 Å, heliographic locations of the middle point of the PEAs, the directions of propagation of the brightening and the speeds of propagation in km s-1. The speeds were measured by a linear fit to the relative propagated distance and time diagram as illustrated in the Fig. 3.
In these dataset, apparently two different motions - propagation and separation/expansion (hereinafter refer to separation) of brightening - are observed after the eruption (as illustrated in Fig. 1). Most of the events listed in Table 1 show both the motions. We first describe two events in detail: 17-Nov.-2000 and 12-Sep.-2000.
Table 1: Total number of events short-listed from the list published by Tripathi et al. (2004). The columns from left to right are: date of observation, time of observation (UT) at the arcades maximum emission at 195 Å heliographic location, direction of propagation of the brightening following the eruption and the speed of the propagation (km s-1) as measured from the EIT 195 Å absolute intensity images.
![\begin{figure}
\par\includegraphics[width=11cm,clip]{4993fg2.eps}\end{figure}](/articles/aa/full/2006/27/aa4993-06/img4.gif) |
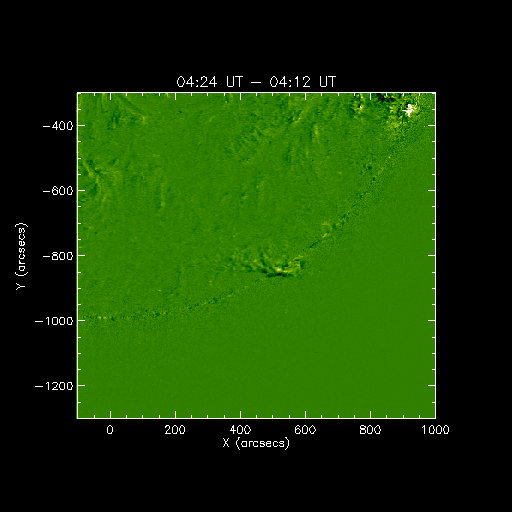
Figure 2: Series of absolute intensity ( top panel) and running difference ( bottom panel) images taken by EIT at 195 Å on 17-Nov.-2000. Asterisks in the top panel marks the features which were tracked in order to estimate the speed of the prominence. P1 and P2 in the bottom panel are the two end points of the prominence. (This figure is available in color in the electronic version.) |
| Open with DEXTER | |
A spectacular prominence was observed on 17-Nov.-2000. The prominence was located on heliographic position 48S 24W. It should be noted that the heliographic locations given here are the location of the middle point of the PEAs on the disk and are taken from the catalogue by Tripathi et al. (2004). Figure 2 displays a series of absolute intensity (top panel) and running difference images (bottom panel) taken by EIT at 195 Å respectively. The running difference images show the proper motion of features with bright and dark features.
Figure 2 clearly shows that the prominence eruption started from its west end. During the eruption the west end was lifted and moved toward southeast in the image, while the southeast end of the prominence kept fixed to the lower corona. We call this type of eruption an "asymmetric'' eruption (see the left panel of Fig. 6 for illustration). The first brightening was observed at 06:12 UT near the west end of the prominence. This brightening appeared as a dark spot in the running difference image (06:24-06:12) and marked "P1''. During the eruption no brightening was observed in the vicinity of P1, therefore P1 is probably connected to the west end of prominence but the brightening is not the result of the post eruption reconnection that forms the arcade and two-ribbons. The brightening that seems to be due to the post eruption reconnection first appeared at 06:24, which is marked as P2 in the middle right image (6:24-6:12) of the bottom panel in Fig. 2. The brightening continues to propagate in both directions (North-West and South-East) but predominantly towards the South-East following the motion of the prominence. Note that in this event, only the upper (northern) flare ribbon is seen.
| |
Figure 3: Height/distance versus time plot for the erupting prominence (asterisks) and propagation of the brightening (diamonds) for the event on 17-Nov.-2000. The height of the prominence is measured from the center of the solar disk by tracking a feature marked by asterisks in Fig. 2. The relative distance is measured in solar radii. The lines are linear fits to the data points. |
| Open with DEXTER | |
Figure 3 represents the height-time diagram (asterisks) for the erupting filament and distance-time diagram (diamonds) for the propagation of the brightening. The distance was measured by following the brightening in the absolute intensity images taken by EIT. The distance was measured in solar radii. The speed of the brightening propagation is about 24 km s-1. The height of the erupting filament was measured by tracking an identified feature on the filament labeled by asterisks in middle images of top panel in Fig. 3. The speed of the erupting prominence in the plane of the sky was about 22 km s-1.
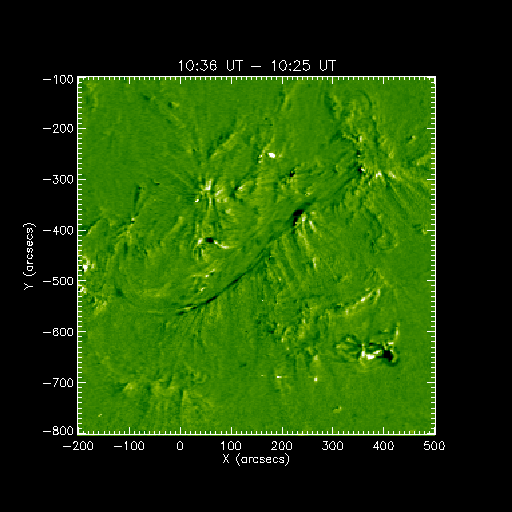
An erupting filament was observed on the disk at the location 19S 06W. Figure 4 displays the absolute intensity (top panel) and
running difference (bottom panel) images of the observations, taken by
EIT at 195 Å. The filament starts to erupt at around 10:36 UT, and
is more clearly seen at around 11:00 UT. The first brightening was
seen in the filament channel in running difference images for EIT at
around 10:36 UT. The brightening becomes clearly visible at around
11:24 UT when the filament has reached quite a height in the solar
corona. At around 11:24 UT, a bright streak is seen connecting the mid
point of the filament to the solar surface, interestingly also connecting
to the emerging magnetic flux seen in MDI (Michelson Doppler Images,
Scherrer et al. 1995). At around 11:36 UT, the brightening has
propagated along the two ribbons towards both the foot-points, starting
at the middle. However, the propagation of the brightening in the
upper ribbon is predominantly seen towards the southern foot-point,
and the brightening in the lower ribbon propagates towards the
northern foot-point. Though the propagation of the brightening is not
very evident in this case, this is a very good example of an event
showing both the propagation and separation of the brightening in the
EUV observations. The separation of the two ribbons has been observed
for this event at H![]() wavelengths and is discussed in detail
by Qiu et al. (2004).
wavelengths and is discussed in detail
by Qiu et al. (2004).
The brightening in the ribbons is seen very much earlier than the formation of the loops. The loop formation in EUV is first seen at around 11:36 UT, located in the middle of the neutral line where the first brightening was also located. The formation of loops also propagated towards both directions being predominant towards the north-west. Until 12:48 UT the loops are only seen over the upper part of the neutral line. Then they start to form over the lower part of the neutral line. At around 13:36 UT the complete PEA was formed. The features explained above are best seen in the movie2.gif. Movies are only available on the web.
The eruption of the prominence starts from the middle being co-spatial with an emerging bipole detected in the MDI magnetograms. The emerging bipole - located in the filament channel - was seen about three hours before the prominence eruption (Tripathi 2005). If a bipole is emerging in the filament channel before the eruption then it is very likely that it could trigger the eruption (Feynman & Martin 1995; Wang & Sheeley 2000; Chen & Shibata 2000; Lin et al. 2001). It seems plausible that this emerging bipole causes the symmetric prominence eruption.
We have studied the relationship between erupting filaments and the propagation of brightening, based on the observations made by the EIT at 195 Å. The main results are summarised as below.
![\begin{figure}
\par\includegraphics[width=9cm,clip]{4993fg4a.eps}\par\includegraphics[width=9cm,clip]{4993fg4b.eps}\end{figure}](/articles/aa/full/2006/27/aa4993-06/img6.gif) |
Figure 4: Series of absolute intensity images ( top panel) and running difference ( bottom panel) images taken by EIT at 195 Å on 12-Sep.-2000. (This figure is available in color in the electronic version.) |
| Open with DEXTER | |
The signature of successive magnetic reconnection along the neutral line has been reported as the propagation of the soft X-ray loop formation in giant arcade formation events (Isobe et al. 2002a) and the propagation of the hard X-ray source in a flare (Grigis & Benz 2005). Grigis & Benz (2005) proposed that the apparent propagation of the hard X-ray source observed by RHESSI is due to the asymmetric eruption of the filament, though they did not have any observations of the filament. The EIT observations presented in this paper clearly demonstrated that this is certainly the case. The propagation of the brightening along the ribbons was consistent with the motion of the filament. On the other hand, Grigis & Benz (2005) could not identify the separation of the hard X-ray sources, and concluded that it contradicted the prediction of the standard 2.5 dimensional models (e.g., Priest & Forbes 2002; Lin 2004). In most of the events presented in this paper we observed both propagation along the neutral line and separation away from the neutral line. We believe that the propagation can be explained by simple extension of the standard 2D model to 3D as illustrated in Fig. 6.
![\begin{figure}
\par\includegraphics[width=6cm,clip]{4993fg5.eps}
\end{figure}](/articles/aa/full/2006/27/aa4993-06/img7.gif) |
Figure 5: Height/distance versus time plot for the erupting prominence (asterisks) and distance time diagram for the propagating brightening (diamonds) for the event in 02-Mar.-02. The lines are linear fits to the data point. |
| Open with DEXTER | |
The reasons Grigis & Benz (2005) did not observe the separation in RHESSI is probably that the elementary reconnection process does not last long enough to be detected as a separation. In other words, the magnetic flux involved in the elementary reconnection is confined in a region smaller than the spatial resolution of RHESSI. It is also possible that reconnection continues, but particle acceleration is not strong enough in the later phase to produce the hard X-ray detectable by RHESSI possibly because the magnetic field becomes weak or the reconnection rate becomes small.
The speed of the propagation is 3-30 km s-1 in Isobe et al. (2002a) and 50-150 km s-1 in Grigis & Benz (2005). It seems that the propagation speed is correlated to (but smaller than) the Alfvén speed in the corona, because the giant arcade events reported in Isobe et al. (2002a) occurred in quiet region, while the event studied by Grigis & Benz (2005) is a flare in an active region. The speed of the propagation in our events ranges 20-111 km s-1, and we found that the speed of the brightening propagation was correlated to the speed of the erupting filament. This also supports the idea that the asymmetric eruption causes successive magnetic reconnection. It is worth noting that the observations and MHD simulations suggest that the reconnection is not the simple result of the eruption or vice versa, but both are dynamically coupled (e.g., Ohyama & Shibata 1997; Zhang et al. 2001; Shibata 1999; Chen & Shibata 2000). Detailed examination of the motion of asymmetrically erupting filaments and their relation to the reconnection signature such as chromospheric brightenings and hard X-ray/radio emissions would be interesting, though the cadence of EIT data is not sufficient for this purpose.
The foot-point brightenings were seen earlier than the post eruption
loops in EIT. This is because the foot-point is brightened immediately
after the energy deposition to the reconnected loop while there is a time lag for the loops to be appearing in EIT. This time lag is due to
the time needed to fill the loop with dense plasma by chromospheric
evaporation (Fisher et al. 1985; Yokoyama & Shibata 1998) and the
time needed to cool the hot plasma to EUV emitting temperatures
(Cargill et al. 1995; Warren et al. 2003). Based on the
observations for the event on 12-Sep.-2000, the estimated loop length
in the EUV images is about 6 ![]() 105 km measured at around 13:26 UT by
assuming that the distance between foot-points of the loops represents
the diameter of a circular loop. If we assume that the electron density
is of the order of 1010
105 km measured at around 13:26 UT by
assuming that the distance between foot-points of the loops represents
the diameter of a circular loop. If we assume that the electron density
is of the order of 1010
![]() then according to Svestka et al. (1987,
Eq. (3)) the time required for a loop to cool down - taking into
account both conductive and radiative cooling - from a temperature of 107 K to 106 K is about two hours, which is comparable with
the time difference between the appearance of the first brightening
(11:36 UT) and formation of loops (13:26 UT). The density 1010
then according to Svestka et al. (1987,
Eq. (3)) the time required for a loop to cool down - taking into
account both conductive and radiative cooling - from a temperature of 107 K to 106 K is about two hours, which is comparable with
the time difference between the appearance of the first brightening
(11:36 UT) and formation of loops (13:26 UT). The density 1010
![]() and the initial temperature of 107 K are just typical values in flares and hence the cooling time is a plausible but rough estimate.
and the initial temperature of 107 K are just typical values in flares and hence the cooling time is a plausible but rough estimate.
| |
Figure 6: Schematic diagrams showing asymmetric ( left panel) and symmetric ( right panel) eruption of the filament/prominence. The direction of propagation along and separation away from the polarity inversion line is marked by arrows. These figures are taken from Shiota et al. (2005) and have been modified. |
| Open with DEXTER | |
For one of the events on 06-Dec.-1997, the propagation of the loop formation was in the opposite to that of brightening propagation. In this event, the brightening was propagating from the higher magnetic field strength region to the lower. However the loop formation was propagating from lower to higher magnetic field strength region. This is probably due to the different amount of energy released during the reconnection. In the higher magnetic field region the energy released due to magnetic reconnection is larger than in the low magnetic field strength region. Therefore, when the loops were formed by post-eruption reconnection they are hotter in the stronger magnetic field regions than in the weaker magnetic field regions. Hence the cooling time for the loops to be seen at EUV wavelengths would be longer for the loops in stronger magnetic field regions than those in the weaker. The loops in the weaker magnetic field region cool down faster and are seen earlier and than those in stronger magnetic field region. Hence the apparent propagation in the loop formation appears to be inconsistent with other events.
What causes such symmetric and asymmetric eruptions is one of the most important issues to be addressed. For one of the events presented (12-Sep.-2000) which shows the symmetric eruption, we found an emerging bipole at the middle of the filament channel, which could explain why the eruption started at the middle. However for the other event (17-Nov.-2000) since it was near the limb we could not detect any magnetic signature based on the MDI data. We also checked the MDI magnetograms for other events in the Table 1 (see Tripathi 2005). We found that for some of the events, the magnetic activity like flux cancellation, bipole emergence etc are clearly seen at the location of start of the eruption. But in a few events (e.g., 04-Sep.-2000) the flux emergence was seen at the opposite foot-point to the one where the eruption starts. Since this is not the main focus of the paper and requires a more detailed study, we are reluctant to be conclusive about this point. A further detailed study on this subject is in progress (Chifor et al. 2006).
Observation and analysis of propagation and separation of brightening provide us with three-dimensional picture of magnetic reconnection. Based on our observations presented in this paper, we conclude that eruption and magnetic reconnection - propagation and separation of brightenings - are dynamically coupled phenomena.
Future mission such as Solar-B will provide observations at different coronal temperatures with better spatial and temporal resolution. Observations made by X-Ray Telescope (XRT) on board Solar-B combined with the loop cooling models will improve our understanding of the relationship between loopformation, energy release and the three-dimensional magnetic structure of solar flares and CMEs.
Acknowledgements
We would like to thank the referee Dr. Peter Cargill for his comments which improved the quality of the manuscript. D.T. and H.E.M. acknowledge the funding from PPARC. H.I. is supported by a Research Fellowship from the Japan Society for the Promotion of Science for Young Scientists. We thank the SoHO-EIT team for providing the data. SoHO is an international collaboration between ESA and NASA. Moreover, we would like to acknowledge the Castle, a pub in Cambridge, where the idea of this paper came up and developed.
 4993mv1.gif
 4993mv2.gif