A&A 445, 1165-1168 (2006)
DOI: 10.1051/0004-6361:20054152
H. Nilsson1 - G. Ljung1 - H. Lundberg2 - K. E. Nielsen3,4
1 - Atomic Astrophysics, Lund Observatory, Lund University, Box 43, 221 00 Lund, Sweden
2 -
Atomic Physics, Department of Physics, Lund Institute of Technology, Box 118, 221 00 Lund, Sweden
3 -
Catholic University of America, Washington, DC 20064, USA
4 -
Exploration of the Universe Division, Code 667, Goddard Space Flight Center, Greenbelt, MD 20771, USA
Received 5 September 2005 / Accepted 14 September 2005
Abstract
We report absolute oscillator strengths for 119 Cr II transitions in the wavelength region 2050-4850 Å. The transition probabilities have been derived by combining radiative lifetimes, measured with time-resolved laser induced fluorescence, and branching fractions from intensity calibrated Fouirer transform spectrometer data. New radiative lifetimes for the 3d4(5D)4p 4F, 4D and 6P terms are reported, adding up to a total of 25 energy levels with measured lifetimes used to derive this improved set of atomic data.
Key words: atomic data - line: identification
An investigation of the chemical composition of an astronomical object is dependent on the population distrubition within the atoms energy level systems and the transition probabilities of the studied spectral lines. To understand how the energy levels are populated knowledge of the local excitation conditions is needed. For well behaving stars most lines can be assumed to be formed in the interior of the photosphere under local thermodynamic equlibrium, i.e. the population obeys the Boltzmann and Saha distribution laws. With a known level population the reliability of the abundance analysis will be solely dependent on the accuracy of the atomic data. For more complex stellar atmospheres with inhomogenous abundance patterns, it is possible to probe the atmospheric conditions at different depths by using a large set of lines from different parts of the energy level system.
The purpose of this paper is to provide a complete set of wavelengths and oscillator strengths from the 25 lowest odd energy levels. We present oscillator strengths for 119 lines derived from line intensity ratios from Fourier transform (FT) spectra combined with lifetimes from time-resolved laser-induced fluorescence (LIF) measurements. Using the same technique previous experimental determinations of lifetimes for Cr II levels have been made by e.g. Schade et al. (1990), Pinnington et al. (1993) and Bergeson & Lawler (1993), whereas Engman et al. (1975) and Pinnington et al. (1973) used the beam-foil technique. Earlier experimentally determined transition probabilities in Cr II have been; Bergeson & Lawler (1993) combining branching fractions (BFs) and measured lifetimes; Spreger et al. (1994) using branching ratios combined with arc-emission intensities; Gonzalez et al. (1994) using a laser produced plasma to determine emission-line intensities; Musielok & Wujec (1979), Wujec & Weniger (1981) and Goly & Weniger (1980) using arc emission.
We present an improved, more complete set of data including new lifetimes for seven energy levels and accurately measured BFs for 119 Cr II transitions. For energy levels with no new lifetime measurements, data from Bergeson & Lawler (1993) and Schade et al. (1990) have been incorporated into the analysis.
The complex energy level system prevents a good description of the spectrum based on pure LS coupling, which is evident by the presence of intercombination lines in the spectrum. The contribution to the total BF from the intercombination lines is derived to be approximately 20% from the z6D
![]() ,
z6D
,
z6D
![]() and z6D
and z6D
![]() levels, but small (<1%) from z6D
levels, but small (<1%) from z6D
![]() and z6D
and z6D
![]() .
Strong intercombination lines, contributing as much as 50% to the total BF, are seen from z4P
.
Strong intercombination lines, contributing as much as 50% to the total BF, are seen from z4P![]() term, indicating level mixing beween z6D
term, indicating level mixing beween z6D![]() and z4P
and z4P![]() .
.
![\begin{figure}
\par\includegraphics[width=8.8cm,clip]{4152fig1.eps}
\end{figure}](/articles/aa/full/2006/03/aa4152-05/img17.gif) |
Figure 1: A partial level diagram of Cr II showing the levels investigated in this work. Left hand side shows the sextet levels and right hand the quartets. Since the LS-coupling in Cr II is not pure, intercombination lines are seen between the quartet and sextet systems. |
| Open with DEXTER | |
The oscillator strength, f, is related to the transition probability, A, according to,

The measured line intensity is dependent on the instrumental response, which needs to be established to calibrate the recorded spectra. The instrumental response function can be determined by using either individual carrier gas lines or an external continuous light source. In this analysis both these methods have been used to cover the whole observed spectral region. The internal calibration was utilized using accurately measured Ar II branching ratios from Whaling et al. (1993) and Hashiguchi & Hasikuni (1985) in the spectral region between 18 000-25 000 cm-1, while a calibrated continuous deuterium lamp was used to achieve the response function above 25 000 cm-1.
Strong lines to low energy states can be affected by self-absorption, i.e. photons can be re-absorbed in the high-density ion plasma. To investigate if the lines are subject for self-absorption the line intensities were measured under different plasma conditions. Interferograms with currents ranging between 100 and 600 mA (in steps of 100 mA) were recorded with a constant carrier gas pressure in the hollow cathode discharge lamp. The intensity ratios of spectral lines from the same upper level were plotted as a function of the current, where the slope of the graph shows the influence of self-absorption. Only the resonance lines were shown to be affected by self-absorption. To decrease the self-absorption in the resonance lines a small piece of chromium was put inside an iron cathode, thus decreasing the chromium density in the hollow cathode plasma. With this set-up no sign of self-absorption was observed.
The equivalent widths were measured in two different spectral regions, that had to be connected to set the intensity calibration on the same scale. By measuring many lines in the overlapping region (30 000-36 000 cm-1), a normalization factor was calculated based on the intensity ratio for the lines measured in both spectral region.
The BF is dependent of intensity measurements for all lines from the same upper level. If some lines are either too weak to be measured accurately or are transitions outside the recorded spectral interval the total intensity will be underestimated and give a too large BF. The BF residual was calculated using the Cowan code (Cowan 1981). Since the calculated BFs were considered to be in reasonable agreement with the experimental values, the Cowan code was assumed to give a satisfactory estimate of the residual.
Radiative lifetimes for ten levels, including three previously measured, have been obtained at Lund Laser Centre using time-resolved LIF. A plasma cone consisting of chromium atoms and ions was created by radiating pulses from Nd:YAG ablation laser onto a rotating chromium target located in a vacuum chamber. To produce the desired pumping wavelengths a Nd:YAG pumped dye-laser was used together with frequency doubling/tripling crystals in combination with a Stoke-shifting H2 cell. With this setup we could produce laser pulses to excite the ions by a single-step excitation from metastabile even states, to the target levels. The fluorescence from the levels was filtered with a 20 cm monochromator and detected by a photomultiplier tube. The time-resolved signal was averaged over 1024 pulses to increase the signal-to-noise ratio. In order to evaluate the lifetimes the LIF signal was fitted with a convolution of the recorded laser signal and an exponential decay curve. An average of 10-20 recordings were used to derive the lifetime for each level. For a comprehensive discussion of the LIF technique see Li et al. (2000).
 |
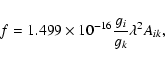
Figure 2:
Comparision between log gf-values from our work and the work of Bergeson & Lawler (1993). |
| Open with DEXTER | |
 |
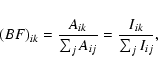
Figure 3:
Comparision between log gf-values from our work and the work of Gonzalez et al. (1994). |
| Open with DEXTER | |
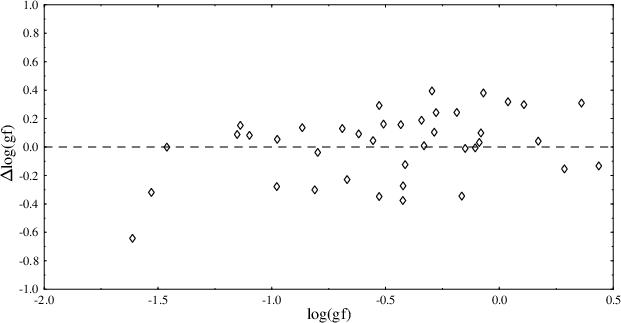 |
Figure 4:
Comparison between log(gf) values from our work and the work of Spreger et al. (1994). |
| Open with DEXTER | |
Information about the energy levels, observed transitions, measured BFs and calculated uncertainties are presented in Table 1. The levels investigated in this work, the wavelength of the observed fluorescence, the conversion scheme for the excitation laser and the measured radiative lifetimes determined are given in Table 2. Table 3 is a finding list where our results are sorted by air wavelength and compared to previous results.
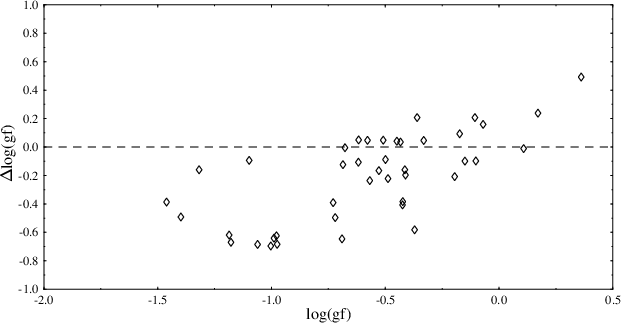 |
Figure 5:
Comparision between log gf-values from our work and the work of Musielok & Wujec (1979). |
| Open with DEXTER | |
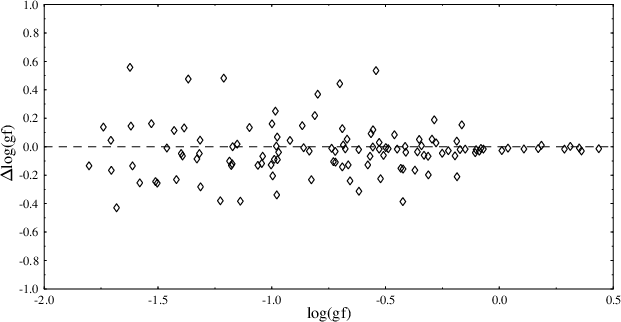 |
Figure 6:
Comparision between log gf-values from our work and Kurucz (1988). |
| Open with DEXTER | |
One case of wavelength coincidence of lines from different energy level combinations is observed. The transitions a6D
7/2 - z6D
![]() and a6D
9/2 - z6D
and a6D
9/2 - z6D
![]() differ by 0.03 cm-1 only, and cannot be resolved in our spectra. Theoretical branching fractions are used to derive oscillator strengths for those lines. The uncertainties of the blended lines are not given in Table 1. However, to estimate the uncertainties of the other lines in the same group the blended lines were included as residuals with an uncertainty of 50%. This is reflected by the large uncertainty of the other lines, spanning between 23 and 42%. The BFs and intensities of the unblended lines in the two groups were used to calculate the intencity of the blended lines and compared with the experimental feature in the spectra. This comparison agreed with in less then 10%, which imply that the uncertaities are overestimated.
differ by 0.03 cm-1 only, and cannot be resolved in our spectra. Theoretical branching fractions are used to derive oscillator strengths for those lines. The uncertainties of the blended lines are not given in Table 1. However, to estimate the uncertainties of the other lines in the same group the blended lines were included as residuals with an uncertainty of 50%. This is reflected by the large uncertainty of the other lines, spanning between 23 and 42%. The BFs and intensities of the unblended lines in the two groups were used to calculate the intencity of the blended lines and compared with the experimental feature in the spectra. This comparison agreed with in less then 10%, which imply that the uncertaities are overestimated.
The wavelengths reported in Tables 1-3 are Ritz wavelengths derived from energy levels from S. Johansson (unpublished), and available in the NIST compilation of the iron group elements (Sugar & Corliss 1985).
Acknowledgements
We greatfully acknowledge Professor S. Johansson for his support and for reading the manuscript and Professor U. Litzén for enlighting discussions.
Table 1: Cr II BFs and A-values. Transitions sorted by upper level.
Table 2: Measured radiative lifetimes for ten Cr II levels in the 3d4(5D)4p configuration.
Table 3: Cr II log gf-values. Lines sorted by wavelength.