A&A 442, 385-395 (2005)
DOI: 10.1051/0004-6361:20052779
Global solar Doppler velocity determination with the GOLF/SoHO instrument
R. A. García1,2 - S. Turck-Chièze1,2 - P. Boumier3 - J. M. Robillot4 - L. Bertello5 - J. Charra3 - H. Dzitko1 - A. H. Gabriel3 - S. J. Jiménez-Reyes6 - P. L. Pallé6 - C. Renaud7 - T. Roca Cortés6,8
- R. K. Ulrich5
1 - DSM/DAPNIA/Service d'Astrophysique, CEA/Saclay, 91191 Gif-sur-Yvette, France
2 - AIM, Unité Mixte de Recherche CEA, CNRS, Université Paris VII, UMR N 7158, France
3 - Institut d'Astrophysique Spatiale, CNRS/Université Paris XI, 91405 Orsay, France
4 - Observatoire de l'Université Bordeaux 1, BP 89, 33270 Floirac, France
5 - Department of Physics & Astronomy, UCLA, Los Angeles, CA 90095-1562, USA
6 - Instituto de Astrofísica de Canarias, 38205, La Laguna, Tenerife, Spain
7 - Observatoire de la Côte d'Azur, Lab. Cassini, CNRS URA1362, 06304 Nice, France
8 - Departamento de Astrofísica, Universidad de La Laguna, La Laguna, Tenerife, Spain
Received 28 January 2005 / Accepted 5 July 2005
Abstract
The Global Oscillation at Low Frequencies (GOLF) experiment is a resonant scattering spectrophotometer on board the Solar and Heliospheric Observatory (SoHO) mission, originally designed to measure the disk-integrated solar oscillations of the Sun. This instrument was designed in a relative photometric mode involving both wings of the neutral sodium doublet (D1 at  5896 and D2 at 5890 Å). However, a "one-wing'' photometric mode has been selected to ensure 100% continuity in the measurements after a problem in the polarization mechanisms. Thus the velocity is obtained from only two points on the same wing of the lines. This operating configuration imposes tighter constraints on the stability of the instrument with a higher sensitivity to instrumental variations. In this paper we discuss the evolution of the instrument during the last 8 years in space and the corrections applied to the measured counting rates due to known instrumental effects. We also describe a scaling procedure to obtain the variation of the Doppler velocity based on our knowledge of the sodium profile slope and we compare it to previous velocity estimations.
Key words: Sun: helioseismology - instrumentation: detectors
GOLF is one of the three helioseismic instruments on board the SoHO mission. It is a resonant scattering spectrophotometer that measures the integrated solar radiation at two points on the wing of the sodium doublet lines. The light coming from the solar sodium absorption line (half-width  500 mÅ) traverses a sodium vapour cell - placed in a longitudinal magnetic field of 5000 Gauss - which has an intrinsic (thermal) absorption line-width of the order of 25 mÅ, where it is absorbed and re-emitted in all directions. This scattered light is symmetrically split into its Zeeman components displaced around
  108 mÅ from the rest wavelength, allowing a measurement on either side on the wings of the solar absorption profile. The sodium cell is surrounded by a coil that changes the magnetic field 100 Gauss allowing the measurement of two different points on each wing (see Fig. 1). The scattered photons are collected by 2 photomultiplier tubes. Redundancy on both, the electronics and photomultipliers guarantee the long term efficiency of the detection subsystem. A complete description of the instrument can be found in Gabriel et al. (1995, 1997).
![\begin{figure}
\par\includegraphics[width=8cm]{2779f1.ps}\end{figure}](/articles/aa/full/2005/40/aa2779-05/Timg10.gif) |
Figure 1:
Diagram of the GOLF nominal working mode. The sunlight traverses a vapour cell containing a Na gas and placed inside a magnetic field that splits the measurements in both wings at 108 Å from the reference wavelength. |
| Open with DEXTER |
The main objective of GOLF is to study the low frequency part of the velocity power spectrum (

 Hz). To face this objective, GOLF was designed to have a very high stability and a very small instrumental noise. The detectors have been chosen to be limited by statistical photon noise. In its nominal configuration, for which the counting rate is
 photons/s, it reaches a 1 mm/s photon noise level after 28 days of integration. Due to a malfunction of the polarization subsystem that switches between the two wings of the sodium doublet, and to ensure a 100% of duty cycle, a single-wing working cycle was selected since April 11, 1996. However, this operating mode is much more sensitive to instrumental fluctuations. Thus, the raw counting rates measured by GOLF need to be corrected for some instrumental parameters
which were not a concern in the original working configuration. The nature of the measured one-wing signal remains a nearly pure velocity as demonstrated by Pallé et al. (1999), Renaud et al. (1999) and Thiery (2000).
photons/s, it reaches a 1 mm/s photon noise level after 28 days of integration. Due to a malfunction of the polarization subsystem that switches between the two wings of the sodium doublet, and to ensure a 100% of duty cycle, a single-wing working cycle was selected since April 11, 1996. However, this operating mode is much more sensitive to instrumental fluctuations. Thus, the raw counting rates measured by GOLF need to be corrected for some instrumental parameters
which were not a concern in the original working configuration. The nature of the measured one-wing signal remains a nearly pure velocity as demonstrated by Pallé et al. (1999), Renaud et al. (1999) and Thiery (2000).
In this paper we present the status of the GOLF instrument after more than 8 years of operations in space and the effects of the high energetic events on the hardware during the maximum of solar activity (Sect. 2). Sections 3 and 4 are dedicated to the corrections applied to the raw counting rates prior to scaling them into velocity measurements. The existence of a magnetic modulation that splits the measure in two different points on each side of the sodium wings allows a new velocity scaling procedure that is explained in Sect. 5. Section 6 is dedicated to a detailed study of the power spectrum and its evolution with time. Finally, we compare in Sect. 7 the blue- and red-wing velocity observations that have been alternatively used during the mission.
Since April 11, 1996 GOLF has been working in a single wing configuration. Three different periods can be distinguished: from April 1995 to June 25, 1998 GOLF has been observing on the blue wing of the sodium profile. After the SoHO recovery mission in September 1998 GOLF was restarted on the red wing up to November 18, 2002, when it was switched back to the blue-wing configuration.
About 700 commands were used during GOLF in-flight commissioning in 1995 and early 1996. During the following 5 years of observation only 420 commands were sent to the instrument, among which 252 were necessary on October 8-9, 1998 to re-initiate nominal observing conditions after SoHO deep freeze. Most of the other commands were issued to check GOLF detectors status and adjust their high voltage power supply. A few tens, such as On Board Time resetting, were emitted automatically by the SoHO central electronics toward the instrument in relation with spacecraft detected anomalies. All these 1140 commands were received, acknowledged and copied in GOLF telemetry without any problem. A number of commands were sent from IAS-MEDOC (Institut d'Astrophysique Spatiale-Multi Experiment Data Operation Center for SoHO) while in routine observation. However, a large majority of them were sent from GOLF ground support equipment housed by GSFC (Goddard Space Flight Center).
If one excludes the 1998 and early 1999 long SoHO spacecraft "vacations'' of respectively 106 and 33 days, plus a few - one day or less - losses of the Sun in GOLF field of view after SoHO gyros failure, almost no data have been lost due to instrument or ground segment problems. Observation was interrupted once for 48 h by GOLF central electronics processor double Hamming error that occurred in September 12, 1996. Thanks to duplication of GOLF on-board buffer, and more recently to SoHO Solid State Recorder sophisticated management, ground reception is nearly 100%. One also note that more than 95% of the data is available in near real time or in playback modes (2 reemissions of selected scientific data after 8 h and 16 h (Gabriel et al. 1995)). The duty cycle of the last velocity time series (2975 days up to June 2, 2004) is 93% (98% excluding the 1998 and 1999 long "vacation'' periods).
The GOLF detection chain has been designed to integrate the solar signal over 4 s, repeated every 5 s. This 5 s signal is triggered by the GOLF Local On Board Time (LOBT) which is being driven by the SoHO OBT (On Board Timer). This OBT is always maintained within 20 ms of TAI (Temps Atomique International). However, the GOLF temporal sampling suffered some small known shifts during its lifetime. The scaled velocity data set provided by the GOLF team is partially corrected for these delays. In order to avoid any sort of interpolation, which may affect the quality of the final series, the observational shifts for these segments have been rounded for analysis to multiples of 10 s (the actual one-wing velocity sampling). Table 1 summarizes the timing problems during the last 8 years. The first column is the date where a timing problem appears, the second is the number of seconds of the first block of this day (e.g. the first data block on April 11, 1996 corresponds to 00:00:30.0044), the third column is the delay comparing to the first point on April 11, 1996 and the last column is the residual delay after making the correction in multiples of 10 s.
Table 1:
Time delays (respect to April 11, 1996) on GOLF data. The TAI column represents the residual in seconds of the first block of each day. Thus, the first data block on April 11, 1996 corresponds to 00:00:30.0044. The third and fourth columns are the delays compared to the first point before and after correction in 10 s blocks.
![\begin{figure}
\par\includegraphics[width=8cm,clip]{2779f2.eps}\end{figure}](/articles/aa/full/2005/40/aa2779-05/Timg13.gif) |
Figure 2:
Time evolution of the phase difference between low-degree p modes simultaneously measured from GOLF and MDI instruments before correcting for the July 14, 2003 time lag ( right arrow). The re-synchronization made on February 8, 2002 is also visible ( left arrow). The vertical dashed lines correspond to the dates of the changes in the GOLF working cycle. |
| Open with DEXTER |
The delay experimented by GOLF on July 15, 2003 was a very particular one. SoHO suffered a warm start up causing the instruments LOBT to lag behind. In a warm start up recovery, after the spacecraft OBT is verified as correct, the OBT is distributed to each instrument to synchronize them up again. However GOLF ignores this OBT distribution except during a GOLF turn-on sequence (which was not the case). A phase comparison with other helioseismic instruments clearly shows this problem (Jiménez-Reyes et al. 2004). Figure 2 represents the time evolution of the phase difference between low-degree p modes in the range 2.4 to 3.4 mHz before correcting for July 2003 lag (using 100 days subseries shifted every 25 days). The phase shift between the blue- and red-wing measurements confirms previous results obtained by Pallé et al. (1999) and Thiery (2000).
A clear jump is seen on July 2003. The two points in between contain data before and after the timing problem. Also the re-synchronization made on February 8, 2002 (4.8584 s) is also visible. The result of the crossed analysis with MDI and also with the ground-based instrument MK-I (from the BiSON network) shows a delay of around -40 s with an accuracy of the order of 5 s. On April 26, 2004 GOLF was unintentionally turned off and was initialized for the second time to the SoHO OBT. Note also that the phase shift remains roughly constant in each wing ruling out a progressive intensity contamination of the velocity signal.
In June 2003 a problem was detected on the steering mechanism of the
SoHO high-gain antenna. This is used to keep the science data
telemetry stream flowing toward the Earth as SoHO orbits around the L1
point. A different low-rate antenna system is used for the housekeeping and safety data. It is less directional and thus allows a permanent contact with the satellite.
The beam from the high-gain antenna (of 14 degrees) was effectively increased to 25 degrees using still-functioning motors to allow longer periods of contact with SoHO. The current position of the antenna only limits communications during certain "key-holes'' periods (around 20 days) every three months.
Thanks to the ESA/NASA reconfiguration efforts and the 3 retransmissions from GOLF, the impact of this problem is now nearly negligible. In some of the key-holes (e.g. October 2003) no scientific data were lost by GOLF. In April 2004 only a few hours during a couple of days were affected (on the 29th and 30th).
High energy particles affect GOLF in different ways.
Data stored in buffer memories can be corrupted. The relative rate of error is the same in GOLF and SoHO solid state recorder. These errors are detected and for the most part corrected automatically.
Only one double hamming error was detected in GOLF on-board software, in September 1996. It triggered an instrument reboot that reset all observing parameters with the consequence of two days loss of nominal observation.
During the first five years of GOLF operations, 68 SEUs (Single Event Upsets) have been detected and corrected. During the first two years, 1996 and 1997, at solar activity minimum, a total of 36 were detected/corrected included 2 or 3 associated to a flare in early November 1997.
After these first two years the mean occurrence rate decreased to about 5 events per year. However, during the year 2000, three times more SEUs have been detected. They have been associated to solar activity: 3 events on June 11-19, 9 on July 14-15 "firecrackers'' day (see Fig. 3), and 3 more on November 9-10, 2000.
These SEUs are automatically corrected by the on-board software and have no impact on observation continuity.
Triggering CMEs (Coronal Mass Ejections) directed toward the Earth and SoHO clearly induce a small increase of GOLF detection system counting rate: 1 to 3% lasting up to one day. This was the case for July 14 and November 9, 2000 and April 15, 2001 events. Smaller and shorter counting rate increases were observed on June 6, around 15UT and November 26, 2000, at about 16 UT. Then in April 2, 9 and 10, 2001, without (yet) established solar activity correlation.
![\begin{figure}
\par\includegraphics[width=8cm,clip]{2779f3.ps}\end{figure}](/articles/aa/full/2005/40/aa2779-05/Timg14.gif) |
Figure 3:
Counting rate (automatically corrected of SEUs) of both GOLF photomultipliers for the low magnetic modulation starting on July 13, 2000 (plotted only 1 point every 100 s). |
| Open with DEXTER |
The transformation from the observed count rate to an intensity-like
variable suitable for a velocity scaling includes two major steps: firstly,
corrections to the raw measurements to remove instrumental
effects; and second, compensation for the Sun-spacecraft variable distance.
Corrections for instrumental effects include those applied to the photomultipliers,
such as dead time, ageing of the phototubes and high voltage perturbations,
as well as sodium cell stem, photocathodes, and filter temperature corrections.
We operate the two photomultipliers (hereafter PM1 and PM2) in a photon-counting mode. Each photo-electron from the cathode produces a burst of roughly
 electrons which are collected at the anode and counted by the instrument electronics. To calculate the number of incident photons we apply a dead time correction of 15 ns. This is the result
of two components added in quadrature: 10 ns due to the width of the anode pulse in the photomultiplier and 11 ns coming from the electronic response
(see also Robillot et al. 1998). These values have been obtained during pre-launch laboratory tests (Dzitko 1995).
electrons which are collected at the anode and counted by the instrument electronics. To calculate the number of incident photons we apply a dead time correction of 15 ns. This is the result
of two components added in quadrature: 10 ns due to the width of the anode pulse in the photomultiplier and 11 ns coming from the electronic response
(see also Robillot et al. 1998). These values have been obtained during pre-launch laboratory tests (Dzitko 1995).
The pulse generated at the anode flows through a preamplifier circuit having a resistance of 100  and a gain of 25. A typical voltage pulse height should thus be roughly 250 mV when the system is operating optimally (Fig. 4). Since the charge passing through the anode for each pulse is
 C, at a typical counting rate of
 s-1 the anode material will be able to maintain its maximum total charge between 300 and 1000 C, over a period of about 10 years. Consequently, we expect to find significant ageing effects throughout the operational lifetime of the system. The counting system includes the capability of measuring the pulse height distribution in order to monitor the ageing of the photomultiplier tubes.
![\begin{figure}
\par\includegraphics[width=8.8cm,clip]{2779f4.eps}
\end{figure}](/articles/aa/full/2005/40/aa2779-05/Timg19.gif) |
Figure 4:
GOLF PMs electron spectrum of the main channel
for October 20, 1997. The optimal counting rate for the PMs is reached when the average impulse amplitude is 250 mV. |
| Open with DEXTER |
Each photomultiplier tube subsystem has two different counting rate chains with different discriminator thresholds. The first chain counts all pulses over 40 mV and
provides  ,
the measured counting rate and the science data.
The second chain can be used either with a fixed threshold of 450 mV or with a variable threshold for the purpose of scanning the pulse height spectrum.
In normal operation, this chain is used in a fixed threshold mode
to detect fluctuations in the high voltage supply and to measure changes in the photomultiplier gain as a function of time as the tube ages. From time to time, special commands are sent to the GOLF instrument to use the variable threshold in the second chain. These are usually called spectral scans and they provide two quantities for each photomultiplier tube system:
,
the measured counting rate and the science data.
The second chain can be used either with a fixed threshold of 450 mV or with a variable threshold for the purpose of scanning the pulse height spectrum.
In normal operation, this chain is used in a fixed threshold mode
to detect fluctuations in the high voltage supply and to measure changes in the photomultiplier gain as a function of time as the tube ages. From time to time, special commands are sent to the GOLF instrument to use the variable threshold in the second chain. These are usually called spectral scans and they provide two quantities for each photomultiplier tube system:  ,
the mean pulse height voltage, and
,
the mean pulse height voltage, and
 ,
where C1 is the counting rate in the first energy channel and
,
where C1 is the counting rate in the first energy channel and  is the total counting rate. When the PM operates at
 mV we can calculate the change
 in
from the change
in
from the change
 in the counting rate using the following empirical law:
 |
(1) |
Due to the time evolution of the mean pulse height value ,
the parameters in
Eq. (1) need to be measured on a regular basis. Typically,
the ratio
increases with time as a result of infrequent readjustments of
the high voltage value. As an example,
from March to December 1996 this ratio increased from about 1.6% for both tubes to 2.6% for PM1 and 2.06% for PM2 (see values in Table 1 of Robillot et al. 1998). It is noteworthy that the PM2 ageing rate is about half that of PM1. This is partly due to the starting higher voltage of PM2 which was about 80 V greater than the value for PM1 (see Table 2).
In general, the value of
will decrease over time but if this value drops below 250 mV the result is a significant reduction in the counting
rate of the PMs (see Dzitko 1995, for further details). To compensate for this effect and to
keep the PMs operating at an optimal level, the high voltage of each PM
has been adjusted 5 times during the present duration of the GOLF mission.
Table 2:
Evolution of the mean pulse height of both PMs (in mV) and values of each change on the high voltages (in V). The added index 1 and 2 indicates the corresponding PM tube. The maximum voltage supported by each PM is 1200 V.
Some perturbations have been observed in the counting rate outputs, mostly from PM1,
which appear to be produced by fluctuations of the high voltage.
These perturbations are randomly distributed and rather small in amplitude (see Fig. 5). They are characterized by abrupt jumps in the photomultiplier's
counting rate which produce a discontinuity in the general trend of the signal that
can last from 5 to 10 days.
Occasionally, the jump is preceded by a shorter one (0.5 to 1.5 days) but with a higher amplitude.
These events have been removed by applying a low-order polynomial fit to the
discontinuity and a similar fit to a local non-perturbed region which includes
data before and after the discontinuity. The fit to the discontinuity is then
adjusted to match the unperturbed trend to assure smoothness across the jump.
![\begin{figure}
\par\includegraphics[width=7.5cm,clip]{2779f5.eps}
\end{figure}](/articles/aa/full/2005/40/aa2779-05/Timg30.gif) |
Figure 5:
Effects of the high voltage perturbation over the PM1 counting rate. PM2 has no such perturbations. The time axis origin is August 20, 2000. During this period, a SoHO off-pointing event was visible in both tubes. |
| Open with DEXTER |
Due to the orbital motion of the spacecraft, the measured counting rate
needs to be
corrected for the inverse square effect of the variable distance.
The inverse square distance correction is given by:
 |
(2) |
where r is the Sun-spacecraft radial distance, R0 is a reference distance, and
 is the corrected counting rate. For R0 we adopt the
Sun-spacecraft distance at the time, April 11, 1996,
when the GOLF instrument began operating on a single-wing configuration.
is the corrected counting rate. For R0 we adopt the
Sun-spacecraft distance at the time, April 11, 1996,
when the GOLF instrument began operating on a single-wing configuration.
The one-wing photometric configuration has higher sensitivity to temperature variations than the nominal working mode. Figure 6 shows the temperature time evolution of two GOLF major subsystems: the resonance cell stem and the two photocathodes. After more than 8 years in space the temperatures have smoothly increased by 3 degrees. The noticeable 1-year period
modulation shown in Fig. 6 is produced by the orbital motion of the
spacecraft around the Sun.
![\begin{figure}
\par {\includegraphics[angle=90,width=8cm,clip]{2779f6.ps} }
\end{figure}](/articles/aa/full/2005/40/aa2779-05/Timg33.gif) |
Figure 6:
Time evolution of the GOLF resonance cell stem temperature ( top)
and the two photocathodes temperatures ( bottom. Black for PM1 and light gray for PM2).
The time scale starts on April 11, 1996. |
| Open with DEXTER |
The temperature of the sodium cell stem determines the density of scattering atoms which redirect the sunlight into the optical paths leading to the photomultiplier tubes. Consequently, the one-wing observations are influenced by the variations in the stem temperature and a correction must be applied to the detected counting rates to compensate for this effect.
A platinum temperature probe is mounted near the cell stem.
This sensor has a precision of 0.01
 C. The output of this sensor is recorded every 5 s and the rms variation in the output is 0.015
C. During two days, starting on January 16, 1996, a slow temperature scan of the resonance cell was carried out to determine the sensitivity of the scattered light signal to the temperature (see Fig. 7). The result has been fitted to a second order polynomial in T of the form:
C. The output of this sensor is recorded every 5 s and the rms variation in the output is 0.015
C. During two days, starting on January 16, 1996, a slow temperature scan of the resonance cell was carried out to determine the sensitivity of the scattered light signal to the temperature (see Fig. 7). The result has been fitted to a second order polynomial in T of the form:
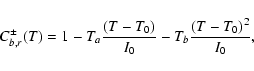 |
(3) |
where T0 is a reference temperature, here taken to be 171
C, and I0 is the counting rate at T = T0.
To apply the correction for the stem temperature the signal must then be multiplied by
the factor
 .
The fitting coefficients, Ta and Tb, derived from the slow temperature scan depend on the range of the fitted temperature. The coefficients shown in Table 3 are derived using data from January 17, 1996 with the temperature ranging between 170.82
C and 177.72
C. The dead-time correction is applied prior to carrying out the stem temperature correction.
Due to the limited precision of the temperature measurements a low-pass filter with a cut-off ranging from 1 to 1.5 days has been used to smooth the temperature data.
.
The fitting coefficients, Ta and Tb, derived from the slow temperature scan depend on the range of the fitted temperature. The coefficients shown in Table 3 are derived using data from January 17, 1996 with the temperature ranging between 170.82
C and 177.72
C. The dead-time correction is applied prior to carrying out the stem temperature correction.
Due to the limited precision of the temperature measurements a low-pass filter with a cut-off ranging from 1 to 1.5 days has been used to smooth the temperature data.
![\begin{figure}
\par {\includegraphics[angle=90,width=8cm,clip]{2779f7.ps} }
\end{figure}](/articles/aa/full/2005/40/aa2779-05/Timg36.gif) |
Figure 7:
Resonance cell stem temperature scan of January 17, 1996 for the PM1 in the four points of the sodium profile. The reference temperature is 171
C. |
| Open with DEXTER |
Table 3:
Fitted coefficients obtained after adjusting the stem temperature scans. Ta is given in 105
 and Tb is in 103
 .
The signal is indicated by I, where the subscripts b and r denote
the blue and red wing selection while the superscripts + and - refer to the
modulation state of the magnetic field.
.
The signal is indicated by I, where the subscripts b and r denote
the blue and red wing selection while the superscripts + and - refer to the
modulation state of the magnetic field.
We have also checked that the resultant relative coefficients are the same for both magnetic modulation states. We have also verified, by using a GOLF resonance model (Boumier 1991; Boumier & Damé 1993), that the relative correction is quasi independent of the position of the operating point over the solar sodium profile.
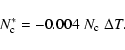
Unfortunately, after changing back to the blue-wing configuration in November 2002, the stem temperature correction (3) appears to introduce an extra modulation to the final velocity residuals. For this reason, we have decided to remove this correction from the pipeline of the new blue-wing data. To properly derive the new correction coefficients, a new scan of the stem temperatures should be performed. This would require, however, interrupting the scientific measurements and increased dedicated telemetry. At this time, the GOLF consortium has not yet taken a decision on this matter.
The photocathodes used on the GOLF experiment are of the trialkali type (Na-K-Sb-Cs) and are sensitive to temperature variations. The response coefficient given by the constructor, Hamamatsu, is
 /
C and this value has been confirmed by laboratory tests (Dzitko 1995). To measure the PM temperature we use installed thermocouples around the photo-cathode. These sensors have a precision of 0.01
C in the range 15 to 35
C. A correction for this effect can be applied by using the following equation:
/
C and this value has been confirmed by laboratory tests (Dzitko 1995). To measure the PM temperature we use installed thermocouples around the photo-cathode. These sensors have a precision of 0.01
C in the range 15 to 35
C. A correction for this effect can be applied by using the following equation:
 |
(4) |
As for the stem temperature measurements,
a low-pass filter with a cut-off ranging from 1 to 1.5 days was applied to the
photo-cathode temperature data to provide a smooth correction.
Using the January 23, 1996, calibration scan we can estimate the variation of the intensity
with filter temperature. We found, however, no relationship between the counting rate and the filter temperature on a short time scale. On a 2 degree scan, the counting fluctuation is within the noise level.
Ageing sodium optical filters used on ground seismology instruments are known to have their bandpass shift progressively toward the blue, which can cause an increased attenuation of the D1 sodium line (Grec et al. 1991). This effect is usually compensated by increasing the temperature of the filter. The GOLF filter temperature was progressively increased (20 steps of 1 h) on May 17-18, 2001, from 20
C up to about 27
C without changing the detectors counting rate by more than 1%.
On May 18, 2001, the heating power was returned to the previous level and the filter re-stabilized at 20
C.
On May 22, the filter heating was reduced to almost zero and its temperature decreased down to 14
C. On May 23, the cell stem temperature, which had decreased by a fraction of a degree, was returned to its nominal 172.1
C. Because the overall effect on the instrument counting rates was found to be marginally detectable, the correction for the filter temperature is not applied to the data.
Figure  shows the resultant counting rate after the application of the corrections to the PM2 channel as described in the previous sections. Following Ulrich et al. (2000) we have used the notation P+ or P- for the corrected measured intensities.
![\begin{figure}
\par {\includegraphics[angle=90,width=8.4cm,clip]{2779f8.ps} }
\end{figure}](/articles/aa/full/2005/40/aa2779-05/Timg40.gif) |
Figure 8:
Corrected photometric rates P+ and P- starting on April 11, 1996 and up to June 2, 2004. |
| Open with DEXTER |
Since the beginning of the mission we have lost 76% of the original
 c/s counting-rate level. During the first 6 months of operations a quasi-exponential decrease in the counting rate is clearly visible. Since then, we have lost on average 9.5% of counts every year. In June 2004 we reach a level of
 c/s. It is important to note that two unused PMs are available in the redundant channel. These PMs were tested at the very beginning of the mission (January 1996) to verify their
functionality. These unused PMs could be used to replace the old photomultipliers
when the photon noise will compromise the scientific objectives. This change would impose a break in the continuity of the scientific measurements in order to characterize their performances and their responses to the temperature fluctuations.
c/s. It is important to note that two unused PMs are available in the redundant channel. These PMs were tested at the very beginning of the mission (January 1996) to verify their
functionality. These unused PMs could be used to replace the old photomultipliers
when the photon noise will compromise the scientific objectives. This change would impose a break in the continuity of the scientific measurements in order to characterize their performances and their responses to the temperature fluctuations.
![\begin{figure}
\par {\includegraphics[angle=90,width=8.5cm]{2779f9.ps} }
\end{figure}](/articles/aa/full/2005/40/aa2779-05/Timg43.gif) |
Figure 9:
Example of 72 days of GOLF PM1 counting rates against PM2 for I- in arbitrary units before ( top figure) and after ( bottom figure) applying all the corrections and scaling it into velocity (m/s). |
| Open with DEXTER |
Figure
 shows counting rates for 72 days at the beginning of the red-wing period (only plotting one point every 80 s) before and after applying all the corrections.
The raw intensities are noisier and have larger scatter of points (mainly due to the PM1 high voltage perturbations) than the processed ones.
shows counting rates for 72 days at the beginning of the red-wing period (only plotting one point every 80 s) before and after applying all the corrections.
The raw intensities are noisier and have larger scatter of points (mainly due to the PM1 high voltage perturbations) than the processed ones.
The loss of two-wing measurements on the sodium profile induced us to develop new methods to extract the solar velocity from the raw photometric signals.
One approach is to use the signal in the absolute photometric mode as described by Ulrich et al. (2000). Here, we describe another method based on a ratio of the two magnetic modulated measured intensity channels. This method was originally outlined in García (1996) and applied to the blue-wing signal in Ulrich et al. (1998). Since then, it has been usually called the X method.
Table 4:
Fitted parameters to scale the measured intensities into line-of-sight global velocities. The ``New Blue''
coefficients correspond to the calibration of the blue wing time series after November 19, 2002.
A valuable denominator is the slope of the sodium profile defined as: (P+ - P-), which removes most of the multiplicative effects and perturbations. However,
to reduce the noise produced by the small wavelength offset (4  ),
a low-pass filter, with a cut-off at 1.5 days (7.7 Hz),
has been applied to this denominator.
Therefore, for each PM we define a ratio X (García 1996; Ulrich et al. 1998)
of the form:
),
a low-pass filter, with a cut-off at 1.5 days (7.7 Hz),
has been applied to this denominator.
Therefore, for each PM we define a ratio X (García 1996; Ulrich et al. 1998)
of the form:
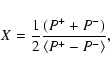 |
(5) |
where the angle bracket notation indicates a filtered quantity.
![\begin{figure}
\par {\includegraphics[angle=90,width=8.2cm,clip]{2779f10.ps} }
\end{figure}](/articles/aa/full/2005/40/aa2779-05/Timg50.gif) |
Figure 10:
X magnitude (see text) as a function of time (starting April 11, 1996) in the top and as a function of the radial component of the orbital velocity in the bottom. The dashed lines in both panels describe the ideal linear response of the system to this radial orbital velocity. |
| Open with DEXTER |
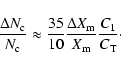
Because the slope reacts to changes in the solar spectral line profiles, this parameter is sensitive to the active regions passing through the visible solar limb. This effect, however, is more important at very low frequencies, well below the p- or g-modes region of interest (see Ulrich et al. 2000).
Figure 10 shows the behaviour of X as a function of time (top panel),
and radial component of the spacecraft orbital velocity (bottom) for
PM2. The dependence of X on the orbital motion is clearly visible, with the main differences concentrated around the epochs when the orbital velocity is maximum. These differences are mainly due to the non linear response of GOLF as the working points over the sodium solar profile change with the velocity. This effect is more accentuated in the red-wing segment as the GOLF measurement points are placed in the bottom of the sodium solar lines.
A similar problem has already been studied on the earth-based instruments (Pallé et al. 1993) and can be corrected by linearizing X as a function of the orbit. Using a non linear fitting to the following model:
 |
(6) |
we obtain directly the linearizing coefficients ( and
and  ), a (the X where
 is zero) and the coefficient of calibration in velocity (Vo=1/b). The orbital velocity considered here includes the theoretical gravitational red-shift term of 636 m/s.
The expansion of the linearizing factor
 was stopped at the 4th power of the velocity because of its accuracy to model the central part of the solar lines where the GOLF working points are located (Pallé et al. 1993).
![\begin{figure}
\par\includegraphics[angle=90,width=7.8cm]{2779f11.ps}\end{figure}](/articles/aa/full/2005/40/aa2779-05/Timg54.gif) |
Figure 11:
Velocity residuals as a function of time for PM2 ( top), and after
removing a low-frequency trend ( bottom). The signals have been
undersampled to 2 h for display purposes only. |
| Open with DEXTER |
The fitted parameters are listed in Table 4. In the red-wing configuration b is negative, to take into account the reverse of the sign in response to the Doppler shift. The difference of 1% between the calibration coefficients of both phototubes is a consequence of the different absolute level of the counting rate
averaged over the entire period of time
(see Fig. 3). As described before, the new blue-wing data has no stem temperature correction applied. Therefore, the calibration coefficients are different from those of the first blue-wing period.
The oscillation residuals can be obtained directly from:
![\begin{displaymath}V_{X}=\frac{1}{b} \cdot \left[ X \cdot (1 + \alpha V_{\rm orb}^2 + \beta V_{\rm orb}^4)-a \right] -V_{\rm orb} .
\end{displaymath}](/articles/aa/full/2005/40/aa2779-05/img55.gif) |
(7) |
The velocity residual (Fig.
 )
is obtained by substituting the fitted coefficients in Eq. (
)
is obtained by substituting the fitted coefficients in Eq. (
 ). The velocity is characterized by a very long period trend (60 days) of an instrumental origin and by the influence of active regions crossing through the visible solar disk (13 days). Robillot et al. (1993a) have shown that active regions change the Na line profile (being wider and less deep). Thus GOLF measures a different averaged solar disk-integrated velocity as a function of the number and the position of these active regions. The low-frequency instrumental trend is explained because the instrument is no longer as stable as it was at the beginning of the mission (the amplitude of the modulation increases with time). Therefore, for the same orbital velocity the GOLF response is different and should be corrected. Several subsystems can be contributing to that (the entrance filter, the coils around the sodium cell, the magnet ...). Unfortunately the lack of housekeeping data for some of these subsystems does not allow a deeper analysis.
![\begin{figure}
\par\includegraphics[angle=90,width=8cm]{2779f12.ps}\end{figure}](/articles/aa/full/2005/40/aa2779-05/Timg58.gif) |
Figure 12:
Three samples of one hour long time series from the VX ( top and middle panels) and the VS ( bottom panel) GOLF signal. The VS is the calibrated velocity for PM2 following Ulrich et al. (2000). |
| Open with DEXTER |
![\begin{figure}
\par {\includegraphics[angle=90,width=12cm]{2779f13.ps} }
\end{figure}](/articles/aa/full/2005/40/aa2779-05/Timg59.gif) |
Figure 13:
From top to bottom: time evolution of the MPSI (Magnetic Plage Strength Index), the sum of the SoHO orbital velocity and the gravitational red shift velocity in km s-1, the photon noise, the low-order p-modes region (from 0.9 to 1.2 mHz) called #1 and the high-order g-modes region (from 150 to 350 Hz) called #2 (the last three variables in units of
 ). The photon noise level has been subtracted in these two last regions. ). The photon noise level has been subtracted in these two last regions. |
| Open with DEXTER |
The low-frequency instrumental component of the velocity residuals (periods above 60 days) can be removed by fitting - independently for the blue and the red period - a function of the type
 to the linearized residuals X'. In other words, after fitting Eq. (6) we compute
 and we fit this new quantity to f(t). Once this is done we calculate
 and this time we fit Eq. (6) using X*. The result is the residual shown
in the bottom panel of Fig. 11.
and this time we fit Eq. (6) using X*. The result is the residual shown
in the bottom panel of Fig. 11.
Figure 12 shows a one-hour long section from the VX calibrated time series, for both PMs, and the
corresponding section from the VS calibrated time series for PM2 (Ulrich et al. 2000). Between both PMs and the same calibration system, there are some differences due to the photon noise. However, there is full agreement between VX and VS for the same PM. The tiny differences are well within the photon noise level. In fact, the rms of the difference between the velocity derived for each PM using the VX calibration is 0.90 m/s while the rms of the difference between the same PM but different calibration method is 0.11 m/s. The difference due to the photon noise is larger than the difference between the velocity calibration methods (in the frequency range of p and g modes). The main differences appear only at low frequency (
 Hz) due to an amplification of the active regions effect on the VX data (see Ulrich et al. 1998, 2000).
GOLF has been working for more than 3000 days, a period of time that allows a detailed study of the temporal evolution of its power spectrum. For that purpose we use three main quantities: the photon noise level, the average power between 0.9 and 1.2 mHz (called region #1) and the average power between 150 and 350 Hz (called region #2). The photon noise level dominates the power spectrum at very high frequency (above 12 mHz). Region #1 represents the granulation noise and the region where low-order p modes are being searched. Region #2 represents the supergranulation noise and the place where the low-order g modes are expected (Gabriel et al. 2002; Turck-Chièze et al. 2004a,b). Figure 13 shows these three quantities computed using 100-day segments shifted every 25 days as well as two other quantities: the MPSI (Magnetic Plage Strength Index, developed by Chapman & Boyden 1986; Ulrich 1991; and Parker et al. 1998) as a proxy for the magnetic activity and the sum of the radial component of the orbital velocity and the gravitational red shift (
 km s-1).
![\begin{figure}
\par\includegraphics[width=7.8cm,clip]{2779f14.eps}\end{figure}](/articles/aa/full/2005/40/aa2779-05/Timg65.gif) |
Figure 14:
First ( top) and last ( bottom) 100-day PSD (in black) of GOLF velocity measurements (in
units). An estimator of the detector chain noise is computed by subtracting the signal of both PMs (see text). |
| Open with DEXTER |
![\begin{figure}
\par\mbox{\includegraphics[width=8.cm]{2779f15a.ps}\qquad
\includegraphics[width=8.3cm]{2779f15b.ps} }
\end{figure}](/articles/aa/full/2005/40/aa2779-05/Timg66.gif) |
Figure 15:
Left: comparison of the blue- and red-wing power spectrum measured using the first 74 days of GOLF data. Right: evolution with time of the integrated p-mode power between 2.4 and 3.4 mHz using 100-day series shifted every 25 d. See the text for details. |
| Open with DEXTER |
The photon noise level increases smoothly with time due to the normal ageing of the instrument (mainly the PMs, see Fig. 14). At the present time we have lost a factor 4.5 in the counting rates (as discussed in previous sections). A one-year modulation is also visible due to the orbital motion which produces a displacement of the observation height in the solar atmosphere. This one-year modulation has an opposite phase between the blue and the red wings. The blue wing is directly correlated and the red is anti-correlated with
 .
A similar behaviour is found in regions #1 & #2, with a bigger amplitude modulation in the red wing than in the blue one. This is particularly evident in the g-mode band, where the orbital modulation almost disappears in the blue wing while is dominant in the red. We also notice that when
.
A similar behaviour is found in regions #1 & #2, with a bigger amplitude modulation in the red wing than in the blue one. This is particularly evident in the g-mode band, where the orbital modulation almost disappears in the blue wing while is dominant in the red. We also notice that when
 is minimum, 0.1 km s-1, the observed averaged power is of the same order (nearly same observing height). In 2004, due to the increase of the photon noise, region #1 is only a factor 3.5 above this level while it was above by a factor 8 at the beginning of the mission. For region #2 the evolution with time is of the same order but we are still a factor 12 above the photon-noise level. This is particularly important for the search of low-order p modes around 1 mHz, which is the current frequency limit for unambiguously detected acoustic modes (García et al. 2004a,c). However, there is still an increase of noise in this region. This degradation is particularly visible at low frequency of the detector-chain noise estimation plotted in Fig. 14 (light curves). The black curves are the 100-day PSD of the first (top) and last (bottom) of the GOLF blue-wing measurements. The detector-chain noise has been computed by subtracting the signal of both PMs. Thus, the common signal view by both PMs is removed (solar contribution) while the PM differences are enhanced. At high frequency they are dominated by the photon noise. At low frequency the noise has increased smoothly since the beginning of the mission and it is clearly visible in the bottom panel. It is probably due to the ageing of the PM electronics and maybe to the ageing of other subsystems that can modify the view of each PM.
Finally, no dependence on the solar cycle is visible in the three regions of the GOLF power spectrum studied here.
This is consistent with the result by Jiménez-Reyes et al. (2003) that
the solar cycle effects are very small compared to the change in the observing height in the solar atmosphere due to the radial orbit velocity.
Only the first 74 days of GOLF observations - starting January 19, 1996 - have been obtained in the nominal configuration (i.e. using, at the same time, both wings of the sodium D lines). These data are extremely important to understand the one-wing working cycle used during the remainder of the mission and to estimate the potential of GOLF-type instruments for future experiments.
We have applied the same one-wing calibration method developed in Sect. 5 to the two-wing data. Differences on the power spectrum for the red- and the blue-wing velocities have been found in both background and p-mode signature (see Fig. 15, left). The difference is maximum around the acoustic cut-off frequency at 5.5 mHz. Above this frequency the ratio between both wings is slightly bigger than one because this is the region dominated by the photon noise and the blue counting rate is higher than the red. At lower frequencies, below 2 mHz, the power spectrum is dominated by the convective motions (mainly granulation) and it seems to be more important in the blue- than in the red-wing configuration (see Fig. 15, left). The analysis of the  ,
1 p-mode amplitudes between 1.8 mHz and 4 mHz shows an excess in the mode amplitudes of the blue wing following the same trend (García et al. 2004b). A similar behaviour was already observed by Gelly et al. (2002) on the GOLF data using blue- and red-wing data for different periods of time and by Robillot (2000) using the MR5 (Magnetic Resonance with 5 channels) instrument installed at the Bordeaux observatory (Robillot et al. 1993a,b). In the case of the MR5, an average excess of 1.85 in the oscillatory part of the blue wing over the red one was found, which is in good agreement with our results.
,
1 p-mode amplitudes between 1.8 mHz and 4 mHz shows an excess in the mode amplitudes of the blue wing following the same trend (García et al. 2004b). A similar behaviour was already observed by Gelly et al. (2002) on the GOLF data using blue- and red-wing data for different periods of time and by Robillot (2000) using the MR5 (Magnetic Resonance with 5 channels) instrument installed at the Bordeaux observatory (Robillot et al. 1993a,b). In the case of the MR5, an average excess of 1.85 in the oscillatory part of the blue wing over the red one was found, which is in good agreement with our results.
The right side of Fig. 15 shows the integrated power of the modes
 between 2.4 and 3.4 mHz computed from 100-day time series shifted every 25 days (see the appendix on Jiménez-Reyes et al. 2003 for further details on the way the 100-day subseries are computed to avoid the activity cycle effects).
The integrated p-mode power in this band shows a strong temporal variation
being in anti-phase with the orbital velocity, indicated by a continuous line in the figure (for both blue- and red-wings data, the maximum of
corresponds to a minimum in the p-mode power).
The range of variability in integrated power is significantly larger in the red wing data (25%)
than it is during the blue wing period (15%).
between 2.4 and 3.4 mHz computed from 100-day time series shifted every 25 days (see the appendix on Jiménez-Reyes et al. 2003 for further details on the way the 100-day subseries are computed to avoid the activity cycle effects).
The integrated p-mode power in this band shows a strong temporal variation
being in anti-phase with the orbital velocity, indicated by a continuous line in the figure (for both blue- and red-wings data, the maximum of
corresponds to a minimum in the p-mode power).
The range of variability in integrated power is significantly larger in the red wing data (25%)
than it is during the blue wing period (15%).
In this paper we have described the corrections applied to the raw-photometric signals measured since April 11, 1996 using the GOLF
one-wing operating mode. This calibration procedure removes instrumental effects that otherwise could find their way through the velocity and be interpreted as real solar velocity fields. They include those corrections applied to the photomultipliers, such as dead time, ageing of the phototubes and high voltage perturbations,
as well as sodium cell stem, photocathodes, and filter temperature corrections. A compensation for the Sun-spacecraft variable distance was also performed.
We have verified the validity of these corrections during the last 8 years and we have removed the cell stem temperature correction after changing back to the blue-wing configuration (November 2002) due to an over-estimation of the correction coefficients. The impact of some SoHO problems like the one in the high gain antenna have been analyzed and their influence on the data acquisition discussed. A detailed description of the GOLF timing is included explaining carefully the different timing shifts of the data segments during the last 8 years.
We have also fully described a velocity scaling method based on a ratio of signals that uses the slope of the measured sodium solar profile as a valuable denominator, so that most of the residual instrumental effects only enter as second order corrections. The comparison with an other GOLF velocity scaling method has been proved to be very valuable.
The temporal evolution of the power spectrum has also been discussed. After more than 3000 days GOLF has lost a factor 4.5 in the counting rates. This has a non negligible impact on the search for low-order p-mode below 1 mHz, as the photon-noise level is only a factor 3.5 less than the background level. The situation is much better on the g-mode region where the background level is still a factor 12 above the photon noise. When it is considered necessary the situation might be partially corrected by changing to the PMs redundant channel.
Acknowledgements
The GOLF experiment is based upon a consortium of institutes (IAS, CEA/Saclay, Nice and Bordeaux Observatories from France, and IAC from Spain) involving a large number of scientists and engineers, as enumerated in Gabriel
et al. (1995). SoHO is a mission of international cooperation between ESA and NASA. The authors want to thank J. Ballot (CNES/GOLF research engineer at CEA-Saclay) for his work on the new blue-wing data.
- Boumier, P. 1991, Ph.D.
Thesis, University of Paris VII, Paris, France
(In the text)
- Boumier, P., &
Damé, L. 1993, Exp. Astron., 4, 87 [NASA ADS] [CrossRef] (In the text)
- Chapman, G. A., &
Boyden, J. E. 1986, ApJ, 302, L71 [NASA ADS] [CrossRef] (In the text)
- Dzitko, H. 1995, Ph.D.
Thesis, University of Paris XI, Orsay, France
(In the text)
- Gabriel, A. H., Grec, G.,
Charra, J., et al. 1995, Sol. Phys., 162, 61 [NASA ADS] [CrossRef] (In the text)
- Gabriel, A. H., Charra,
J., Grec, G., et al. 1997, Sol. Phys., 175, 207 [NASA ADS] [CrossRef] (In the text)
- Gabriel, A. H., Baudin,
F., Boumier, P., et al. 2002, A&A, 390, 1119 [EDP Sciences] [NASA ADS] [CrossRef] (In the text)
- García, R. A. 1996,
Ph.D. Thesis, University of La Laguna, Tenerife, Spain
(In the text)
- García, R. A.,
Jiménez-Reyes, S. J., Turck-Chièze, S., & Henney, C.
J. 2004a, in SOHO 14/GONG 2004 Workshop, Helio- and
Asteroseismology: Towards a golden future, ESA SP-559, 436
(In the text)
- García, R. A.,
Jiménez-Reyes, S. J., Turck-Chièze, S., & Mathur, S.
2004b, in SOHO 14/GONG 2004 Workshop, Helio- and Asteroseismology:
Towards a golden future, ESA SP-559, 432
(In the text)
- García, R. A.,
Corbard, T., Chaplin, W. J., et al. 2004c, Solar Phys., 220,
269 [NASA ADS] [CrossRef]
- Gelly, B., Lazrek, M.,
Grec, G., et al. 2002, A&A, 394, 285 [EDP Sciences] [NASA ADS] [CrossRef] (In the text)
- Grec, G., Fossat, E.,
Gelly, B., & Schmider, F.X. 1991, Sol. Phys., 133, 13 [NASA ADS] [CrossRef] (In the text)
- Jiménez-Reyes, S.
J., García, R. A., Jiménez, A., & Chaplin, W. J.
2003, ApJ, 595, 446 [NASA ADS] [CrossRef] (In the text)
- Jiménez-Reyes, S.
J., García, R. A., & Henney, C. J. 2004, in SOHO 14/GONG
2004 Workshop, Helio- and Asteroseismology: Towards a golden
future, ESA SP-559, 505
(In the text)
- Pallé, P. L.,
Fossat, E., Régulo, C., et al. 1993, A&A, 280, 324 [NASA ADS] (In the text)
- Pallé, P. L.,
Régulo, C., Roca Cortés, T., et al. 1999, A&A, 341,
625 [NASA ADS] (In the text)
- Parker, D. G., Ulrich, R.
K., & Pap, J. M. 1998, Sol. Phys., 177, 229 [NASA ADS] [CrossRef] (In the text)
- Renaud, C., Grec, G.,
Boumier, P., et al. 1999, A&A, 345, 1019 [NASA ADS] (In the text)
- Robillot, J. M. 2000,
private communication
(In the text)
- Robillot, J. M.,
Bocchia, R., & Denis, N. 1993a, in Vth IRIS workshop & GOLF
93 annual meeting, Tenerife, Spain, 57
(In the text)
- Robillot, J. M.,
Bocchia, R., & Denis, N. 1993b, in VIth IRIS workshop &
GONG meeting, Cambridge, UK, 37
- Robillot, J. M.,
Turck-Chièze, S., García, R. A., et al. 1998, in SoHO
6/GONG 98 Workshop, Structure and Dynamics of the interior of the
Sun and Sun-like Stars, ESA SP-418, 317
(In the text)
- Thiery, S. 2000, Ph.D.
Thesis, University of Paris XI, Orsay, France
(In the text)
- Turck-Chièze, S.,
García, R. A., Couvidat, S., et al. 2004a, ApJ, 604, 455 [NASA ADS] [CrossRef] (In the text)
- Turck-Chièze, S.,
García, R. A., Couvidat, S., et al. 2004b, in SOHO 14/GONG
2004 Workshop, Helio- and Asteroseismology: Towards a golden
future, ESA SP-559, 85
- Ulrich, R. K. 1991, in
Helioseismology from Space, COSPAR 28th Plenary Meeting, ed. B. H.
Foing, Adv. Space Res., 11, 217
(In the text)
- Ulrich, R. K.,
García, R. A., Robillot, J. M., et al. 1998, in SoHO 6/GONG 98
Workshop, Structure and Dynamics of the interior of the Sun and
Sun-like Stars, ESA SP-418, 353
(In the text)
- Ulrich, R. K.,
García, R. A., Robillot, J. M., et al. 2000, A&A, 364,
799 [NASA ADS] (In the text)
Copyright ESO 2005
![\begin{figure}
\par\includegraphics[width=8cm]{2779f1.ps}\end{figure}](/articles/aa/full/2005/40/aa2779-05/img10.gif)
![\begin{figure}
\par\includegraphics[width=8cm,clip]{2779f2.eps}\end{figure}](/articles/aa/full/2005/40/aa2779-05/img13.gif)
![\begin{figure}
\par\includegraphics[width=8cm,clip]{2779f3.ps}\end{figure}](/articles/aa/full/2005/40/aa2779-05/img14.gif)
![\begin{figure}
\par\includegraphics[width=8.8cm,clip]{2779f4.eps}
\end{figure}](/articles/aa/full/2005/40/aa2779-05/img19.gif)
![\begin{figure}
\par\includegraphics[width=7.5cm,clip]{2779f5.eps}
\end{figure}](/articles/aa/full/2005/40/aa2779-05/img30.gif)
![\begin{figure}
\par {\includegraphics[angle=90,width=8cm,clip]{2779f6.ps} }
\end{figure}](/articles/aa/full/2005/40/aa2779-05/img33.gif)
![\begin{figure}
\par {\includegraphics[angle=90,width=8cm,clip]{2779f7.ps} }
\end{figure}](/articles/aa/full/2005/40/aa2779-05/img36.gif)
![\begin{figure}
\par {\includegraphics[angle=90,width=8.4cm,clip]{2779f8.ps} }
\end{figure}](/articles/aa/full/2005/40/aa2779-05/img40.gif)
![\begin{figure}
\par {\includegraphics[angle=90,width=8.5cm]{2779f9.ps} }
\end{figure}](/articles/aa/full/2005/40/aa2779-05/img43.gif)
![\begin{figure}
\par {\includegraphics[angle=90,width=8.2cm,clip]{2779f10.ps} }
\end{figure}](/articles/aa/full/2005/40/aa2779-05/img50.gif)
![\begin{figure}
\par\includegraphics[angle=90,width=7.8cm]{2779f11.ps}\end{figure}](/articles/aa/full/2005/40/aa2779-05/img54.gif)
![\begin{figure}
\par\includegraphics[angle=90,width=8cm]{2779f12.ps}\end{figure}](/articles/aa/full/2005/40/aa2779-05/img58.gif)
![\begin{figure}
\par {\includegraphics[angle=90,width=12cm]{2779f13.ps} }
\end{figure}](/articles/aa/full/2005/40/aa2779-05/img59.gif)
![\begin{figure}
\par\includegraphics[width=7.8cm,clip]{2779f14.eps}\end{figure}](/articles/aa/full/2005/40/aa2779-05/img65.gif)
![\begin{figure}
\par\mbox{\includegraphics[width=8.cm]{2779f15a.ps}\qquad
\includegraphics[width=8.3cm]{2779f15b.ps} }
\end{figure}](/articles/aa/full/2005/40/aa2779-05/img66.gif)