A&A 427, 465-483 (2004)
DOI: 10.1051/0004-6361:20040460
C. Fanti 1,2 - M. Branchesi 3,2 - W. D. Cotton 4 - D. Dallacasa 3,2 - R. Fanti 1,2 - L. Gregorini 1,2 - M. Murgia 2,6 - C. Stanghellini 5 - M. Vigotti 2
1 - Dipartimento di Fisica,
Universitá di Bologna, via Irnerio 46, 40126 Bologna, Italy
2 -
Istituto di Radioastronomia del
CNR, via Gobetti 101, 40129 Bologna, Italy
3 -
Dipartimento di Astronomia, Universitá di Bologna,
via Ranzani 1, 40127 Bologna, Italy
4 -
National Radio Astronomy Observatory, Charlottesville, USA
5 -
Istituto di Radioastronomia del CNR, CP 141, 96017 Noto SR, Italy
6 -
INAF - Osservatorio Astronomico di Cagliari, Loc. Poggio dei Pini,
Strada 54, 09012 Capoterra, Italy
Received 17 March 2004 / Accepted 23 July 2004
Abstract
We discuss VLA polarization measurements at 8.5, 4.9 and 1.4 GHz
for the B3-VLA sample of Compact Steep-spectrum Sources (CSS). The
measurements at the two higher frequencies were presented in a
previous paper (Fanti et al. 2001), while those at 1.4 GHz
are from the NVSS.
The study of the fractional polarization as a function of wavelength shows a variety of behaviours not always
accounted for by the current simple models.
In a large fraction of sources the integrated rotation angle appears
to follow the ![]() law down to 1.4 GHz, although this
conclusion has to be treated with some care due to the small number of
polarization measurements.
For sources resolved at the two higher frequencies we find that a
number exhibit asymmetries in the 8.5 GHz fractional polarization,
in depolarization and rotation angle.
We discuss depolarization effects and rotation of the polarization
angle.
We find that Faraday depth effects are very strong within 2-3 kpc
of the nucleus, as found earlier by Cotton et al. (2003).
A simple model for an external Faraday screen is able to account for
the gross observed features. We also find that the Rotation Measure and the Faraday Dispersion
appear to increase with the source red-shift.
law down to 1.4 GHz, although this
conclusion has to be treated with some care due to the small number of
polarization measurements.
For sources resolved at the two higher frequencies we find that a
number exhibit asymmetries in the 8.5 GHz fractional polarization,
in depolarization and rotation angle.
We discuss depolarization effects and rotation of the polarization
angle.
We find that Faraday depth effects are very strong within 2-3 kpc
of the nucleus, as found earlier by Cotton et al. (2003).
A simple model for an external Faraday screen is able to account for
the gross observed features. We also find that the Rotation Measure and the Faraday Dispersion
appear to increase with the source red-shift.
Key words: galaxies: active - polarization - radio continuum: galaxies - quasars: general - ISM: structure
Young radio sources, believed to be a significant fraction of the
class of Compact Steep-spectrum Sources (CSS) and
Gigahertz Peaked-spectrum Sources (GPS) (see
O'Dea 1998), owing to their small sizes are fully immersed in
the host galaxy inhomogeneous Interstellar Medium (ISM).
Clouds with density
![]() cm-3, temperature
cm-3, temperature
![]() K and small filling factor (
K and small filling factor (
![]() ),
producing the Narrow Emission Lines (NL), are distributed up
to a kpc from the nucleus.
The inter-cloud space is presumed to be filled by a more diffuse and
hotter gas component (
),
producing the Narrow Emission Lines (NL), are distributed up
to a kpc from the nucleus.
The inter-cloud space is presumed to be filled by a more diffuse and
hotter gas component (
![]() cm-3 and
cm-3 and
![]() K)
in pressure equilibrium with the NL clouds.
Strong asymmetries in flux density and arm ratio between the two radio
lobes (which cannot be attributed in general to Doppler boosting) are
often observed and are explained as interactions of the radio jets
with dense gas clumps (see, e.g., Saikia et al. 2001,
2002).
Even for moderate magnetic field intensities, significant Faraday
Rotation effects are expected from both the diffuse and the clumpy gas.
Ordered large scale components of the magnetic field may produce
significant Faraday Rotation of the polarization vector as a function
of
K)
in pressure equilibrium with the NL clouds.
Strong asymmetries in flux density and arm ratio between the two radio
lobes (which cannot be attributed in general to Doppler boosting) are
often observed and are explained as interactions of the radio jets
with dense gas clumps (see, e.g., Saikia et al. 2001,
2002).
Even for moderate magnetic field intensities, significant Faraday
Rotation effects are expected from both the diffuse and the clumpy gas.
Ordered large scale components of the magnetic field may produce
significant Faraday Rotation of the polarization vector as a function
of ![]() .
On the other hand, inhomogeneities in the density distribution (NL clouds) or disordered components of the magnetic field on scales
smaller than the source size can produce significant, wavelength
dependent, depolarization of the radiation.
.
On the other hand, inhomogeneities in the density distribution (NL clouds) or disordered components of the magnetic field on scales
smaller than the source size can produce significant, wavelength
dependent, depolarization of the radiation.
CSSs/GPSs have been shown to have large Rotation Measures and large depolarizations (see, e.g., O'Dea 1998, and references therein). Such sources are thus powerful tools in the study of the kpc properties of their host galaxy ambient medium.
In this paper, we present the polarization characteristics of a complete sample of CSSs, the B3-VLA CSS sample, at the three frequencies of 8.5, 4.9 and 1.4 GHz, and discuss the implications on the properties of the external medium.
Section 2 gives a short summary of the B3-VLA CSS sample.
Sections 3 and 4 describe the polarization data reduction and the results respectively.
Sections 5 and 6 present a discussion of the major results obtained and the conclusions.
Appendix A contains the more extended data tables.
The present CSS sample, described in Fanti et al. (2001, Paper I), was
selected from the B3-VLA catalogue (Vigotti et al. 1989).
It consists of 87 CSSs/GPSs with linear sizes (LS) in the
range![]() 0.4
0.4
![]() and with radio luminosity
and with radio luminosity
![]() W/Hz.
W/Hz.
The sample has been observed with the VLA at 1.4 GHz, in A and C configurations, without polarization information (Vigotti et al. 1989) and at 4.9 and 8.5 GHz in full polarization (both A configuration; Paper I). In addition NVSS data at 1.4 GHz (Condon et al. 1998), complete with polarization information, are available for the majority of the sources. Three sources (1014+392, 1141+466, 1445+410) do not have polarization measurements at high frequencies, hence the sample discussed here consists of 84 objects only.
A number of sources, unresolved or poorly resolved even at the highest
VLA resolution (![]() 0.2
0.2
![]() at 8.5 GHz) were observed in two
separate VLBI projects at 1.7 GHz (Dallacasa et al. 2002a,b; Papers II and III) and in a third at 5 and 8.5 GHz
(Orienti et al. 2004, Paper V).
at 8.5 GHz) were observed in two
separate VLBI projects at 1.7 GHz (Dallacasa et al. 2002a,b; Papers II and III) and in a third at 5 and 8.5 GHz
(Orienti et al. 2004, Paper V).
The total source sample is presented in Table A.1, with data
taken from the above papers. Red-shifts are either spectroscopic or
photometric from K or R band. When no red-shift is available,
z=1.05 has been assumed through the whole paper, as discussed in
Paper I. A simple morphological classification is also given.
The terms CSO (Compact Symmetric Object) and MSO (Medium
Symmetric Object) refer to a double sided morphology and a projected
linear size smaller or larger than ![]() 1 h-1 kpc, as
introduced by Fanti et al. (1995) and Readhead et al. (1996).
Thirteen of the sources that have an uncertain morphological type and
are not classified as MSO or CSO are still listed in
Table A.1 but are marked with a
1 h-1 kpc, as
introduced by Fanti et al. (1995) and Readhead et al. (1996).
Thirteen of the sources that have an uncertain morphological type and
are not classified as MSO or CSO are still listed in
Table A.1 but are marked with a ![]() .
Source comments are included as necessary.
.
Source comments are included as necessary.
The polarization data, presented in Paper I, have been re-analized as follows:
In the first approach, referred to as low resolution, we use an angular resolution such that all sources appear unresolved. This allows us to compare these low resolution data with the data at 1.4 GHz from the NVSS (Condon et al. 1998).
![\begin{figure}
\par\includegraphics[angle=-90,width=7.8cm,clip]{0460fg1a.ps}\hsp...
...ace*{4mm}
\includegraphics[angle=-90,width=7.8cm,clip]{0460fg1d.ps}
\end{figure}](/articles/aa/full/2004/44/aa0460-04/img38.gif) |
Figure 1:
|
| Open with DEXTER | |
In the second approach, referred to as high resolution, we have considered the fifty most resolved sources and have split them into independent components. In thirty-five sources the splitting was into two major components, interpreted as the radio lobes. In the fifteen more extended radio sources additional sub-structure is present, either in the lobes or as an additional central component, and a further sub-division has been made.
Given the wide range of angular sizes (<0.2
![]() -6
-6
![]() )
this
broad component sub-division is aimed at providing approximately the
same number of resolution elements for each sub-component.
We stress that, due to the limited resolution, these components are not
necessarily homogeneous. It is therefore likely that there is a mixing
of lobes with hot spots and fragments of jets. Inner components of
multiple sources may be jets or sub-structures of lobes and so on.
)
this
broad component sub-division is aimed at providing approximately the
same number of resolution elements for each sub-component.
We stress that, due to the limited resolution, these components are not
necessarily homogeneous. It is therefore likely that there is a mixing
of lobes with hot spots and fragments of jets. Inner components of
multiple sources may be jets or sub-structures of lobes and so on.
For image handling we used the NRAO Astronomical Image Processing System (AIPS).
For each source (or component) we have computed at both 8.5 and 4.9 GHz the flux density for total intensity ![]() and linear
polarization
and linear
polarization ![]() ,
and the average position angle
,
and the average position angle ![]() of
the E vector.
Linear polarization was computed with both scalar and vectorial averaging, i.e. averaging in polarization, P, or in Qand U (see below). Subsequently, fractional polarization,
of
the E vector.
Linear polarization was computed with both scalar and vectorial averaging, i.e. averaging in polarization, P, or in Qand U (see below). Subsequently, fractional polarization,
![]() ,
rotation angle,
,
rotation angle,
![]() ,
and depolarization ratio,
,
and depolarization ratio,
![]() ,
between pairs of
frequencies (
,
between pairs of
frequencies (
![]() )
have been derived.
)
have been derived.
For the high resolution data flux densities from I, P, Qand U images were computed using the following procedure. Around each major component visible on the I image a rectangular area or "box'' was set, which was the same at the two frequencies and for all the images of each source. The integrated flux densities were then derived via the AIPS task IMEAN as:
For the low resolution analysis the polarization parameters I,
Q, U and
![]() were computed by integration (AIPS
task "IMEAN'') on a box which includes all the visible emission on
the I images.
In Fig. 1 (bottom panels) we compare the integrated scalar
and vector polarized flux densities at the two frequencies. There are
clearly several sources with
were computed by integration (AIPS
task "IMEAN'') on a box which includes all the visible emission on
the I images.
In Fig. 1 (bottom panels) we compare the integrated scalar
and vector polarized flux densities at the two frequencies. There are
clearly several sources with
![]() due to changes in the polarization position angle from one component
to another.
Since we are comparing our results with integrated polarization
measurements from the NVSS (Condon et al. 1998),
due to changes in the polarization position angle from one component
to another.
Since we are comparing our results with integrated polarization
measurements from the NVSS (Condon et al. 1998),
![]() is the appropriate value to use because the NVSS catalog essentially
uses the same measure.
is the appropriate value to use because the NVSS catalog essentially
uses the same measure.
The radio brightness distribution in "empty" regions of I, Q and
U images is approximately Gaussian, therefore we can assume the
rms as a good noise estimate. Typical values (![]() )
are
)
are
![]() mJy/beam for Stokes parameters Q and U and
mJy/beam for Stokes parameters Q and U and
![]() mJy/beam for I.
For extended components we take as flux errors
mJy/beam for I.
For extended components we take as flux errors ![]() times the
above quoted values, where N is the number of independent beam areas
across the structure. The errors of the derived parameters are
computed from these values using the error propagation.
We have:
times the
above quoted values, where N is the number of independent beam areas
across the structure. The errors of the derived parameters are
computed from these values using the error propagation.
We have:
The rms of the instrumental polarization has been added quadratically
to the polarization noise to obtain the final errors.
Finally, very conservatively, a calibration error of ![]() has been
quadratically added to the noise error of the polarization position angle
has been
quadratically added to the noise error of the polarization position angle
In order to check the reliability of our error estimates we have compared our low resolution measures at 8.5 and 4.9 GHz with those of Klein et al. (2003) at 10.5 and 4.8 GHz, from the Effelsberg radio telescope, for sixteen common sources for which these data are available. The rms of the differences in polarized flux density and in angle are consistent with the estimated errors (Table 1).
The polarization parameters of resolved source components (high
resolution) and the integrated polarization parameters (low
resolution) including the data at 1.4 GHz from the NVSS are given in
the Appendix (Tables A.2 and A.3 respectively).
In both these Tables, at each frequency we give: component or total
source flux density (![]() ), vector fractional polarization (
), vector fractional polarization (![]() )
and position angle (
)
and position angle (![]() ), defined within
), defined within ![]()
![]() ,
with the corresponding errors in brackets
,
with the corresponding errors in brackets![]() . The E vector
position angle has an intrinsic ambiguity of
. The E vector
position angle has an intrinsic ambiguity of ![]()
![]() due to
its definition. This is taken into account in the evaluation of the
Rotation Measure (RM) in Sect. 4.3.
due to
its definition. This is taken into account in the evaluation of the
Rotation Measure (RM) in Sect. 4.3.
We note that bandwidth depolarization has a minor effect at 8.5 and 4.9 GHz, unless very high Rotation Measures (![]() 104 rad/m2) are
present, while in the NVSS bandwidth depolarization is expected to be
quite large already for
104 rad/m2) are
present, while in the NVSS bandwidth depolarization is expected to be
quite large already for
![]() rad/m2 (Condon et al. 1998).
rad/m2 (Condon et al. 1998).
As seen in Tables A.2 and A.3 a large fraction of
the sources have a significant polarization at the three
frequencies.
Table 2 shows the situation for ![]() at low
resolution for increasing value of S/N ratio.
at low
resolution for increasing value of S/N ratio.
Table 1: Comparison of present polarization data with Klein et al. (2003).
Table 2: Percentage of polarized sources at low resolution.
In the high resolution images the rates of polarized component detection at the two higher frequencies are somewhat higher, by up to 10%, for all S/N ratios.
We often find large asymmetries at 8.5 GHz in the fractional
polarization of the outer components, ![]() 20% of sources having
ratios in
20% of sources having
ratios in
![]() .
There is a tendency for the components weaker in total intensity to
have a larger
.
There is a tendency for the components weaker in total intensity to
have a larger
![]() .
We find no significant differences amongst quasars, galaxies and empty
fields.
.
We find no significant differences amongst quasars, galaxies and empty
fields.
![\begin{figure}
\par\includegraphics[angle=-90,width=8.5cm,clip]{0460fg2a.ps}\par...
...ace*{2mm}
\includegraphics[angle=-90,width=8.5cm,clip]{0460fg2c.ps}
\end{figure}](/articles/aa/full/2004/44/aa0460-04/img79.gif) |
Figure 2:
Depolarization versus S/N: at low resolution on top
(4.9/8.5 GHz) and central (1.4/8.5 GHz) panels;
at high resolution (4.9/8.5 GHz) on bottom panel. In all
figures the two lines
show the upper and lower bounds of the 95% ( |
| Open with DEXTER | |
As the significance of
![]() depends on the
signal to noise ratio for
depends on the
signal to noise ratio for ![]() at the two frequencies
(Sect. 3.2), we show in Fig. 2 plots of the
low resolution depolarization ratio as a function of
at the two frequencies
(Sect. 3.2), we show in Fig. 2 plots of the
low resolution depolarization ratio as a function of
![]() .
The regions above and below the dashed lines contain those objects
whose DP differs from 1 (=no depolarization) by more than 2
.
The regions above and below the dashed lines contain those objects
whose DP differs from 1 (=no depolarization) by more than 2![]() .
It is clear that the fraction of sources which show a decrease in the
fractional polarization with wavelength is rather large:
.
It is clear that the fraction of sources which show a decrease in the
fractional polarization with wavelength is rather large: ![]()
![]() for the frequency pair 4.9/8.5 GHz and
for the frequency pair 4.9/8.5 GHz and ![]()
![]() for the pair 1.4/8.5 GHz.
Note that, except for one case (1025+390B, see
Fig. 2, top panel), values of DP> 1 are not
significant.
for the pair 1.4/8.5 GHz.
Note that, except for one case (1025+390B, see
Fig. 2, top panel), values of DP> 1 are not
significant.
The same plot for the components of the well resolved sources (high resolution data) is also shown in Fig. 2. It is clear from the figure that large depolarization effects (small DPs) are already present at the level of individual components. Some of the components appear to exhibit re-polarization effects; these however, are not statistically significant.
Finally at high resolution we find that in more than 30% of the sources the components show significant differences in depolarization from each other.
In most sources, at both low and high resolution, the polarization position angle shows significant changes with the frequency which is indicative of Faraday Rotation effects, either due to our own Galaxy or intrinsic to the source.
We have estimated the Milky Way contribution from the data set of
Rotation Measures from Klein et al. (2003) which contains about 200 sources carefully measured at 4 frequencies in the same sky area
of our sources. From this data set it is clear that the Galactic
rotation
![]() is
is ![]()
![]() in the range
in the range
![]() and
and ![]()
![]() in the range
in the range
![]() corresponding to
corresponding to
![]() rad/m2 and
rad/m2 and
![]() rad/m2 respectively.
rad/m2 respectively.
In Fig. 3 we show the distribution of the absolute values of
the rotation angles
![]() (taken within
(taken within ![]()
![]() )
corrected for the Galactic rotation for sources (low
resolution) and for components (high resolution) whose
estimated errors on
)
corrected for the Galactic rotation for sources (low
resolution) and for components (high resolution) whose
estimated errors on
![]() are
are ![]()
![]() .
.
![\begin{figure}
\par\includegraphics[angle=-90,width=8.05cm,clip]{0460fg3a.ps}\hspace*{4mm}
\includegraphics[angle=-90,width=7.6cm,clip]{0460fg3b.ps}
\end{figure}](/articles/aa/full/2004/44/aa0460-04/img94.gif) |
Figure 3:
Distribution of the
|
| Open with DEXTER | |
In ![]() 45% of cases the rotation angle for both components and
for the entire source, corrected for the average Galactic rotation,
is >
45% of cases the rotation angle for both components and
for the entire source, corrected for the average Galactic rotation,
is >![]() ,
corresponding to an
,
corresponding to an
![]() rad/m2.
rad/m2.
We have used the polarization angles of Table A.3 (low
resolution data) to derive a three-point Faraday Rotation Measure,
RM3, by weighted linear interpolation of the data with the law
![]() .
The procedure has been applied to those 31 sources whose polarized
flux density is
.
The procedure has been applied to those 31 sources whose polarized
flux density is ![]()
![]() at 8.5 and 4.9 GHz and
at 8.5 and 4.9 GHz and ![]()
![]() at 1.4 GHz.
Note that these sources typically have linear sizes
at 1.4 GHz.
Note that these sources typically have linear sizes ![]() 5 kpc (see
Sect. 4.5).
We have assumed that between 8.5 and 4.9 GHz any rotation is less
than
5 kpc (see
Sect. 4.5).
We have assumed that between 8.5 and 4.9 GHz any rotation is less
than ![]() .
This assumption implies that
.
This assumption implies that
![]() rad/m2 would be missed.
Selected examples of these fits, discussed below, are shown in
Fig. 4.
rad/m2 would be missed.
Selected examples of these fits, discussed below, are shown in
Fig. 4.
The range covered in ![]() by the three sets of data is not
optimal since the two short wavelengths are rather close to each other
and well separated from the third long one. In this situation, even
when the errors on
by the three sets of data is not
optimal since the two short wavelengths are rather close to each other
and well separated from the third long one. In this situation, even
when the errors on
![]() are
are ![]()
![]() there
may be ambiguities in
there
may be ambiguities in
![]() of
of ![]() or
or ![]() .
In the fit we searched for solutions for RM3 with chi-square
.
In the fit we searched for solutions for RM3 with chi-square ![]() 3.
In a number of cases we found more than one acceptable solution,
corresponding to different
3.
In a number of cases we found more than one acceptable solution,
corresponding to different
![]() ambiguities in
ambiguities in
![]() (see, e.g., 0137+401 in Fig. 4).
The RM3s (not corrected for the Galactic Faraday rotation,
(see, e.g., 0137+401 in Fig. 4).
The RM3s (not corrected for the Galactic Faraday rotation,
![]() ), derived with the smallest |n1.4| are given in
Table 3 together with other acceptable values of n1.4.
Note that an uncertainty
), derived with the smallest |n1.4| are given in
Table 3 together with other acceptable values of n1.4.
Note that an uncertainty
![]() implies an uncertainty
implies an uncertainty
![]() rad/m2.
In 36% of cases no ambiguity in
rad/m2.
In 36% of cases no ambiguity in
![]() was present (i.e.
n1.4 = 0) and in 45% we needed to add or subtract one turn
of phase in polarization angle at 1.4 GHz
was present (i.e.
n1.4 = 0) and in 45% we needed to add or subtract one turn
of phase in polarization angle at 1.4 GHz
![\begin{figure}
\par$\chi^\circ(\lambda)$\includegraphics[angle=-90,width=7.2cm,c...
...$^2$ )]{\includegraphics[angle=-90,width=7.2cm,clip]{0460fg4h.ps} }
\end{figure}](/articles/aa/full/2004/44/aa0460-04/img108.gif) |
Figure 4:
Examples of
|
| Open with DEXTER | |
The formal errors on RM3 are very small, of the order of a few rad/m2. The actual uncertainties are the n1.4 ambiguities
and the assumption of validity of the ![]() law over the whole
wavelength range.
law over the whole
wavelength range.
The source frame (sf) Rotation Measure, obtained from the Galaxy-corrected Rotation Measure by multiplying it by (1+z)2, is also given in Table 3.
Table 3:
Observer's and source's frame three-frequency Rotation Measures and
![]() ambiguities.
ambiguities.
The RM3 distribution (Fig. 5), compared with the
distribution of
![]() (Fig. 3),
shows some deficiency of values above 200 rad/m2.
This is possibly due to the fact that for larger values of RM the
fractional polarization at 1.4 GHz drops quickly because of bandwidth
depolarization (see Fig. 7) and RM3 cannot be
computed. Therefore sources with RM above that value may be
under-represented.
(Fig. 3),
shows some deficiency of values above 200 rad/m2.
This is possibly due to the fact that for larger values of RM the
fractional polarization at 1.4 GHz drops quickly because of bandwidth
depolarization (see Fig. 7) and RM3 cannot be
computed. Therefore sources with RM above that value may be
under-represented.
![\begin{figure}
\par\includegraphics[angle=-90,width=7cm,clip]{0460fg5a.ps}\hspace*{4mm}
\includegraphics[angle=-90,width=7cm,clip]{0460fg5b.ps}
\end{figure}](/articles/aa/full/2004/44/aa0460-04/img113.gif) |
Figure 5:
Distribution of three-frequency |RM3|. Left panel
is for the observer frame (Galaxy corrected). Note that
RM3 = 100 rad/m2 corresponds to
|
| Open with DEXTER | |
In order to check the reliability of our RM3s, we have compared
them with the RMs of Klein et al. (2003) for the ten sources
in common for which these data are available. Note that Klein et al. (2003) also have polarization data at 2.7 GHz, which allows
them to drastically reduce the
![]() ambiguities.
ambiguities.
For five sources (marked by an * in Table 3) the agreement
of our measurements with those of Klein et al. (2003) is very good
(see, e.g., ![]() 0110+401 or 0805+406 in
Fig. 4).
A sixth source (1220+408, Fig. 4) is also marked by
an * since the difference between the two Rotation Measures, larger
than the combined uncertainties, is attributable to the fact that
Klein et al. (2003) did not use the NVSS measure, which we
used. Our Rotation Measure (see Fig. 4) provides an
acceptable fit across the whole set of data.
For the source 0213+412 (Fig. 4), marked by **, our
Rotation Measure is inconsistent with the polarization angle at 2.7 GHz, while that of Klein et al. (2003) is inconsistent with the
polarization angle at 1.4 GHz, that they did not use in their fit. A
good model that fits all the data is obtained by allowing for a
0110+401 or 0805+406 in
Fig. 4).
A sixth source (1220+408, Fig. 4) is also marked by
an * since the difference between the two Rotation Measures, larger
than the combined uncertainties, is attributable to the fact that
Klein et al. (2003) did not use the NVSS measure, which we
used. Our Rotation Measure (see Fig. 4) provides an
acceptable fit across the whole set of data.
For the source 0213+412 (Fig. 4), marked by **, our
Rotation Measure is inconsistent with the polarization angle at 2.7 GHz, while that of Klein et al. (2003) is inconsistent with the
polarization angle at 1.4 GHz, that they did not use in their fit. A
good model that fits all the data is obtained by allowing for a ![]() ambiguity at 2.7 GHz and by taking
n1.4=-2 (still
acceptable, Table 3). This model is represented by the
dot-dashed line in Fig. 4.
ambiguity at 2.7 GHz and by taking
n1.4=-2 (still
acceptable, Table 3). This model is represented by the
dot-dashed line in Fig. 4.
For two sources, ![]() 0809+404 and
0809+404 and ![]() 1343+386, where again Klein et al. (2003) did not use
the NVSS measure, the large disagreements are reduced by taking
n1.4 = -2 and -1 respectively (dotted line in Fig. 4),
which were not considered in our initial fits since they gave an
excessive chi-square with our own data alone.
Finally, in the case of 0955+390 it seems that a deviation
from the
1343+386, where again Klein et al. (2003) did not use
the NVSS measure, the large disagreements are reduced by taking
n1.4 = -2 and -1 respectively (dotted line in Fig. 4),
which were not considered in our initial fits since they gave an
excessive chi-square with our own data alone.
Finally, in the case of 0955+390 it seems that a deviation
from the ![]() law is occurring at
law is occurring at
![]() cm (see
Fig. 4). These three last sources are marked by "no'' in
Table 3.
cm (see
Fig. 4). These three last sources are marked by "no'' in
Table 3.
The comparison suggests that more than half of our RM3 are correct,
but it also points out the importance of having measures at a
wavelength intermediate between 6 and 20 cm in order to reduce the
effects of the
![]() ambiguities.
Thanks to the availability of data at four wavelengths, it seems fair
to conclude that most sources follow the
ambiguities.
Thanks to the availability of data at four wavelengths, it seems fair
to conclude that most sources follow the ![]() law in the range
from 2.8 to 20 cm.
law in the range
from 2.8 to 20 cm.
If we correct the observed Rotation Measures by the factor (1+z)2(assuming z = 1.05 for the sources without red-shift) we get the
intrinsic Rotation Measures (source frame, sf), reported in
Table 3. About 50% of the sources have intrinsic
![]() rad m-2, but
rad m-2, but ![]()
![]() have
have
![]() rad m-2.
rad m-2.
Using the high resolution data we compared the rotation angle
![]() of the individual components within the same
object. In eight sources (0120+405, 0144+432,
0222+422, 0814+441, 1025+390B,
of the individual components within the same
object. In eight sources (0120+405, 0144+432,
0222+422, 0814+441, 1025+390B,
![]() 1039+424, 1201+394, 1220+408) there
is a significant difference in the range of
1039+424, 1201+394, 1220+408) there
is a significant difference in the range of ![]() 20
20
![]() between the rotation angles of the two components. More generally the distribution of the differences of the
between the rotation angles of the two components. More generally the distribution of the differences of the
![]() of the two components is significantly
broader than expected from the estimated errors and implies a
dispersion of
of the two components is significantly
broader than expected from the estimated errors and implies a
dispersion of ![]()
![]() in the differential
rotation between components, corresponding to a dispersion in the
differential Rotation Measures
in the differential
rotation between components, corresponding to a dispersion in the
differential Rotation Measures ![]() 100 rad m-2.
100 rad m-2.
Inside each source component there are probably smaller regions with
different Rotation Measures so that the rotation angle we see is an
"average value''.
In such a situation the average polarization angle is not expected to
change as ![]() .
It is therefore of note that so many sources (
.
It is therefore of note that so many sources (![]()
![]() of those
measured at 2.7 GHz) follow the
of those
measured at 2.7 GHz) follow the ![]() law.
law.
![\begin{figure}
\par\includegraphics[height=8.0cm,angle=-90,clip]{0460fg6a.ps}\hspace*{4mm}
\includegraphics[height=8.0cm,angle=-90,clip]{0460fg6a.ps}
\end{figure}](/articles/aa/full/2004/44/aa0460-04/img121.gif) |
Figure 6: Depolarization ratio vs. rotation angle (4.9/8.5 GHz) (Galaxy corrected) at high ( left) and low ( right) resolutions. |
| Open with DEXTER | |
We have searched for a correlation between depolarization and (Galaxy-corrected) rotation angle both in the high resolution and on the low resolution data.
Figure 6 shows plots of the depolarization ratio
DP8.54.9 vs. the rotation angle
![]() ,
with both low resolution and high
resolution data, for the sources/components with
,
with both low resolution and high
resolution data, for the sources/components with
![]() and whose estimated errors on
and whose estimated errors on
![]() are
are ![]()
![]() .
More depolarized sources (
.
More depolarized sources (
![]() )
show a broader
distribution of rotation angles as compared to the less depolarized
ones. Chi-square tests on contingency tables show that the
probability that this effect is spurious is
)
show a broader
distribution of rotation angles as compared to the less depolarized
ones. Chi-square tests on contingency tables show that the
probability that this effect is spurious is ![]()
![]() .
.
Figure 7 displays the plot of
DP8.51.4 vs.
|
![]() |. The curve on the plot shows the
expected effect of bandwidth depolarization at the lowest frequency
(Condon et al. 1998) on the assumption of a Rotation Measure in
the 1.4 GHz band equal to the one derived from our high frequency data.
The large majority of sources are significantly below this curve,
showing that bandwidth depolarization is not the major cause of
depolarization.
There are no sources with a DP significantly above the curve except
in the region around its deep minimum. This suggests either that the
expected bandwidth depolarization is overestimated in that range of
Rotation Measures, or that the high frequency RM does not apply at
the lowest frequency.
|. The curve on the plot shows the
expected effect of bandwidth depolarization at the lowest frequency
(Condon et al. 1998) on the assumption of a Rotation Measure in
the 1.4 GHz band equal to the one derived from our high frequency data.
The large majority of sources are significantly below this curve,
showing that bandwidth depolarization is not the major cause of
depolarization.
There are no sources with a DP significantly above the curve except
in the region around its deep minimum. This suggests either that the
expected bandwidth depolarization is overestimated in that range of
Rotation Measures, or that the high frequency RM does not apply at
the lowest frequency.
Cotton et al. (2003) have examined the NVSS (1.4 GHz) polarization
data of this sample as a function of the source projected linear size, LS,
and found that the fractional polarization of the sources
with
![]() kpc is very small, always less than 1% and typically
kpc is very small, always less than 1% and typically ![]() 0.4%.
Above
0.4%.
Above ![]() 6 kpc this changes abruptly and settles on a
median value of about 0.9%, with a large dispersion and values up to 4-5%.
6 kpc this changes abruptly and settles on a
median value of about 0.9%, with a large dispersion and values up to 4-5%.
![\begin{figure}
\par\includegraphics[angle=-90,width=8.5cm,clip]{0460fg7.ps}
\end{figure}](/articles/aa/full/2004/44/aa0460-04/img127.gif) |
Figure 7: Depolarization (1.4/8.5 GHz) vs. rotation angle (4.9/8.5 GHz). The line represents the effect of bandwidth depolarization at 1.4 GHz (Fig. 23 in Condon et al. 1998). |
| Open with DEXTER | |
![\begin{figure}
\par\includegraphics[height=8.4cm,angle=-90,clip]{0460fg8a.ps}\pa...
...ce*{2mm}
\includegraphics[height=8.4cm,angle=-90,clip]{0460fg8c.ps}
\end{figure}](/articles/aa/full/2004/44/aa0460-04/img128.gif) |
Figure 8:
Distribution of |
| Open with DEXTER | |
In Fig. 8 we plot ![]() at 1.4 GHz, 4.9 and 8.5,
taken from Table A.3, as a function of LS. The horizontal
segments show the median values for intervals of LS. At all LSs, the
distribution of the
at 1.4 GHz, 4.9 and 8.5,
taken from Table A.3, as a function of LS. The horizontal
segments show the median values for intervals of LS. At all LSs, the
distribution of the ![]() has a rather large dispersion and is
quite skewed at all frequencies.
The discontinuity of the fractional polarization at around 5 kpc is
very evident in all three panels, although at 4.9 and 8.5 GHz a few of
the smallest objects do show significant polarization. The curves
represent models discussed in Sect. 5.4.
has a rather large dispersion and is
quite skewed at all frequencies.
The discontinuity of the fractional polarization at around 5 kpc is
very evident in all three panels, although at 4.9 and 8.5 GHz a few of
the smallest objects do show significant polarization. The curves
represent models discussed in Sect. 5.4.
The mean and median values of ![]() at the three frequencies for
classes of LS are reported in Table 4.
We note that ten of the thirteen sources not classified as
at the three frequencies for
classes of LS are reported in Table 4.
We note that ten of the thirteen sources not classified as ![]() s or
s or ![]() s
have fractional polarization definitely in excess of the mean or
median values of their size class.
In computing the mean and median values we have included these ten sources.
s
have fractional polarization definitely in excess of the mean or
median values of their size class.
In computing the mean and median values we have included these ten sources.
In Fig. 9 we plot the depolarization ratios DP8.54.9and DP8.51.4 as a function of LS. The curves represent models discussed in Sect. 5.4. Trends similar to those in Fig. 8 are observed. It is also seen that a few small sources with significant polarization at 8.4 and 4.9 GHz do have strong depolarization.
In Table 5 we give mean and median values of DP for classes
of LS. For comparison purposes we have added the corresponding values
for
forty-five sources with
![]() kpc from the sample of Klein et al. (2003).
We have not considered the
size range
kpc from the sample of Klein et al. (2003).
We have not considered the
size range
![]() kpc since about half of the sources are not
polarized at all three frequencies. As it is likely that
this is the result of a very strong frequency dependent depolarization,
the DPs of the remaining half of the sources may not be representative of
the class.
kpc since about half of the sources are not
polarized at all three frequencies. As it is likely that
this is the result of a very strong frequency dependent depolarization,
the DPs of the remaining half of the sources may not be representative of
the class.
Table 4: Mean and median fractional polarization per interval of LS.
A magnetized plasma interposed between the observer and the radio source can be responsible for the changes in the properties of the polarized emission. This plasma can be internal to the source, a foreground screen, or both. It is now generally believed that much of the Faraday Rotation and Depolarization take place in a foreground screen which is located in the vicinity of the radio emitting regions. The influence of such a "Faraday screen'' on the depolarization characteristics of a radio source depends basically on the characteristics of the magnetized medium, such as inhomogeneities (often referred to as "cells''). Here we try to interpret the data using the two models by Burn (1966) and Tribble (1991). The latter, which is a more general treatment, reduces to the former in the case of very small "cells''. In either model, the covering factor of the cells is assumed to be unity. Here we briefly summarize the characteristics of the two models.
Burn model
Burn (1966) assumes "cells'' of identical size and discusses
two extreme situations:
a) the external screen is fully resolved by the observations
("cell'' size comparable or larger than the observing beam); in this
case the Faraday Depth
![]() is constant within
the beam, no depolarization occurs, and the polarization angle rotates
as:
is constant within
the beam, no depolarization occurs, and the polarization angle rotates
as:
![]() ;
b) the screen is totally unresolved ("cells'' much smaller than
the beam size). In the hypothesis that RM is randomly distributed
with dispersion
;
b) the screen is totally unresolved ("cells'' much smaller than
the beam size). In the hypothesis that RM is randomly distributed
with dispersion ![]() ,
the fractional polarization as a function of
,
the fractional polarization as a function of ![]() is given by a Gaussian law:
is given by a Gaussian law:
Tribble model
The Tribble model also assumes that RM is randomly distributed
with dispersion ![]() but, in addition, it assumes a distribution of
the "cell'' sizes.
For a quadratic structure function of the RM the average
squared fractional polarization follows the simple analytic expression:
but, in addition, it assumes a distribution of
the "cell'' sizes.
For a quadratic structure function of the RM the average
squared fractional polarization follows the simple analytic expression:
Particularly interesting is the so called "long wavelength''
behaviour: when
![]() is very large and dominates,
Eq. (2) reduces to:
is very large and dominates,
Eq. (2) reduces to:
Equation (2) reproduces Burn's results for
![]() (screen totally resolved,
(screen totally resolved,
![]() )
and for
)
and for
![]() (screen totally unresolved, Eq. (2) tends
to Eq. (1)).
(screen totally unresolved, Eq. (2) tends
to Eq. (1)).
![\begin{figure}
\par\includegraphics[height=8cm,angle=-90,clip]{0460fg9a.ps}\par\vspace*{2mm}
\includegraphics[height=8cm,angle=-90,clip]{0460fg9b.ps}
\end{figure}](/articles/aa/full/2004/44/aa0460-04/img158.gif) |
Figure 9: Distribution of DP as a function of LS with the two models of Fig. 8. Top: 4.9-8.5 GHz; bottom: 1.4-8.5 GHz. |
| Open with DEXTER | |
Table 5: Mean and Median depolarization per interval of LS.
Table 6: Depolarisation parameters.
A study made at three frequencies allows, in principle,
discrimination between the two models of Burn (1966) and
Tribble (1991) summarized in Sect. 5.1 and the
derivation of the source Faraday Dispersion ![]() and of the "cell''
scale parameter s0/b. Note that for unresolved sources, as in our
case, the source size itself determines the sampling beam (see
Tribble 1991).
and of the "cell''
scale parameter s0/b. Note that for unresolved sources, as in our
case, the source size itself determines the sampling beam (see
Tribble 1991).
In thirty-eight sources of our sample ![]() has
has
![]() at
both 8.5 and 4.9 GHz and in twenty-eight of them
at
both 8.5 and 4.9 GHz and in twenty-eight of them
![]() has
has
![]() .
Note that the large majority of these sources have
.
Note that the large majority of these sources have
![]() kpc (Sect. 4.3).
Such data quality is good enough to attempt a model-fitting of their
fractional polarization, in spite of the very minimum number of
measurements.
In order to do this we first corrected
kpc (Sect. 4.3).
Such data quality is good enough to attempt a model-fitting of their
fractional polarization, in spite of the very minimum number of
measurements.
In order to do this we first corrected
![]() for bandwidth
depolarization using Fig. 23 of Condon et al. (1998).
We have used the RM computed from the present data (mostly RM3,
Sect. 4.3). For the majority of the sources, the estimated |RM| are
for bandwidth
depolarization using Fig. 23 of Condon et al. (1998).
We have used the RM computed from the present data (mostly RM3,
Sect. 4.3). For the majority of the sources, the estimated |RM| are ![]() 150 rad/m2 and the corrections to
150 rad/m2 and the corrections to
![]() are at most
are at most ![]()
![]() .
In five sources, instead, for which our RMs are
.
In five sources, instead, for which our RMs are ![]() 200 rad/m2,
the correction factors would be
200 rad/m2,
the correction factors would be ![]() 2 (see, e.g., 0137+401
in Fig. 10) and probably somewhat uncertain
(Sect. 4.4).
2 (see, e.g., 0137+401
in Fig. 10) and probably somewhat uncertain
(Sect. 4.4).
The results of the fits, reported in Table 6, can be summarized as follows:
Table 6 therefore gives the 3-point fitted ![]() (observed and in the source frame - sf), s0/b, and
(observed and in the source frame - sf), s0/b, and
![]() ,
always from the Tribble model. For the sources
initially fitted with the Burn model s0/b is given within square
brackets. For the six sources without a reliable three frequency
fit and for those five with uncertain (large) correction for bandwidth
depolarization at 1.4 GHz the Faraday Dispersion (in parenthesis) and m0 are estimated using the two higher frequencies only.
Faraday Dispersion in the source frame,
,
always from the Tribble model. For the sources
initially fitted with the Burn model s0/b is given within square
brackets. For the six sources without a reliable three frequency
fit and for those five with uncertain (large) correction for bandwidth
depolarization at 1.4 GHz the Faraday Dispersion (in parenthesis) and m0 are estimated using the two higher frequencies only.
Faraday Dispersion in the source frame,
![]() ,
are
computed using the red-shift from Table A.1. For sources
without red-shift z = 1.05 has been assumed and the computed
,
are
computed using the red-shift from Table A.1. For sources
without red-shift z = 1.05 has been assumed and the computed
![]() is given in square brackets.
is given in square brackets.
Figure 11 shows the distribution of the Faraday Dispersion
(both in the observer's frame,
![]() ,
and in the source
frame,
,
and in the source
frame,
![]() ).
The distribution of
).
The distribution of
![]() ,
which is representative for
sources with
,
which is representative for
sources with
![]() kpc, shows a peak at
kpc, shows a peak at
![]() (rad/m2) and a long tail extending to a few hundred rad/m2. It
is in the tail that the sources unambiguously described by the Tribble
model are found, since only for high Faraday Dispersions does the
predicted long wavelength flattening of the depolarization curve occur
within our wavelength range. Note that the exclusion of sources not
meeting the selection criteria adopted to derive the parameters
reported in Table 6 (e.g. less significant
(rad/m2) and a long tail extending to a few hundred rad/m2. It
is in the tail that the sources unambiguously described by the Tribble
model are found, since only for high Faraday Dispersions does the
predicted long wavelength flattening of the depolarization curve occur
within our wavelength range. Note that the exclusion of sources not
meeting the selection criteria adopted to derive the parameters
reported in Table 6 (e.g. less significant
![]() or
or
![]() )
would produce a deficiency of high values
)
would produce a deficiency of high values
![]() (see Sect. 5.3).
(see Sect. 5.3).
Figure 12 shows the distribution of the intrinsic fractional
polarization values, m0, given in Table 6. The median of the
distribution is
![]() %.
%.
A check of the reliability of the above results is obtained from the ten sources for which the polarization is measured at 2.7 GHz by Klein et al. (2003). We obtain the following results:
The last source, ![]() 0110+401 (Fig. 10), shows an unusual behaviour. The fractional
polarization drops by more than a factor of two at 11 cm
(actually the data at
0110+401 (Fig. 10), shows an unusual behaviour. The fractional
polarization drops by more than a factor of two at 11 cm
(actually the data at
![]() cm are well fitted by a
cm are well fitted by a ![]() -Gaussian with
-Gaussian with
![]() rad m-2)
and then
goes up at 20 cm, once more reaching the short wavelength
value. This behaviour is what
would be expected in the case of the beating of two components
of similar polarized fluxes and Rotation
Measures differing by some 60 rad/m2. We have noted earlier (Sect. 4.3)
that there are sources in which the components exhibit such
behaviour. However, at our resolution the source is extended and
rather amorphous and
thus at present, we do not have any direct evidence for the
suggested explanation.
rad m-2)
and then
goes up at 20 cm, once more reaching the short wavelength
value. This behaviour is what
would be expected in the case of the beating of two components
of similar polarized fluxes and Rotation
Measures differing by some 60 rad/m2. We have noted earlier (Sect. 4.3)
that there are sources in which the components exhibit such
behaviour. However, at our resolution the source is extended and
rather amorphous and
thus at present, we do not have any direct evidence for the
suggested explanation.
![\begin{figure}
\par$m_{\rm v}$ (\%)\includegraphics[height=7.2cm,angle=-90,clip]...
...degraphics[height=7.4cm,width=5.2cm,angle=-90,clip]{0460f10h.ps} }\end{figure}](/articles/aa/full/2004/44/aa0460-04/img192.gif) |
Figure 10:
Fits with the Burn and/or Tribble models for some of the
sources discussed in the text. The data points at
|
| Open with DEXTER | |
![\begin{figure}
\par\includegraphics[angle=-90,width=8.5cm,clip]{0460f11a.ps}\hspace*{2mm}
\includegraphics[angle=-90,width=8.1cm,clip]{0460f11b.ps}
\end{figure}](/articles/aa/full/2004/44/aa0460-04/img193.gif) |
Figure 11: Distribution of the Faraday Dispersions in the observer frame ( left) and in the source frame ( right). Dark bars indicate sources without red-shift for which z=1.05 has been assumed. |
| Open with DEXTER | |
Pentericci et al. 2000, in a sample of 37 high red-shift radio
galaxies (HzRG) found that the intrinsic (i.e. z-corrected) RMs can assume
very high values
and that at
![]() of the HzRGs have an intrinsic
RM > 1000 rad/m-2.
In addition, using
low-z radio galaxies from the literature, they find that the
fraction of objects with RM>1000 rad/m-2 systematically increases
with red-shift and conclude that high-z objects
are embedded in an
intra-cluster environment denser than nearby radio galaxies.
They exclude CSSs from their analysis on the
premise that in these
objects the RM is dominated by the effects of the host galaxy
magnetized ISM.
of the HzRGs have an intrinsic
RM > 1000 rad/m-2.
In addition, using
low-z radio galaxies from the literature, they find that the
fraction of objects with RM>1000 rad/m-2 systematically increases
with red-shift and conclude that high-z objects
are embedded in an
intra-cluster environment denser than nearby radio galaxies.
They exclude CSSs from their analysis on the
premise that in these
objects the RM is dominated by the effects of the host galaxy
magnetized ISM.
Our results
(Sect. 4.5) show that while for the smallest sources
(
![]() kpc) the ISM is very efficient in
randomly rotating the polarization vector so as to
depolarize the source completely, for the more extended sources the depolarization is
not so strong.
(see Sect. 5.4.1). This allows us to investigate
the environment of CSSs as a function of red-shift for distances
kpc) the ISM is very efficient in
randomly rotating the polarization vector so as to
depolarize the source completely, for the more extended sources the depolarization is
not so strong.
(see Sect. 5.4.1). This allows us to investigate
the environment of CSSs as a function of red-shift for distances ![]() 1.5 kpc from the nucleus. Note that, in this case, we
refer mainly to
the Interstellar Medium, since CSSs are totally embedded in this.
1.5 kpc from the nucleus. Note that, in this case, we
refer mainly to
the Interstellar Medium, since CSSs are totally embedded in this.
The plot of the source-frame RMs vs. red-shift
(Fig. 13) for those objects in
Table 3 which have
![]() kpc gives a
marginally significant correlation, with a
kpc gives a
marginally significant correlation, with a ![]() 3% probability of
being due to random fluctuations.
We note that the uncertainty introduced in the determination of RM3 by
the
3% probability of
being due to random fluctuations.
We note that the uncertainty introduced in the determination of RM3 by
the
![]() ambiguities discussed in Sect. 4.3 may
blur any existing correlation.
ambiguities discussed in Sect. 4.3 may
blur any existing correlation.
We then considered the Faraday Dispersion.
In our sample there are fifty objects with
![]() kpc of which
thirty-four have a measured photometric or spectroscopic red-shift.
For twenty-three of these we have already listed the Faraday
Dispersion in Table 6.
A further eight objects (0140+387, 0255+460,
0810+460B, 0856+406, 0935+428A,
kpc of which
thirty-four have a measured photometric or spectroscopic red-shift.
For twenty-three of these we have already listed the Faraday
Dispersion in Table 6.
A further eight objects (0140+387, 0255+460,
0810+460B, 0856+406, 0935+428A,
![]() 1136+420, 1143+456, 2349+410) had
measurements of
1136+420, 1143+456, 2349+410) had
measurements of
![]() larger than 3 times the rms but
non-detections of
larger than 3 times the rms but
non-detections of
![]() or
or
![]() .
For these we computed
.
For these we computed
![]() from the two high
frequencies, adopting for
from the two high
frequencies, adopting for
![]() either the value reported in
Table A.3 or 1-rms, whichever is the larger.
Three remaining objects are not plotted: 0128+394 and 0701+392 have too low a value of
either the value reported in
Table A.3 or 1-rms, whichever is the larger.
Three remaining objects are not plotted: 0128+394 and 0701+392 have too low a value of
![]() and in
addition, together with 1025+390B, have
DP8.54.9 > 1,
therefore their Faraday Dispersion cannot be computed.
The sample is not complete since
and in
addition, together with 1025+390B, have
DP8.54.9 > 1,
therefore their Faraday Dispersion cannot be computed.
The sample is not complete since ![]() 32% of the objects more
extended than 3 kpc do not have measured red-shifts.
However, it can be considered representative of the class since bias
is unlikely to be introduced in
32% of the objects more
extended than 3 kpc do not have measured red-shifts.
However, it can be considered representative of the class since bias
is unlikely to be introduced in
![]() by excluding
objects without a measured red-shift.
by excluding
objects without a measured red-shift.
The results are shown in Fig. 14 (left) where a trend of
![]() with z is clearly visible: at z<1 only "low''
Faraday Dispersions are present while large values of are found
only at high red-shifts.
No data points were found in the quadrant [z < 1,
with z is clearly visible: at z<1 only "low''
Faraday Dispersions are present while large values of are found
only at high red-shifts.
No data points were found in the quadrant [z < 1,
![]() rad/m2]. A chi-square test for a contingency table
gives a probability less than 0.5% that this effect is spurious.
After removing the six objects with a photometric (more uncertain)
red-shift, the effect still remains significant at a 99% level.
rad/m2]. A chi-square test for a contingency table
gives a probability less than 0.5% that this effect is spurious.
After removing the six objects with a photometric (more uncertain)
red-shift, the effect still remains significant at a 99% level.
An alternative way to show the dependence of
![]() on zis given on the right side of Fig. 14, where we plot
on zis given on the right side of Fig. 14, where we plot
![]() vs. z.
If
vs. z.
If
![]() were independent of z we would expect an
inverse proportionality between
were independent of z we would expect an
inverse proportionality between
![]() and (1+z)2,
which is not present. As an example we plot the curve expected as a
function of z for
and (1+z)2,
which is not present. As an example we plot the curve expected as a
function of z for
![]() rad/m2, which is the
maximum intrinsic value found for z < 1. All data points
corresponding to z < 1 are below the curve, while most of those
corresponding to z > 1 are above this curve, indicating that their
intrinsic Faraday Dispersion is larger.
rad/m2, which is the
maximum intrinsic value found for z < 1. All data points
corresponding to z < 1 are below the curve, while most of those
corresponding to z > 1 are above this curve, indicating that their
intrinsic Faraday Dispersion is larger.
A systematic effect able to remove data-points from the top-left
quadrant (left panel) might be due to having considered only objects
with a significant
![]() .
If these CSSs had
.
If these CSSs had
![]() %
(see Sect. 5.6) then too low a value of
%
(see Sect. 5.6) then too low a value of
![]() would imply a high Faraday Dispersion. The only two radio sources in
such a situation, (0128+394 and 0701+392) however
have z > 1 and therefore their exclusion does not affect the
would imply a high Faraday Dispersion. The only two radio sources in
such a situation, (0128+394 and 0701+392) however
have z > 1 and therefore their exclusion does not affect the
![]() plot.
plot.
![\begin{figure}
\par\includegraphics[angle=-90,width=8.2cm,clip]{0460fg12.ps}
\end{figure}](/articles/aa/full/2004/44/aa0460-04/img201.gif) |
Figure 12: Distribution of the intrinsic fractional polarisation m0 ( low resolution). |
| Open with DEXTER | |
![\begin{figure}
\par\includegraphics[angle=-90,width=8.5cm,clip]{0460fg13.ps}
\end{figure}](/articles/aa/full/2004/44/aa0460-04/img202.gif) |
Figure 13: Distribution of intrinsic RM3 vs. red-shift; data-points in squares represent photometric red-shifts. See Sect. 4.3 for a discussion of uncertainties in RM3. |
| Open with DEXTER | |
We have tried to model this result in terms of Faraday Depolarization
occurring in the ambient medium of the radio source. We use a very simplified
model which assumes
that the Faraday Dispersion produced by the ambient gas
has the following King-like distribution:
We assume that the radio source axis is roughly perpendicular to the line
of sight.
This is consistent with the Unified Scheme models, since most
sources of our sample are radio galaxies.
The fractional polarization at the observed wavelength
![]() and at a distance R from the galaxy core is
computed, for simplicity, using the Burn model
(Eq. (1)).
The use of the Tribble model produces minor differences which
will be discussed later.
In order to get the integrated
and at a distance R from the galaxy core is
computed, for simplicity, using the Burn model
(Eq. (1)).
The use of the Tribble model produces minor differences which
will be discussed later.
In order to get the integrated
![]() of the model,
we have integrated
of the model,
we have integrated
![]() along the source axis assuming
different brightness distributions.
along the source axis assuming
different brightness distributions.
The wavelength dependent transition of depolarization in the range ![]() 3-6 kpc (Fig. 8) puts a number of constraints on the
model parameters. We find that
the more peaked the gas distribution (i.e. smaller
3-6 kpc (Fig. 8) puts a number of constraints on the
model parameters. We find that
the more peaked the gas distribution (i.e. smaller ![]() and larger
and larger ![]() ), the sharper is the increase with LS of the
fractional polarization and the closer to each other are, at the
three
frequencies, the LSs at which the jump occurs. Appropriate ranges of
values for our data are:
), the sharper is the increase with LS of the
fractional polarization and the closer to each other are, at the
three
frequencies, the LSs at which the jump occurs. Appropriate ranges of
values for our data are:
In Fig. 8 two of the various models that
we tried are shown
superimposed on the distribution of ![]() as a function of LS,
at the three frequencies.
In one model we have assumed that the source brightness is uniform over the whole source
extent (lower curve), while in the second, the brightness distribution is
concentrated in the outermost thirds. This second model
is consistent with the structural information we have (see Paper I)
as in half of the resolved sources the radio emission is
concentrated in the outermost third of its extent.
The model parameters are:
as a function of LS,
at the three frequencies.
In one model we have assumed that the source brightness is uniform over the whole source
extent (lower curve), while in the second, the brightness distribution is
concentrated in the outermost thirds. This second model
is consistent with the structural information we have (see Paper I)
as in half of the resolved sources the radio emission is
concentrated in the outermost third of its extent.
The model parameters are:
![\begin{figure}
\par\includegraphics[angle=-90,width=8.5cm,clip]{0460f14a.ps}\hspace*{2mm}
\includegraphics[angle=-90,width=8.8cm,clip]{0460f14b.ps}
\end{figure}](/articles/aa/full/2004/44/aa0460-04/img211.gif) |
Figure 14:
Distribution vs. red-shift of the intrinsic
( left) and of the observed ( right) Faraday Dispersion.
In both figures a circle marks the objects from Table 6;
a plus sources with a more uncertain Faraday Dispersion (see text);
a square photometric red-shifts.
The curve on the right panel represents the expected
|
| Open with DEXTER | |
Models of this type account fairly well for the
sharp increase in fractional polarization at ![]() 3-6 kpc, the change
occurring first at 8.5 GHz, soon thereafter at 5 GHz and then at 1.4 GHz.
There is a large dispersion around the models, which
is a consequence of the dispersion in the values of m0 (Fig. 12) and
3-6 kpc, the change
occurring first at 8.5 GHz, soon thereafter at 5 GHz and then at 1.4 GHz.
There is a large dispersion around the models, which
is a consequence of the dispersion in the values of m0 (Fig. 12) and
![]() (Fig. 11)
and of the
(Fig. 11)
and of the
![]() relation discussed in
Sect. 5.3.
At 8.5 GHz, the sources lying above the model lines do have
relation discussed in
Sect. 5.3.
At 8.5 GHz, the sources lying above the model lines do have
![]() whilst the
opposite is true for those lying below the models. On the other hand, at 1.4 GHz
it is the dispersion on
whilst the
opposite is true for those lying below the models. On the other hand, at 1.4 GHz
it is the dispersion on
![]() which plays the dominant role.
At 5 GHz there are mixed contributions.
which plays the dominant role.
At 5 GHz there are mixed contributions.
The effect of the spread in
![]() on the dispersion of the
data-points around the model is better seen in Fig. 9
which displays the depolarization ratios
DP4.98.5 and
DP1.48.5. These are independent of m0 (and of its dispersion).
This figure shows that the values of the parameters we have adopted in
Eq. (4) properly describe the upper envelope of the
distribution.
The data-points close to it have values of
on the dispersion of the
data-points around the model is better seen in Fig. 9
which displays the depolarization ratios
DP4.98.5 and
DP1.48.5. These are independent of m0 (and of its dispersion).
This figure shows that the values of the parameters we have adopted in
Eq. (4) properly describe the upper envelope of the
distribution.
The data-points close to it have values of
![]() near the peak of the distribution of
near the peak of the distribution of
![]() displayed
in Fig. 11.
Those below the two model lines require larger values of
displayed
in Fig. 11.
Those below the two model lines require larger values of
![]() ,
typical of the tail of the
,
typical of the tail of the
![]() distribution.
Most of the latter points are high red-shift objects (see Sect. 5.3).
For these, a lower
value of
distribution.
Most of the latter points are high red-shift objects (see Sect. 5.3).
For these, a lower
value of ![]() (
(![]() 1.0), namely a flatter distribution of the
Faraday medium, is required to keep the same value of F.
1.0), namely a flatter distribution of the
Faraday medium, is required to keep the same value of F.
Finally we note that in the small size range (
![]() kpc) the
models displayed in Fig. 8 predict zero fractional
polarization, while several of the displayed points differ
from zero. Whilst many more small sources with
no significant polarization at any frequency cannot be displayed in these
plots, we
note that it is a characteristic of the Burn model
that fractional polarization goes to zero at increasing Faraday dispersions.
Had we used the Tribble model, the asymptotic values for
DP4.98.5 and
for
DP1.48.5 at increasing
kpc) the
models displayed in Fig. 8 predict zero fractional
polarization, while several of the displayed points differ
from zero. Whilst many more small sources with
no significant polarization at any frequency cannot be displayed in these
plots, we
note that it is a characteristic of the Burn model
that fractional polarization goes to zero at increasing Faraday dispersions.
Had we used the Tribble model, the asymptotic values for
DP4.98.5 and
for
DP1.48.5 at increasing
![]() (decreasing LS) would have been
(decreasing LS) would have been ![]() 0.34 and 0.03 respectively,
which would be in better agreement with the data.
0.34 and 0.03 respectively,
which would be in better agreement with the data.
We consider two possibilities for the medium responsible of the depolarization effects.
i) A smooth medium with a King-like density distribution,
![]() ,
with a
magnetic field intensity
,
with a
magnetic field intensity
![]() ,
where B0 is the central magnetic field. In the case of
equipartition between magnetic and thermal energy,
,
where B0 is the central magnetic field. In the case of
equipartition between magnetic and thermal energy,
![]() for the isothermal case and
for the isothermal case and
![]() /6 for the adiabatic case.
If B is frozen into the matter then
/6 for the adiabatic case.
If B is frozen into the matter then
![]() .
The field orientation is assumed to be uniform within "cells'' of
size
.
The field orientation is assumed to be uniform within "cells'' of
size ![]() and to change randomly from cell to cell, producing
a Gaussian distribution of Faraday rotation (Sect. 5.1).
In this model (see, e.g. Dolag et al. 2001), the Faraday
dispersion is given by Eq. (4) with
and to change randomly from cell to cell, producing
a Gaussian distribution of Faraday rotation (Sect. 5.1).
In this model (see, e.g. Dolag et al. 2001), the Faraday
dispersion is given by Eq. (4) with
In order to disentangle B0, n0 and ![]() from each other,
additional assumptions are required. For instance, if we assume that
thermal and magnetic energy are roughly in equipartition, as discussed
by Rees (1987), assuming
from each other,
additional assumptions are required. For instance, if we assume that
thermal and magnetic energy are roughly in equipartition, as discussed
by Rees (1987), assuming
![]() K for the medium,
K for the medium,
![]() kpc,
kpc,
![]() and
and
![]() ,
we get the following values:
,
we get the following values:
ii) A clumpy medium of magnetized clouds of size
![]() and filling factor f0, whose space density decreases as
and filling factor f0, whose space density decreases as
![]() ,
with
,
with
![]() .
In this case it is easily shown that the Faraday dispersion is given
again by Eq. (4), with
.
In this case it is easily shown that the Faraday dispersion is given
again by Eq. (4), with
![]() .
.
If we assume that these clouds are those emitting the Narrow Lines,
taking fiducial values of
n0 = 104 atoms cm-3 and
f0 =
10-4, to produce
![]() we need:
we need:
![\begin{displaymath}N_{\rm cl,los}(R) = \frac{\displaystyle{f_0 r_{\rm c}}}
{\displaystyle{d_{\rm cl} [1+(R/r_{\rm c})^2]^{3\gamma - 0.5}}}\end{displaymath}](/articles/aa/full/2004/44/aa0460-04/img237.gif)
Alternatively we may assume that the NL clouds are distributed in a
sheath around the lobes, as suggested by HST observations (e.g. de
Vries et al. 1999; Axon et al. 2000), being
produced by shocks driven by the lobe expansion (see, e.g., Bicknell
et al. 1997).
In this case, the filling factor in the sheath is certainly large,
increasing the covering factor, which however, according to the above
equations, still drops too fast for
![]() .
.
In conclusion, the NL clouds alone do not seem the best candidates
for depolarization. However we may speculate that they play a role at
![]() ,
while for
,
while for
![]() the smooth medium takes over.
the smooth medium takes over.
In Sect. 4.4 (Fig. 6) we have shown that there
is some correlation between the rotation angle
![]() and the depolarization ratio. The
Rotation Measures we have derived in Sect. 4.3 are not
too different from the Rotation Measures required by the observed
depolarization. Furthermore, we have found that in a large fraction of
sources the rotation angle seems to follow the
and the depolarization ratio. The
Rotation Measures we have derived in Sect. 4.3 are not
too different from the Rotation Measures required by the observed
depolarization. Furthermore, we have found that in a large fraction of
sources the rotation angle seems to follow the ![]() law down to 1.4 GHz.
law down to 1.4 GHz.
These findings are somewhat unexpected in models for the Faraday screen
characterised by cells much smaller than the source size and a randomly
oriented magnetic field.
In these cases, one does not expect much global Faraday rotation nor
the angle to change with ![]() over a broad wavelength range.
over a broad wavelength range.
It appears that our findings require more sophisticated models which include cells with a broad range of sizes such that the small ones depolarize the radiation while the largest ones produce coherent rotation of the polarization angle. As there is no way to develop an analytic model of the expected RM for Faraday screens with a spectrum of cell sizes, numerical simulations need to be used, as in Murgia et al. (2004). We plan to use this approach in future work.
According to Table 6 and Fig. 12, the intrinsic degree
of polarization of CSSs with
![]() has a median
value
has a median
value ![]()
![]() ,
extending up to
,
extending up to ![]() 15%. Recently Ricci
et al. (2004) have observed in polarization at 18.5 GHz a
sample of 258 radio sources from the Kühr et al. (1981) 1 Jy
sample using the Australian Telescope Compact Array. Of these, 71 sources have a steep spectrum and are unresolved at their resolution
(15.6 arcsec), therefore they are likely to be mostly CSSs/GPSs. The
median fractional polarization at 18.5 GHz of this sub-sample is
15%. Recently Ricci
et al. (2004) have observed in polarization at 18.5 GHz a
sample of 258 radio sources from the Kühr et al. (1981) 1 Jy
sample using the Australian Telescope Compact Array. Of these, 71 sources have a steep spectrum and are unresolved at their resolution
(15.6 arcsec), therefore they are likely to be mostly CSSs/GPSs. The
median fractional polarization at 18.5 GHz of this sub-sample is ![]() 4.8+2-1%. Given the high observing frequency this
can be taken as a good estimate of m0 and agrees fairly well with
our measurement.
4.8+2-1%. Given the high observing frequency this
can be taken as a good estimate of m0 and agrees fairly well with
our measurement.
It is interesting to compare these figures with the corresponding ones for radio sources of much larger size, to see if there are any differences between the two populations. Unfortunately, to our knowledge, there are not many samples of sources for which unbiased polarization data are available. We have chosen two samples of large size radio sources to be compared with ours.
The first sample is that of Klein et al. (2003). As it was
originally selected at 10.5 GHz, this sample is biased in favour of
sources strongly polarized at that frequency.
Nevertheless the authors stress that from their data an unbiased
sample of 208 B3-VLA sources can be defined, for which the fractional
polarization at 10.5 GHz is known without biases down to ![]()
![]() .
We have extracted from this a sub-sample of 90 sources with
.
We have extracted from this a sub-sample of 90 sources with
![]() kpc and have examined its fractional polarization
distribution at 10.5 GHz.
A third of the sources have
kpc and have examined its fractional polarization
distribution at 10.5 GHz.
A third of the sources have
![]() %, with values
extending up to
%, with values
extending up to ![]() 15%. These figures are similar to those of
our sample in the range
15%. These figures are similar to those of
our sample in the range
![]() .
However the median value,
.
However the median value,
![]() %, is
significantly lower than ours. It is unclear at the moment if this
difference is real or if it is due to some unknown selection effect.
%, is
significantly lower than ours. It is unclear at the moment if this
difference is real or if it is due to some unknown selection effect.
For the second comparison we have taken the sample of sources from
Garrington et al. (1991), and from their data we have computed
the integrated polarization at 5 GHz.
Their distribution of the
![]() has a median around 5.5%,
slightly larger than our median value of
has a median around 5.5%,
slightly larger than our median value of ![]()
![]() .
However we note that their sample is not complete and it is likely
that it is biased in favour of polarized sources. On the other hand,
.
However we note that their sample is not complete and it is likely
that it is biased in favour of polarized sources. On the other hand,
![]() may underestimate the intrinsic polarization. We suspect
that the first bias likely plays a greater role.
may underestimate the intrinsic polarization. We suspect
that the first bias likely plays a greater role.
Although these comparisons are, for different reasons, somewhat
uncertain, we tend to believe that our large CSSs do not
differ significantly from their much bigger cousins as far as the
intrinsic fractional polarization is concerned. This, in turn, implies
that the order of the source magnetic field has already reached a
maximum at sizes ![]() 5-10 kpc.
5-10 kpc.
We have pointed out that in several of the resolved sources, the components show asymmetries in rotation angle or depolarization or both. Recently Saikia & Gupta (2003) have also shown evidence for large polarization asymmetries in CSSs. According to our models for depolarization, in which the depolarization seems better accounted for by an external smooth medium, one would be led to ascribe the above asymmetries to the Laing-Garrington effect (Laing 1988; Garrington et al. 1988). The less depolarized (or less Faraday rotated) source component would be the one approaching us, the one with the greater arm length, and the one with a bright Doppler boosted jet, while the more depolarized (or Faraday rotated) one would be the receding shorter one and the one with a fainter jet (if any).
However, it is known that in a number of cases it is found that the jetted lobe is shorter than the other. Therefore, an alternative scenario has been suggested in which the depolarizing medium is not spherically symmetric and the two lobes experience in their expansion significantly different gas densities (see e.g. Thomasson et al. 2003; Junor et al. 1999). In this scenario the more depolarized (or Faraday rotated) lobe would then be the one expanding through the denser gas and would be more slowed down. Therefore, it would still be the closer to the core but no relation with the jet sidedness is necessarily expected. Saikia & Gupta (2003) discuss the propagation of jets in an asymmetric environment, which they suggest to be the result of infall of interstellar material into the central kpc region caused by the interaction or merger with a companion galaxy. Our data do not allow us to test the two alternatives as in the majority of cases we have not yet detected the cores and have not enough resolution to see which is the jetted lobe.
This distribution (not shown) provides a mild indication that large
angles of E vector with respect to the source major axis may be
preferred (i.e. the magnetic field seems to be preferentially oriented
parallel to the source axis). This is similar to what found for large
size sources from the data of Garrington et al. (1991), where,
using the integrated polarization angle at 4.9 GHz, ![]() ,
it is
found that
,
it is
found that ![]() 70% of the objects show this behaviour.
Nevertheless statistical tests show that in our case the observed
distributions is consistent with a flat distribution at a
70% of the objects show this behaviour.
Nevertheless statistical tests show that in our case the observed
distributions is consistent with a flat distribution at a
![]() 80% confidence level.
No difference is found between the smaller and the larger sources
in the sample.
80% confidence level.
No difference is found between the smaller and the larger sources
in the sample.
The main results of this paper are the following:
Acknowledgements
We thank the meticulous anonymous referee for the numeorus very detailed comments which greatly helped in improving the paper's style. This work has been partially supported by the Italian MIUR under grant COFIN-2002-02-8118. The VLA is operated by the US National Radio astronomy Observatory which is operated by Associated Universities, Inc., under cooperative agreement with the National Science Foundation.
Table A.1: The B3-VLA sample of CSS.
Table A.2: High Resolution data (errors in parenthesis).
Table A.3: Low Resolution data (error in parenthesis).
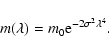
![\begin{displaymath}\left <\vert m(\lambda)\vert^2\right>=
m_0^2\left [\frac{\dis...
...b^2/s_0^2}}
+{\rm e}^{-(s_0^2/2b^2+4\sigma^2\lambda^4)}\right]
\end{displaymath}](/articles/aa/full/2004/44/aa0460-04/img150.gif)
![\begin{displaymath}m(\lambda)\approx m_0\left[\frac{s_0/b}{2\sigma\lambda^2\sqrt2}\right]
\end{displaymath}](/articles/aa/full/2004/44/aa0460-04/img153.gif)