Recently available near-infrared interferometric data on late-type stars show a strong increase of diameter for asymptotic giant branch (AGB) stars between the K (
A&A 418, 151-162 (2004)
DOI: 10.1051/0004-6361:20040057
P. Schuller1,2 - P. Salomé3 - G. Perrin4 - B. Mennesson5 - G. Niccolini6 - P. de Laverny6 - S. T. Ridgway4,7 - V. Coudé du Foresto4 - W. A. Traub2
1 -
Max-Planck-Institut für Astronomie, Königstuhl 17, 69117 Heidelberg, Germany
2 -
Harvard-Smithsonian Center for Astrophysics, MS-20, 60 Garden Street, Cambridge, MA 02138, USA
3 -
Observatoire de Paris, LERMA, 61 avenue de l'Observatoire, 75014 Paris, France
4 -
Observatoire de Paris, LESIA, 5 place Jules Janssen, 92195 Meudon, France
5 -
Jet Propulsion Laboratory, MS 306-388, 4800 Oak Grove Drive, Pasadena, CA 91109, USA
6 -
Observatoire de la Côte d'Azur, Département Fresnel UMR 6528, BP 4229, 06304 Nice, France
7 -
National Optical Astronomy Observatories, PO Box 26732, Tucson, AZ 85726, USA
Received 13 March 2003 / Accepted 15 January 2004
Abstract
Recently available near-infrared interferometric data on late-type stars
show a strong increase of diameter for asymptotic giant branch (AGB) stars
between the K (
![]() )
and L (
)
and L (
![]() ) bands.
Aiming at an explanation of these findings,
we chose the objects
) bands.
Aiming at an explanation of these findings,
we chose the objects
![]() Orionis (Betelgeuse), SW Virginis, and R Leonis,
which are of different spectral types and stages of evolution,
and which are surrounded by circumstellar envelopes
with different optical thicknesses.
For these stars, we compared observations with spherically symmetric dust shell models.
Photometric and
Orionis (Betelgeuse), SW Virginis, and R Leonis,
which are of different spectral types and stages of evolution,
and which are surrounded by circumstellar envelopes
with different optical thicknesses.
For these stars, we compared observations with spherically symmetric dust shell models.
Photometric and
![]() interferometric data
were also taken into account to further constrain the models. -
We find the following results.
For all three AGB stars, the photosphere and
dust shell model is consistent with the multi-wavelength photometric data.
For
interferometric data
were also taken into account to further constrain the models. -
We find the following results.
For all three AGB stars, the photosphere and
dust shell model is consistent with the multi-wavelength photometric data.
For ![]() Orionis the model dust shell has a very small optical depth (0.0065 at
Orionis the model dust shell has a very small optical depth (0.0065 at
![]() );
the visibility data and model in K and L are essentially entirely
photospheric with no significant contribution from the dust,
and the visibility data at
);
the visibility data and model in K and L are essentially entirely
photospheric with no significant contribution from the dust,
and the visibility data at
![]() show a strong dust signature
which agrees with the model.
For SW Virginis the model dust shell has a small optical depth (0.045 at
show a strong dust signature
which agrees with the model.
For SW Virginis the model dust shell has a small optical depth (0.045 at
![]() );
in K the visibility data and model are essentially purely photospheric,
in L the visibility data demand a larger object than the photosphere plus dust
model allows,
and at
);
in K the visibility data and model are essentially purely photospheric,
in L the visibility data demand a larger object than the photosphere plus dust
model allows,
and at
![]() there was no data available.
For R Leonis the model dust shell has a moderate optical depth (0.1 at
there was no data available.
For R Leonis the model dust shell has a moderate optical depth (0.1 at
![]() );
in K and L the visibility data and model situation is similar to that of SW Vir,
and at
);
in K and L the visibility data and model situation is similar to that of SW Vir,
and at
![]() the visibility data and model are in agreement. -
We conclude that AGB models comprising a photosphere and dust shell,
although consistent with SED data and also interferometric data in K and at
the visibility data and model are in agreement. -
We conclude that AGB models comprising a photosphere and dust shell,
although consistent with SED data and also interferometric data in K and at
![]() ,
cannot explain the visibility data in L;
an additional source of model opacity, possibly related to a gas component,
is needed in L to be consistent with the visibility data.
,
cannot explain the visibility data in L;
an additional source of model opacity, possibly related to a gas component,
is needed in L to be consistent with the visibility data.
Key words:
techniques: interferometric - radiative transfer -
infrared: stars - stars: late-type - stars: circumstellar matter -
stars: individual: ![]() Orionis, SW Virginis, R Leonis
Orionis, SW Virginis, R Leonis
Supergiant stars and stars on the Asymptotic Giant Branch (AGB) are surrounded by a dust envelope coupled with gas; for example, see Habing (1996) for a review of these objects, Willson (2000) for a review of mass loss, and Tsuji (2000) for evidence of H2O shells around supergiants.
AGB stars are subject to pulsation and other surface phenomena (shock waves, acoustic waves etc., see Lafon & Berruyer 1991) that levitate matter above the stellar photosphere. Dust grains appear in the envelope at altitudes where the temperature falls below the condensation temperature. The radiation pressure drives the dust grain overflow far from the star up to distances of a thousand stellar radii causing mass-loss.
The mechanism for mass loss in supergiants is not so clear. The main difference compared to Mira stars is that due to the larger luminosity of supergiants the atmosphere is much more extended and has a much greater pressure scale height. Therefore, the mass loss may have a different driving force although pulsation may also play a role.
Both kinds of stars are characterised
by their large diameter and strong luminosity
and are consequently very good candidates for infrared interferometry.
In the next section, we briefly present the instruments
which were used to acquire the interferometric data discussed in this paper,
namely FLUOR in the K band (
![]() )
and TISIS in the L band (
)
and TISIS in the L band (
![]() ).
We selected three particular stars of three different types
for which we have a substantial set of data:
the supergiant
).
We selected three particular stars of three different types
for which we have a substantial set of data:
the supergiant ![]() Ori, the semi-regular SW Vir, and the Mira-type star R Leo.
Furthermore, their envelopes have quite differing optical thicknesses.
It appears that for the objects with large optical depth (SW Vir and R Leo)
the observed diameters in L are considerably larger than
the respective K band diameters
(see Sect. 2.3).
Measurements in the L band are more sensitive
to cooler material above the stellar
photosphere than are the K band data.
The question is: what is the physical nature of these layers?
One possibility might be astronomical dust.
Dust reprocesses the star radiation, in particular in the infrared.
Depending on the dust abundance,
the star's L band radiation might be superposed by a dust contribution
that probes the inner region of the dust envelope
at a few stellar radii away from the star.
The measured L band radius might consequently be increased
compared to the K band, which is mainly fed by stellar emission.
Ori, the semi-regular SW Vir, and the Mira-type star R Leo.
Furthermore, their envelopes have quite differing optical thicknesses.
It appears that for the objects with large optical depth (SW Vir and R Leo)
the observed diameters in L are considerably larger than
the respective K band diameters
(see Sect. 2.3).
Measurements in the L band are more sensitive
to cooler material above the stellar
photosphere than are the K band data.
The question is: what is the physical nature of these layers?
One possibility might be astronomical dust.
Dust reprocesses the star radiation, in particular in the infrared.
Depending on the dust abundance,
the star's L band radiation might be superposed by a dust contribution
that probes the inner region of the dust envelope
at a few stellar radii away from the star.
The measured L band radius might consequently be increased
compared to the K band, which is mainly fed by stellar emission.
In Sect. 3, the modelling of the dust envelopes around these stars by a radiative transfer code is explained and the parameters of the model are described. In Sect. 4, we compare the model output with the interferometric and photometric data. Finally, in Sect. 5 we discuss the limits of such models and the questions they raise about the L band observations.
The stars discussed here were observed with the IOTA (Infrared-Optical Telescope Array) interferometer operating (at that time) with two telescopes (Traub 1998). IOTA is located at the Smithsonian Institution's Whipple Observatory on Mount Hopkins, Arizona. It offers multiple baseline observations providing visibilities at different spatial frequencies. This enables a model-fit to the visibility data to obtain information on the spatial intensity distribution of the sources. The beams were combined with FLUOR (Fiber Linked Unit for Optical Recombination) in the K band (Coudé du Foresto et al. 1998) and with its extension to the L band TISIS (Thermal Infrared Stellar Interferometric Set-up, Mennesson et al. 1999). Beam combination with FLUOR is achieved by a single-mode fluoride glass triple coupler. The fibres filter the wavefronts corrugated by the atmospheric turbulence. The phase fluctuations are traded against photometric fluctuations which are monitored for each beam to correct for them a posteriori. The accuracy on visibility estimates measured by FLUOR is usually better than 1% for most sources (Perrin et al. 1998) and can be as good as 0.2% (Perrin 2003).
TISIS is the extension of FLUOR
to the thermal infrared (
![]() ).
A single coupler is used as beam combiner and photometric signals are not monitored.
Approximate correction of turbulence-induced flux fluctuations
is achieved with the low-frequency part of the interferometric signal.
Accuracy in the L band
is therefore not as good as in the K band, but still better than
without spatial filtering by fibres.
The acquisition protocol is also
different from that of the K band,
since ground-based interferometric
observations encounter a new difficulty at
).
A single coupler is used as beam combiner and photometric signals are not monitored.
Approximate correction of turbulence-induced flux fluctuations
is achieved with the low-frequency part of the interferometric signal.
Accuracy in the L band
is therefore not as good as in the K band, but still better than
without spatial filtering by fibres.
The acquisition protocol is also
different from that of the K band,
since ground-based interferometric
observations encounter a new difficulty at
![]() .
Thermal background emission produces a fluctuating photometric offset
which must be correctly subtracted in order to achieve a good calibration.
Hence each source observation must be bracketed
by a sky background measurement (chopping)
that reduces the instrument efficiency.
.
Thermal background emission produces a fluctuating photometric offset
which must be correctly subtracted in order to achieve a good calibration.
Hence each source observation must be bracketed
by a sky background measurement (chopping)
that reduces the instrument efficiency.
Table 1: Some basic parameters of the studied objects taken from the General Catalogue of Variable Stars (Kholopov et al. 1998). The distances come from the HIPPARCOS catalogue (Perryman et al. 1997).
We chose to include three stars in our study which span different
spectral types and stages of evolution,
namely the supergiant ![]() Orionis (Betelgeuse),
the semi-regular variable SW Virginis, and the Mira star R Leonis.
Some basic parameters of these objects are compiled in Table 1.
These stars are also some of the most observed in our sample.
The L band data are extracted from Chagnon et al. (2002) -
we have used the data from the February-March 2000 observations.
The K band data for
Orionis (Betelgeuse),
the semi-regular variable SW Virginis, and the Mira star R Leonis.
Some basic parameters of these objects are compiled in Table 1.
These stars are also some of the most observed in our sample.
The L band data are extracted from Chagnon et al. (2002) -
we have used the data from the February-March 2000 observations.
The K band data for ![]() Orionis were presented in
Perrin et al. (2003a) and observations cover the period February 1996
to March 1997.
The K band data for SW Virginis were collected in May 2000
and are presented in Perrin (2003).
Lastly, the K band data for R Leonis were published in Perrin et al. (1999)
and were collected in April 1996 and March 1997.
Except for SW Virginis,
there is a large time difference between the dates
of the L band and K band data acquisitions.
We believe this to not be a major issue -
although these stars are known to be variable,
the effects we want to analyse are
slower than the periodic changes of stars and larger in amplitude.
Orionis were presented in
Perrin et al. (2003a) and observations cover the period February 1996
to March 1997.
The K band data for SW Virginis were collected in May 2000
and are presented in Perrin (2003).
Lastly, the K band data for R Leonis were published in Perrin et al. (1999)
and were collected in April 1996 and March 1997.
Except for SW Virginis,
there is a large time difference between the dates
of the L band and K band data acquisitions.
We believe this to not be a major issue -
although these stars are known to be variable,
the effects we want to analyse are
slower than the periodic changes of stars and larger in amplitude.
In order to get the best constraints on the dust shell model spatial
distribution, we have included interferometric data acquired with ISI
(Infrared Spatial Interferometer, Hale et al. 2000) at
![]() as published by Danchi et al. (1994).
as published by Danchi et al. (1994).
A journal of all used data points is given in Table 2.
Table 2:
Journal of interferometric data.
K band (FLUOR) data for ![]() Orionis have been presented in Perrin et al. (2003a), for SW Virginis in Perrin (2003), and for R Leonis in Perrin et al. (1999).
All L band (TISIS) data were taken from Chagnon et al. (2002).
The ISI data points for
Orionis have been presented in Perrin et al. (2003a), for SW Virginis in Perrin (2003), and for R Leonis in Perrin et al. (1999).
All L band (TISIS) data were taken from Chagnon et al. (2002).
The ISI data points for ![]() Orionis and R Leonis were extracted from Danchi et al. (1994) using the DEXTER online tool at ADS (2003). No exact position angle was given along with the ISI data, therefore we indicated the basic geographic orientation of the baselines used.
Where known for the objects, the phase
Orionis and R Leonis were extracted from Danchi et al. (1994) using the DEXTER online tool at ADS (2003). No exact position angle was given along with the ISI data, therefore we indicated the basic geographic orientation of the baselines used.
Where known for the objects, the phase ![]() of the visual variability was indicated.
of the visual variability was indicated.
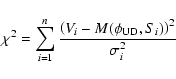
The visibilities Vi, and their standard deviations ![]() ,
in the K and L bands were fitted
by a uniform disk model by minimising the quantity:
,
in the K and L bands were fitted
by a uniform disk model by minimising the quantity:
The best fit uniform disk radii, and standard deviations, are listed in Table 3. The last column is the ratio of the L band and K band diameters. It is very close to 1 in the case of Betelgeuse, but the difference is 20-30% for the other two stars.
In the next sections, we investigate the possibility that dust envelopes around the star may be the cause for the diameter variations from K to L.
Table 3:
Uniform disk radii ![]() in the L and K bands.
in the L and K bands.
The models used in this paper are based on a radiative transfer code maintained at the Observatoire de la Côte d'Azur in Nice, France. A description of the code is presented by Niccolini et al. (2003). We discuss hereafter the main hypotheses and parameters of this model.
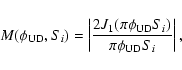
The code is based on the modelling of stellar radiation and circumstellar dust envelope interaction by a Monte Carlo method, assuming thermal equilibrium. The star is assumed to be a blackbody whose emitted energy is split in a number of packets, or "photons''. These photons can either pass the envelope directly, or they are scattered once or more in the envelope, or the photons are absorbed and then thermally re-emitted by the dust grains. A grid over the dust envelope is defined with radial zones and angular sections, with the resolution accounting for expected temperature gradients. From the resulting temperature profile, the code derives the spectral energy distribution (SED) for the three individual photon flux contributions mentioned above. Initially, the stellar radius is left as scaling factor. Assigning a specific stellar radius, the total SED can be compared to photometric data in order to constrain the model. Absorption, emission, and scattering by gaseous components are not taken into account.
Furthermore, the spatial flux distribution at a given wavelength can be derived,
i.e., a model image of the object at this wavelength can be created.
The Fourier transform of the model image can be compared to visibilities
measured at that wavelength which yields a further constraint to the model.
For the purpose of producing the image, the code allows a zooming factor
while the image dimensions are always fixed at
![]() pixels.
pixels.
The code offers several parameters that can be chosen.
The size distribution s(a) of spherical dust particles
having the radius a was set as
![]() ,
according to the interstellar medium (Mathis et al. 1977)
and independent of the distance from the star.
The radius a was contained in the range
,
according to the interstellar medium (Mathis et al. 1977)
and independent of the distance from the star.
The radius a was contained in the range
![]() .
.
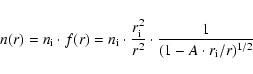
The particle density distribution n(r) of the dust grains that was used in this study includes acceleration effects on dust by radiation pressure and gas drag (see Appendix A). The resulting density distribution is much more peaked at the inner edge of the envelope than is a r-2 distribution.
For our study, the dust particle material was constrained to
astronomical silicates.
Their complex dielectric function (respectively complex refractive index)
is given by Draine & Lee (1984).
It was sampled at 37 wavelengths between
![]() and
and
![]() ,
with the sample points considering local extrema.
,
with the sample points considering local extrema.
The previously mentioned parameters
were chosen in consistency with the relevant subset of studies reported by Danchi et al. (1994).
They were set and fixed in this study.
To fit the model to the data, the following input parameters were adjusted.
The stellar radius ![]() and
the stellar effective temperature
and
the stellar effective temperature ![]() govern the flux radiated by the star.
Spherical symmetry was assumed for a dust shell around the star
with an inner radius
govern the flux radiated by the star.
Spherical symmetry was assumed for a dust shell around the star
with an inner radius ![]() and an outer radius
and an outer radius ![]() ,
in units of
,
in units of ![]() .
Furthermore, the envelope is characterised by its optical depth,
.
Furthermore, the envelope is characterised by its optical depth,
![]() ,
which is defined for overall extinction (absorption and scattering).
It can be chosen at a given wavelength,
,
which is defined for overall extinction (absorption and scattering).
It can be chosen at a given wavelength, ![]() ,
expressed in
,
expressed in ![]() m.
m.
Since the code, as used for this study,
does not take into account possible changes of the dust properties
when heated beyond the dust condensation temperature,
the temperature map has to be checked accordingly for each set of parameters.
As condensation temperature for silicates,
we adopted
![]() (Gail & Sedlmayr 1998).
(Gail & Sedlmayr 1998).
We now study the case of three particular stars.
The question is whether a simple spherical dust shell model
can account for the large diameter differences observed in the K and L bands.
The goal is to find the stellar parameters
for which visibility points in the K and L bands and at
![]() are compatible and simultaneously in agreement with the photometric data.
are compatible and simultaneously in agreement with the photometric data.
Betelgeuse is a Semi-Regular (SRc) variable star of spectral type M 1I. It is a late-type supergiant star with a 2335-day period (see Table 1).
The mass-loss rate ![]() of
of ![]() Orionis is moderate.
Knapp et al. (1998) estimate a mass-loss rate from CO emission measurements
of
Orionis is moderate.
Knapp et al. (1998) estimate a mass-loss rate from CO emission measurements
of
![]() at HIPPARCOS distance
and with an outflow velocity
at HIPPARCOS distance
and with an outflow velocity
![]() .
Throughout this study, we adopt terminal outflow velocities from their work.
For a distance d of
.
Throughout this study, we adopt terminal outflow velocities from their work.
For a distance d of
![]() and an outflow velocity
and an outflow velocity
![]() ,
Danchi et al. (1994) yield a mass-loss rate of
,
Danchi et al. (1994) yield a mass-loss rate of
![]() .
With the HIPPARCOS parallax of
.
With the HIPPARCOS parallax of
![]() yielding a distance of
yielding a distance of
![]() ,
and
,
and
![]() ,
their mass-loss rate is updated to
,
their mass-loss rate is updated to
![]() ,
which is given in Table 4.
,
which is given in Table 4.
Table 4:
Mass-loss rate comparison.
The values for ![]() come from Knapp et al. (1998).
Data from Danchi et al. were re-evaluated at HIPPARCOS distance
(see Table 1)
following
come from Knapp et al. (1998).
Data from Danchi et al. were re-evaluated at HIPPARCOS distance
(see Table 1)
following
![]() .
.
We used low spectral resolution data from different catalogues
available at the SIMBAD (2003) Astronomical Database
to constrain the SED over a large range of wavelengths.
The TD1 catalogue provides fluxes around
![]() .
UBV measurements are reported in the GEN and UBV catalogues.
Fluxes in the UBVRIJHKL bands are taken from the JP11 Johnson catalogue.
The 12, 25, 60, and
.
UBV measurements are reported in the GEN and UBV catalogues.
Fluxes in the UBVRIJHKL bands are taken from the JP11 Johnson catalogue.
The 12, 25, 60, and
![]() fluxes are from the IRAS catalogue,
and Danchi et al. (1994) provide flux curves from 8 to
fluxes are from the IRAS catalogue,
and Danchi et al. (1994) provide flux curves from 8 to
![]() .
.
For Betelgeuse, having slight luminosity variations, we can easily compare visibility points from different epochs. This assumption will be fully justified by the fit we obtain.
Danchi et al. (1994) propose a spherical dust shell model to account for
ISI data in the thermal infrared.
This shell is supposed to have a small extent (
![]() ,
,
![]() )
quite far away from the central star and
to be optically very thin (
)
quite far away from the central star and
to be optically very thin (
![]() ).
It seems to indicate an episodic mass-loss process,
leading to an empty area between the star and its envelope.
We used these parameters (see Table 5)
to reproduce the shorter wavelength visibility points given by FLUOR and TISIS.
).
It seems to indicate an episodic mass-loss process,
leading to an empty area between the star and its envelope.
We used these parameters (see Table 5)
to reproduce the shorter wavelength visibility points given by FLUOR and TISIS.
Table 5:
Parameters adjusted for modelling (see Sect. 3.2).
![]() :
stellar temperature;
:
stellar temperature; ![]() :
stellar radius;
:
stellar radius;
![]() :
inner respectively outer radius of dust shell;
:
inner respectively outer radius of dust shell;
![]() :
optical depth of shell at
:
optical depth of shell at
![]() .
In all cases, an accelerated dust density profile was used.
.
In all cases, an accelerated dust density profile was used.
The effective stellar temperature of
![]() used by Danchi et al. (1994) is
fully consistent with the evaluation by Perrin et al. (2003a) giving
used by Danchi et al. (1994) is
fully consistent with the evaluation by Perrin et al. (2003a) giving
![]() and
and
![]() depending on models.
The stellar radius used in that model is
depending on models.
The stellar radius used in that model is
![]() ,
satisfactorily accounting for both the photometric data and interferometric data in the three bands.
This radius is close to the uniform disk model radii in the K and L bands of
,
satisfactorily accounting for both the photometric data and interferometric data in the three bands.
This radius is close to the uniform disk model radii in the K and L bands of
![]() and
and
![]() ,
respectively.
,
respectively.
![\begin{figure}
\par\includegraphics[width=8cm,height=7.5cm,clip]{3722-f1a}\hspac...
...ce*{2mm}
\includegraphics[width=8.5cm,height=7.5cm,clip]{3722-f1d}
\end{figure}](/articles/aa/full/2004/16/aa3722/img95.gif) |
Figure 1:
Model output for |
| Open with DEXTER | |
The SED of the model is shown
in Fig. 1.
Apart from the total flux from the object,
the plot also contains the contributions of the stellar flux attenuated by the circumstellar shell,
the distribution of the flux scattered by the dust grains in the shell (maximum at short wavelength),
and the thermal emission of the grains (maximum at longer wavelength).
As the SED shows, stellar radiation is prominent over a large wavelength range.
Flux emitted by dust becomes prominent only in a small band around
![]() .
.
Visibility curves are also plotted in Fig. 1. The K and L band visibility curves from the dust shell model resemble each other and show good superposition with the respective visibility curves of the uniform disk model. Apparently, the same structure is seen in these two bands. The SED plot indicates that this should be the stellar photosphere since in these two bands the direct stellar flux is roughly 103 times larger than the scattered part and about 105 times larger than the dust emission. One can conclude that the dust envelope, having a very small optical depth, has little influence on the intensity distribution at these wavelengths. The dust shell is transparent in K and L and the star is seen through the dust at these wavelengths. As a consequence, the dust shell model derived from the ISI data is fully consistent with the FLUOR and TISIS measurements.
As a further consistency check, yet with minor priority,
we computed a mass-loss rate ![]() from our model parameters
by a method similar to Danchi et al. (1994)
(see Appendix A for details).
With the set of parameters for
from our model parameters
by a method similar to Danchi et al. (1994)
(see Appendix A for details).
With the set of parameters for ![]() Ori,
we obtain a mass-loss rate of
Ori,
we obtain a mass-loss rate of
![]() ,
consistent with Danchi et al. (1994)
and roughly a factor of 5 higher than that of Knapp et al. (1998).
,
consistent with Danchi et al. (1994)
and roughly a factor of 5 higher than that of Knapp et al. (1998).
Although ![]() Ori has the lowest optical depth of the studied objects,
its mass-loss rate seems to be the highest.
The parameters used here indicate an episodic event in the past.
Yet, since this event the dust shell has expanded,
with its enlarged inner radius entering the computation.
For a further discussion of the mass-loss event see Danchi et al. (1994).
Ori has the lowest optical depth of the studied objects,
its mass-loss rate seems to be the highest.
The parameters used here indicate an episodic event in the past.
Yet, since this event the dust shell has expanded,
with its enlarged inner radius entering the computation.
For a further discussion of the mass-loss event see Danchi et al. (1994).
We now study the case of stars with circumstellar envelopes at higher optical depths.
The pulsation period of this M 7III semi-regular (SRb) variable star is 150 days.
Its main characteristics are recapitulated in Table 1.
The mass-loss rate is estimated by Knapp et al. (1998) to
![]() .
.
Photometric data are retrieved from the IRC catalogue for the I and K bands,
from the UBV catalogue in the respective filters,
from the IRAS catalogue at 12, 60,
![]() ,
and from Monnier et al. (1998) in the 8 to
,
and from Monnier et al. (1998) in the 8 to
![]() range.
The M band flux at
range.
The M band flux at
![]() comes from Wannier & Sahai (1986).
comes from Wannier & Sahai (1986).
To date, no 11-
![]() interferometric data is available for SW Virginis.
Benson et al. (1989) report observations by speckle interferometry in the N band
at spatial frequencies below
interferometric data is available for SW Virginis.
Benson et al. (1989) report observations by speckle interferometry in the N band
at spatial frequencies below
![]() .
Since they do not provide measured data directly,
but rather give some model parameters,
this has not been considered here.
It is therefore not possible to assess the
consistency of the spatial model between all bands for this object.
.
Since they do not provide measured data directly,
but rather give some model parameters,
this has not been considered here.
It is therefore not possible to assess the
consistency of the spatial model between all bands for this object.
For SW Vir, Perrin et al. (1998) give an effective temperature of
![]() ,
as derived from the bolometric flux and the limb-darkened diameter.
Consistent with this value,
the effective temperature was set to
,
as derived from the bolometric flux and the limb-darkened diameter.
Consistent with this value,
the effective temperature was set to
![]() .
For the parameters of the dust shell
we chose to adopt
.
For the parameters of the dust shell
we chose to adopt
![]() and
and
![]() ,
as proposed by van der Veen et al. (1995) on the basis of sub-mm observations.
Applying an optical depth
,
as proposed by van der Veen et al. (1995) on the basis of sub-mm observations.
Applying an optical depth
![]() and assuming a stellar radius of
and assuming a stellar radius of
![]() then accounts for flux data at low spectral resolution.
then accounts for flux data at low spectral resolution.
Danchi et al. (1994) make a distinction between two classes of objects. The first class has a cold circumstellar envelope far from the star (beyond 10 stellar radii), while objects of the second class are surrounded by a warmer dust envelope, near the star (at about 2 or 3 stellar radii). The mass-loss process is different for these two classes. For the second class, the mass-loss process is more continuous than for the first one. SW Virginis has been classified in the past as a Mira star, hence with a somewhat regular mass-loss. Yet, its current classification as a semi-regular variable, possibly a precursor of a Mira star, makes its mass-loss more likely to be irregular, consistently with its irregular photometric variations. It is therefore very tempting to identify it as a member of the first class. The preferred set of parameters obtained for this star is summarised in Table 5. A large optical depth and a large shell extent are necessary to reproduce the photometric contribution of dust at large wavelengths.
![\begin{figure}
\par\includegraphics[width=8cm,height=7.5cm,clip]{3722-f2a}\hspac...
...ce*{2mm}
\includegraphics[width=8.5cm,height=7.5cm,clip]{3722-f2d}
\end{figure}](/articles/aa/full/2004/16/aa3722/img109.gif) |
Figure 2:
Model output for SW Vir.
Top left and right: modelled visibility curve with interferometric data for the K and L bands;
bottom left: expected visibility curve for the N band;
bottom right: modelled spectral energy distribution with photometric data.
Model parameters (see Table 5):
|
| Open with DEXTER | |
As Fig. 2 shows,
the contribution of dust emission to the SED in the K and L bands of SW Virginis
is more important than in the case of ![]() Ori,
i.e., it is higher in relation to the direct flux.
This can be attributed to the larger optical depth.
SW Virginis has some infrared excess that requires a dust shell.
However, the dust cannot be too warm, otherwise it would produce a much larger
infrared excess than is compatible with the SED.
Ori,
i.e., it is higher in relation to the direct flux.
This can be attributed to the larger optical depth.
SW Virginis has some infrared excess that requires a dust shell.
However, the dust cannot be too warm, otherwise it would produce a much larger
infrared excess than is compatible with the SED.
From this model, visibility curves were derived.
Although comparatively few visibility measurements are available for this object,
it is obvious that the single dust shell model
is not simultaneously compatible with the K and L band data.
Again, model visibility curves are similar in K and L
which lets us assume that we see the same structure, i.e. the stellar photosphere.
This is also reflected by the SED for which a similar reasoning applies
like in the case of ![]() Ori.
Indeed, the dust being quite far away from the photosphere,
the K band data are well reproduced by the visibility model.
However, the dust is too cold and optically too thin
to lead to a significant increase of
the diameter at larger wavelengths compatible with the L band data.
A simple dust shell model, therefore, cannot account for both the
interferometric and the photometric data.
Unfortunately, no ISI data are available for this star.
They would have been very useful to help
model the dust shell and place stronger constraints on it.
Ori.
Indeed, the dust being quite far away from the photosphere,
the K band data are well reproduced by the visibility model.
However, the dust is too cold and optically too thin
to lead to a significant increase of
the diameter at larger wavelengths compatible with the L band data.
A simple dust shell model, therefore, cannot account for both the
interferometric and the photometric data.
Unfortunately, no ISI data are available for this star.
They would have been very useful to help
model the dust shell and place stronger constraints on it.
The mass-loss rate we obtain from our parameters is
![]() ,
which is roughly consistent with the one of Knapp et al. (1998).
,
which is roughly consistent with the one of Knapp et al. (1998).
R Leonis is a Mira-type long-period variable
with a period of ![]() 310 days
and of late spectral type M 8IIIe (see Table 1).
Its mass-loss rate is indicated by Knapp et al. (1998)
as
310 days
and of late spectral type M 8IIIe (see Table 1).
Its mass-loss rate is indicated by Knapp et al. (1998)
as
![]() ,
whereas the estimate by Danchi et al. (1994) can be updated to
,
whereas the estimate by Danchi et al. (1994) can be updated to
![]() .
.
R Leonis is known to have a very strong infrared excess and very steady pulsations which makes it very different from SW Virginis. R Leonis shows large photometric variations, especially at short wavelengths. The problem here is to synthesise a low spectral resolution SED, as well as visibility curves, for a star with large photometric variations. Nevertheless, we decided to include all available data points (both photometric and interferometric) into the plots despite the object variability which will allow a larger range of acceptable model parameters.
For R Leonis, UBV measurements can be found in the GEN and UBV catalogues.
The JP11 Johnson catalogue provides magnitudes in the BVRIJKL bands.
Strecker et al. (1978) observed this object between 1.2 and
![]() .
The fluxes at 12, 20, 60 and
.
The fluxes at 12, 20, 60 and
![]() are from IRAS,
and fluxes between 8 and
are from IRAS,
and fluxes between 8 and
![]() come from Danchi et al. (1994).
come from Danchi et al. (1994).
The effective temperature that accounts for the photometric data is about
![]() ,
a bit more than the temperature of
,
a bit more than the temperature of
![]() assumed by Danchi et al. (1994)
for their model containing only silicate dust around R Leo.
The stellar radius is clearly smaller (
assumed by Danchi et al. (1994)
for their model containing only silicate dust around R Leo.
The stellar radius is clearly smaller (
![]() instead of
instead of
![]() ).
However, we have estimated these two parameters with all data combined
(interferometric data in the K and N bands and the spectro-photometric data),
and they show good consistency
(in as much as the star is neither a perfect blackbody nor a uniform disk)
with those derived from the K band interferometric data alone by Perrin et al. (1999),
who give uniform disk radii of at most
).
However, we have estimated these two parameters with all data combined
(interferometric data in the K and N bands and the spectro-photometric data),
and they show good consistency
(in as much as the star is neither a perfect blackbody nor a uniform disk)
with those derived from the K band interferometric data alone by Perrin et al. (1999),
who give uniform disk radii of at most ![]()
![]() and photosphere
effective temperatures closer to
and photosphere
effective temperatures closer to
![]() rather than
rather than
![]() .
Our effective temperature is larger than that of Danchi et al.
which is not surprising
since in their case only photometric data above
.
Our effective temperature is larger than that of Danchi et al.
which is not surprising
since in their case only photometric data above
![]() was used,
i.e., in a range of wavelengths very sensitive to cool dust emission.
This also explains why their stellar radius is larger:
for a given bolometric flux,
the stellar diameter increases with decreasing temperature.
was used,
i.e., in a range of wavelengths very sensitive to cool dust emission.
This also explains why their stellar radius is larger:
for a given bolometric flux,
the stellar diameter increases with decreasing temperature.
As in Danchi et al. (1994), we consider a large circumstellar envelope near
the central star.
But instead of 2 ![]() for the inner edge of the dust shell,
we chose 3.5
for the inner edge of the dust shell,
we chose 3.5 ![]() to keep the temperature of the grains close to
to keep the temperature of the grains close to
![]() ,
the assumed temperature of grain condensation.
The overall parameters are summarised in Table 5.
,
the assumed temperature of grain condensation.
The overall parameters are summarised in Table 5.
![\begin{figure}
\par\includegraphics[width=8cm,height=7.5cm,clip]{3722-f3a}\hspac...
...ce*{2mm}
\includegraphics[width=8.5cm,height=7.5cm,clip]{3722-f3d}
\end{figure}](/articles/aa/full/2004/16/aa3722/img128.gif) |
Figure 3:
Model output for R Leo.
From top left to bottom left: modelled visibility curve with interferometric data for the bands K, L, and N;
bottom right: modelled spectral energy distribution with photometric data.
Model parameters (see Table 5):
|
| Open with DEXTER | |
The fit of the photometric data described in the previous section is
displayed in Fig. 3.
The contribution of the envelope dominates beyond
![]() up to about
up to about
![]() .
With a quite large extent, up to 140
.
With a quite large extent, up to 140 ![]() ,
and an optical depth
,
and an optical depth
![]() the dust shell accounts for IRAS and Danchi et al. (1994) observations in the
long wavelength range.
As can be noticed in the graph, scattered flux and thermal dust emission
are even more important than for SW Vir.
This is apparently due to the larger optical depth and the smaller inner radius of the envelope.
These parameters lead to a mass-loss rate of
the dust shell accounts for IRAS and Danchi et al. (1994) observations in the
long wavelength range.
As can be noticed in the graph, scattered flux and thermal dust emission
are even more important than for SW Vir.
This is apparently due to the larger optical depth and the smaller inner radius of the envelope.
These parameters lead to a mass-loss rate of
![]() ,
which is of the same order of and intermediate between the values published
by Danchi et al. (1994) and Knapp et al. (1998) (see Table 4).
,
which is of the same order of and intermediate between the values published
by Danchi et al. (1994) and Knapp et al. (1998) (see Table 4).
Visibility curves gained from this model are also shown
in Fig. 3 for the K, L, and N bands respectively.
The stellar radius derived from our model is
![]() ,
much smaller than the
,
much smaller than the
![]() of Danchi et al. (1994).
Since our study is based on interferometric data
spanning a wider range of wavelengths,
the parameters we derive are different from that of Danchi et al. (1994)
The ISI data are better suited to characterise the dust,
yet the shorter-wavelength data bring more accurate stellar parameters,
hence explaining the discrepancies between the two studies.
The dust envelope structure may be considered as stationary
with little sensitivity to stellar pulsation.
FLUOR observations at phase 0.28 (March 1997) in K band
give a uniform disk radius of
of Danchi et al. (1994).
Since our study is based on interferometric data
spanning a wider range of wavelengths,
the parameters we derive are different from that of Danchi et al. (1994)
The ISI data are better suited to characterise the dust,
yet the shorter-wavelength data bring more accurate stellar parameters,
hence explaining the discrepancies between the two studies.
The dust envelope structure may be considered as stationary
with little sensitivity to stellar pulsation.
FLUOR observations at phase 0.28 (March 1997) in K band
give a uniform disk radius of
![]() (Perrin et al. 1999).
In principle, the K band measurements are more sensitive
to regions very close to the photosphere.
It therefore seems that the radius of R Leonis should be smaller than the
evaluations by Danchi et al. (1994) and the difference between our estimate
and that of Danchi et al. cannot be attributed to the star pulsation.
This difference must be attributed to the difference of effective temperatures.
(Perrin et al. 1999).
In principle, the K band measurements are more sensitive
to regions very close to the photosphere.
It therefore seems that the radius of R Leonis should be smaller than the
evaluations by Danchi et al. (1994) and the difference between our estimate
and that of Danchi et al. cannot be attributed to the star pulsation.
This difference must be attributed to the difference of effective temperatures.
We now compare interferometric data in the K and L band and that of ISI.
Our parameters are still consistent with the ISI visibility points
at
![]() and account for FLUOR observations in the K band
at low spatial frequencies.
It is to be noticed that,
since the ISI visibility data are at low spatial frequencies,
they are not as sensitive to the different models
as are the visibilities at shorter wavelengths.
This explains why they are consistent with
both the Danchi et al. (1994) and our model.
On the other hand, in the L band our model overestimates
the measured visibility values.
As in the case of SW Vir,
it appears that the large structure seen in the L band
is not well accounted for by a simple dust shell model,
despite the even larger optical depth.
Also the SED shows that contributions from the dust shell
are at least a factor 102 below the direct stellar flux.
A larger radius could explain both
and account for FLUOR observations in the K band
at low spatial frequencies.
It is to be noticed that,
since the ISI visibility data are at low spatial frequencies,
they are not as sensitive to the different models
as are the visibilities at shorter wavelengths.
This explains why they are consistent with
both the Danchi et al. (1994) and our model.
On the other hand, in the L band our model overestimates
the measured visibility values.
As in the case of SW Vir,
it appears that the large structure seen in the L band
is not well accounted for by a simple dust shell model,
despite the even larger optical depth.
Also the SED shows that contributions from the dust shell
are at least a factor 102 below the direct stellar flux.
A larger radius could explain both
![]() and
and
![]() observations,
but would disagree with K band measurements and the SED.
observations,
but would disagree with K band measurements and the SED.
From what we have seen so far, the best consistency between the
multiple band data and the dust shell model is obtained for ![]() Ori.
The model described by Danchi et al. (1994) has a
stellar radius close to the K and L radii estimated with a uniform disk model.
Yet, in this case the influence of the envelope is not very important
because of its small thickness and low opacity.
Nevertheless, model parameters for ISI data from Danchi et al.
are consistent with what we see both for K and L bands.
Ori.
The model described by Danchi et al. (1994) has a
stellar radius close to the K and L radii estimated with a uniform disk model.
Yet, in this case the influence of the envelope is not very important
because of its small thickness and low opacity.
Nevertheless, model parameters for ISI data from Danchi et al.
are consistent with what we see both for K and L bands.
One may note, however, that
Weiner et al. (2000) report further ISI data on ![]() Ori
which are not fully consistent with the model of Danchi et al.
based on observations at low spatial frequencies.
Weiner et al. took their measurements at higher spatial frequencies
where the dust shell is fully resolved.
Its contribution to the visibility is therefore negligible
and the observed data are governed
by radiation coming directly from the star or from its close environment.
Like the L band data of SW Vir and R Leo (see below),
the data of Weiner et al. are overestimated by the dust shell model.
These findings are further discussed in Perrin et al. (2003a).
Ori
which are not fully consistent with the model of Danchi et al.
based on observations at low spatial frequencies.
Weiner et al. took their measurements at higher spatial frequencies
where the dust shell is fully resolved.
Its contribution to the visibility is therefore negligible
and the observed data are governed
by radiation coming directly from the star or from its close environment.
Like the L band data of SW Vir and R Leo (see below),
the data of Weiner et al. are overestimated by the dust shell model.
These findings are further discussed in Perrin et al. (2003a).
For AGB stars with later types like SW Vir and R Leo,
for which we measure large diameter differences between
![]() and
and
![]() (the approximate effective wavelengths of the FLUOR and TISIS instruments),
a simple dust shell model cannot account for these differences.
However, the shape of near-infrared visibility curves for SW Vir and R Leo
seem to show a trend.
L band visibility points are systematically overestimated
by a simple dust shell model
meaning the source is larger than predicted by the model.
This shows that the stellar environment mainly seen at this wavelength
is much more complex than suggested by a model
that takes into account only the star and its dust envelope.
(the approximate effective wavelengths of the FLUOR and TISIS instruments),
a simple dust shell model cannot account for these differences.
However, the shape of near-infrared visibility curves for SW Vir and R Leo
seem to show a trend.
L band visibility points are systematically overestimated
by a simple dust shell model
meaning the source is larger than predicted by the model.
This shows that the stellar environment mainly seen at this wavelength
is much more complex than suggested by a model
that takes into account only the star and its dust envelope.
Indeed, the temperature of this area is close to the temperature at which grains form. Consequently, we must also take the presence of gas into account in modelling. Doing this will radically change the radiation transfer behaviour. Recently, spectroscopic detection of SiO, OH, and H2O masers in late-type star envelopes have revealed the necessity of modelling the gas to explain large diameters seen in L band. ISO/SWS and other studies (Tsuji 2000; Yamamura et al. 1999; Tsuji et al. 1997) brought up the existence of molecular layers of warm and cold H2O, SiO, and CO2 around AGB stars. Such layers in AGB stars certainly exist and have an impact on the stellar radiation which is observed by infrared interferometers. Strong molecular scattering by H2O and CO were suggested to account for K band visibility measurements of R Leo by FLUOR in 1997 (Perrin et al. 1999) and seem to explain more easily the near-infrared measurements (Perrin et al. 2003b; Mennesson et al. 2002). It is very likely that dust needs to be coupled with gas to produce a more reliable model of these sources and that dust alone cannot be the only cause of the measurements taken in a wide range of wavelengths. The inclusion of a detailed photospheric model with line opacity due to gas would improve the agreement of the SED, particularly in the blue, and would improve the discrimination between stellar and shell components.
Certain aspects of our study can be further weighed.
Simultaneous interferometric data would certainly help
constrain models more accurately.
Same epoch measurements are needed because of the large diameter
variations of AGB stars.
At least for the position angles it can be noted, though,
that they are fairly close in range,
which leaves little possibility that the discrepancy we see
may be explained by an elliptical shape (see below).
Furthermore, 11.15-
![]() data would have been very useful
to see whether our SW Vir dust model parameters are correct
since the envelope has more impact on the model at this wavelength.
Such data might be provided in the near future
by single-dish instruments on 10-m class telescopes or
by upcoming mid-infrared interferometers like MIDI at the VLTI.
data would have been very useful
to see whether our SW Vir dust model parameters are correct
since the envelope has more impact on the model at this wavelength.
Such data might be provided in the near future
by single-dish instruments on 10-m class telescopes or
by upcoming mid-infrared interferometers like MIDI at the VLTI.
A limitation of the model as used for this study is that
it does not consider heterogeneous grain size distributions s(a)
depending upon the distance from the star
or temporal effects (like grain formation, growth, or destruction).
Also, different limits of the grain radius a
might have affected the fit of the SED in the UV and the far-infrared.
Yet, varying the grain size range from
![]() to
to
![]() and
and
![]() for R Leo as a study case,
the resulting diagrams showed only small changes.
It appeared that, in the modelled visibility curves for the K and L bands,
the contribution of spatial frequencies below
for R Leo as a study case,
the resulting diagrams showed only small changes.
It appeared that, in the modelled visibility curves for the K and L bands,
the contribution of spatial frequencies below
![]() were somewhat increased.
Above all, neither the star nor the envelope are ideal blackbodies
which adds to these deviations.
were somewhat increased.
Above all, neither the star nor the envelope are ideal blackbodies
which adds to these deviations.
Concerning the particle density distribution n(r),
Suh (1999) questions the necessity
of assuming a distribution which is peaked at the inner edge.
Indeed, comparing results of calculations with two sets of parameters
that differ only in n(r) showed only minor changes in K and L bands.
For
![]() ,
changes were somewhat clearer,
whereby for
,
changes were somewhat clearer,
whereby for ![]() Ori and R Leo the accelerated version fitted ISI data better.
Other issues are the possible existence of smaller structures in the envelope
like clumps or aspherical dust distributions, as they were investigated, for example, by Lopez et al. (1997).
These have not been tested here and require more intense visibility modelling.
This would be definitely required
if sources showed systematic asymmetric effects,
yet which are likely to
produce ringing features on top of a visibility curve
compared to the more basic effect of radiative transfer in spherical shells. Nevertheless, closure phase observations could help test for asymmetries.
Ori and R Leo the accelerated version fitted ISI data better.
Other issues are the possible existence of smaller structures in the envelope
like clumps or aspherical dust distributions, as they were investigated, for example, by Lopez et al. (1997).
These have not been tested here and require more intense visibility modelling.
This would be definitely required
if sources showed systematic asymmetric effects,
yet which are likely to
produce ringing features on top of a visibility curve
compared to the more basic effect of radiative transfer in spherical shells. Nevertheless, closure phase observations could help test for asymmetries.
As for the dust particle material,
slightly differing optical properties were proposed by several authors.
See, for example, Suh (1999) for a comparison of optical properties
of silicate dust grains in the envelopes around AGB stars.
We chose the ones of Draine & Lee (1984) which are widely used.
Using optical properties suggested by Suh (1999) for comparison
made it necessary to choose different dust shell parameters
in order to achieve reasonable consistency with ISI data.
Yet, L band data were still overestimated,
similar to Fig. 3.
Another issue might be the dust composition.
For example, for R Leo, Danchi et al. (1994) tested also a mixture of silicates and graphites.
Yet, this led to a required stellar radius in the dust shell model
almost twice as large as observed in the K band,
which is supposedly sensitive to the region close to the stellar photosphere.
Therefore, this has not been further investigated here.
A third aspect might be the condensation temperature
![]() that we adopted.
Some authors chose higher
that we adopted.
Some authors chose higher
![]() ,
see, for example, Willson (2000) for an overview.
Taking R Leo as study case, we set
,
see, for example, Willson (2000) for an overview.
Taking R Leo as study case, we set
![]() and chose
and chose ![]() and an optical depth
and an optical depth ![]() so that also ISI data were well fitted.
The output of the model showed a
somewhat increased IR excess around
so that also ISI data were well fitted.
The output of the model showed a
somewhat increased IR excess around
![]() ,
and the temperature at the inner radius
turned out to be about
,
and the temperature at the inner radius
turned out to be about
![]() .
Still, while the SED, K band, and ISI data were reasonably well fitted,
the modelled visibility curve in the L band
was clearly higher than the measured data,
similar to Fig. 3.
.
Still, while the SED, K band, and ISI data were reasonably well fitted,
the modelled visibility curve in the L band
was clearly higher than the measured data,
similar to Fig. 3.
In summary, we do not believe the aspects mentioned above to affect our conclusions significantly.
High angular resolution techniques give important constraints on spatial intensity distribution of late-type stars. Using diameter measurements in the K and L bands, we have tried to explain both K and L observations for three stars surrounded by circumstellar envelopes with different optical depths. We applied a model with a single dust shell and consistent with low resolution photometric data as well as thermal infrared interferometry data from ISI when available.
For the supergiant Betelgeuse,
the optically very thin dust shell has little influence
on what is seen and is transparent in the K and L bands.
The observed diameters are almost equal.
In contrast, the AGB stars SW Vir and R Leo
show bigger diameters in the L band than in the K band.
Here, the optical depths of the shells are larger
and near-infrared model visibilities react quite sensitively
on changes of the dust shell parameters.
Yet, the models we find in agreement with the SED, K band interferometry, and the specially dust-sensitive
![]() interferometry
cannot reproduce the observed diameter differences.
interferometry
cannot reproduce the observed diameter differences.
Our study leads to the conclusion of the insufficiency of a simple shell model with dust only or without more complex structures. New observations at several wavelengths from visible to far-infrared would help understand better external envelopes of AGB stars. A denser coverage of the spatial frequency plane will also be very useful to strongly constrain models. Interferometric observations with higher spectral resolution could enable to localise molecular components of these envelopes and certainly help explain differences between K and L band.
Acknowledgements
P. Sch. appreciated support by the European Community through a Marie Curie Training Fellowship for an extended stay at the Observatoire Paris-Meudon. It also allowed the collaboration with the Observatoire de la Côte d'Azur. - The authors are solely responsible for the information communicated.This publication made use of NASA's Astrophysics Data System (ADS) Bibliographic Services (http://cdsads.u-strasbg.fr/) and of the SIMBAD database, operated at the Centre de Donné astronomiques de Strasbourg (CDS), Strasbourg, France (http://simbad.u-strasbg.fr/).
We thank the referee and Lee Anne Willson for helpful comments.
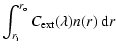
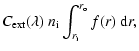
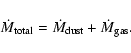
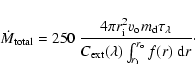
In the dust shell,
the particle density of grains is assumed as
(Schutte & Tielens 1989; Danchi et al. 1994)
The optical depth
![]() of the envelope is determined by
of the envelope is determined by
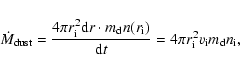
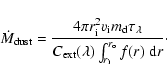
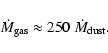
Furthermore, for the total mass-loss rate
also the gas has to be taken into account, i.e.,
 |
(A.6) |
 |
(A.8) |