A&A 415, 63-76 (2004)
DOI: 10.1051/0004-6361:20034122
C. Möllenhoff![]()
Landessternwarte, Königstuhl 12, 69117 Heidelberg, Germany
Received 28 July 2003 / Accepted 20 October 2003
Abstract
A sample of 26 bright spiral galaxies (
![]() )
with low
to medium inclination and without a bar was observed with UBVRI filters.
The CAFOS focal reducer camera at the Calar Alto 2.2 m telescope
was used. The surface-brightness distributions were fitted using
a 2-dimensional algorithm with corresponding functions for the disk-
and bulge-structure. For the disks an exponential function was used,
for the bulges a Sérsic
)
with low
to medium inclination and without a bar was observed with UBVRI filters.
The CAFOS focal reducer camera at the Calar Alto 2.2 m telescope
was used. The surface-brightness distributions were fitted using
a 2-dimensional algorithm with corresponding functions for the disk-
and bulge-structure. For the disks an exponential function was used,
for the bulges a Sérsic ![]() law, was applied with the concentration parameter
law, was applied with the concentration parameter
![]() as another fit variable. Correlations of the resulting structural
parameters of disks and bulges in UBVRI are investigated, giving clues
to the formation history of the bulges.
as another fit variable. Correlations of the resulting structural
parameters of disks and bulges in UBVRI are investigated, giving clues
to the formation history of the bulges.
We confirm that the large and bright bulges of early-type spirals are similar to elliptical galaxies. They were probably formed prior to the disks in a monolithic collapse or via early mergers. Late-type spirals have tiny and faint bulges with disk-like profiles. These bulges were probably formed after the disk in secular evolution processes, e.g. from a disk instability. The comparison of the color indices of corresponding spirals and bulges with population synthesis computations support above formation scenarios.
Key words: galaxies: spiral - galaxies: structure - galaxies: photometry - galaxies: fundamental parameters - galaxies: statistics - galaxies: formation
The study of the the surface-brightness (SB) distribution is an important tool for a better understanding of spiral galaxies. The resulting structural parameters like disk scale-length, bulge effective radius, bulge/disk-ratio, color indices, etc. allow conclusions about the evolution of disks and bulges (for comprehensive reviews see e.g. Okamura 1988; Andredakis & Sanders 1994; Baggett et al. 1998; MacArthur et al. 2003). The morphological description of galaxies depends on the filter during observation, thus the intrinsic structural parameters will also vary with wavelength due to the color-dependent stellar populations and dust extinction effects. Thus, multi-wavelength information is required for a thorough description of the structural parameters. In this study the visual bands U, B, V, R, and I are used.
Table 1:
The observed 26 spiral galaxies with some basic parameters.
The Hubble types were taken from the Carnegie Atlas of Galaxies (Sandage & Bedke 1994).
The column
![]() gives the extinction-corrected B magnitudes taken from RC3.
The inclination
gives the extinction-corrected B magnitudes taken from RC3.
The inclination
![]() stems from the V-fit in this paper (cf.
stems from the V-fit in this paper (cf.
![]() in Table 2).
The galactic extinction
in Table 2).
The galactic extinction
![]() ,
the internal extinction
,
the internal extinction
![]() ,
and the radial velocities
,
and the radial velocities
![]() with respect to the 3K background were also taken from RC3.
The determination of the distances and their references are explained in the text.
The exposure times for the UBVRI images are given in seconds.
NGC 1232 and 1288 were observed with the ESO VLT1 Antu (see text).
with respect to the 3K background were also taken from RC3.
The determination of the distances and their references are explained in the text.
The exposure times for the UBVRI images are given in seconds.
NGC 1232 and 1288 were observed with the ESO VLT1 Antu (see text).
The radial surface-brightness (SB) profiles
of the disks are usually described by an exponential function
(e.g. Freeman 1970; Grosbøl 1985; Courteau 1996).
The structure of the bulges is not so clear (Carollo et al. 1999).
In former times the bulges were considered to be similar
to elliptical galaxies and their SB profiles were described by a de
Vaucouleurs R1/4 function. In more recent work (Andredakis et al. 1995;
Graham et al. 1996; Graham 2001; Möllenhoff & Heidt 2001, Paper I;
MacArthur et al. 2003) it was found that the bulges are better described
by a more general profile in a form proposed by Sérsic (1968):
![]() .
Here
.
Here ![]() is the central flux density,
is the central flux density, ![]() is a radial scale length,
and the real number exponent
is a radial scale length,
and the real number exponent ![]() (many authors use
(many authors use
![]() instead)
determines the slope of the projected bulge SB distribution.
instead)
determines the slope of the projected bulge SB distribution.
Andredakis et al. (1995) realized from K-band observations that the light
profiles of bulges change systematically with the morphological types.
The exponent ![]() varies from
varies from ![]() 0.25 for early-type
spirals to
0.25 for early-type
spirals to ![]() 1 for late-type spirals, i.e. from a de Vaucouleurs
to an exponential profile. This result has been confirmed by a number of
authors in visual and near infrared (NIR) filters.
(de Jong 1996a; Moriondo et al. 1998; Graham 2001, Paper I;
MacArthur et al. 2003; Knapen et al. 2003).
1 for late-type spirals, i.e. from a de Vaucouleurs
to an exponential profile. This result has been confirmed by a number of
authors in visual and near infrared (NIR) filters.
(de Jong 1996a; Moriondo et al. 1998; Graham 2001, Paper I;
MacArthur et al. 2003; Knapen et al. 2003).
In this study we intend to confirm and extend the structural relations between bulges and disks of spiral galaxies in 5 visual bands. Images in UBVRI of a sample of 26 spiral galaxies of different Hubble type with low or medium inclination were exposed. A focal reducer was used to get well-determined sky backgrounds. Two-dimensional model functions were fitted to the whole surface-brightness distribution. To get reliable photometric parameters, the fit procedure for each galaxy was accompanied by extensive different tests. The resulting structural parameters of the different galaxies were correlated, leading to general relations concerning the structure and evolution, especially of the bulges.
The paper is organized as follows. Section 2 describes the sample of the observed spiral galaxies and the determination of the distances. Sections 3 and 4 describe the observations, the data reduction, and the photometric calibrations. In Sect. 5 we present the two-dimensional method for a simultaneous fit of the whole surface-brightness (SB) distribution with a disk and a bulge. Section 6 describes the results and comparisons with other authors. Section 7 describes the results in dependence on color UBVRI. In Sect. 8 we show correlations and statistics of the structural parameters of disks and bulges. Sections 9 and 10 describe the photometric results. Section 11 compares the observed color indices with population synthesis calculations. In Sect. 12 we discuss the results and draw some conclusions.
The observed sample of galaxies comprises 26 spirals with
![]() ,
of Hubble type Sa...Sc, and without strong bar,
selected from the Revised Shapley-Ames Catalog (Sandage & Tammann 1981).
Table 1 lists the observed galaxies,
some basic parameters, and the exposure times for the five filters.
The Hubble types were taken from Sandage & Bedke (1994) and transformed
into the T-classes according to RC3 (de Vaucouleurs et al. 1991).
,
of Hubble type Sa...Sc, and without strong bar,
selected from the Revised Shapley-Ames Catalog (Sandage & Tammann 1981).
Table 1 lists the observed galaxies,
some basic parameters, and the exposure times for the five filters.
The Hubble types were taken from Sandage & Bedke (1994) and transformed
into the T-classes according to RC3 (de Vaucouleurs et al. 1991).
![]() and
and
![]() (radial velocity with respect
to the 3K background) were taken from RC3. The distance determinations
are described in the following subsection. Figure 1 shows the
number and luminosity distribution of the sample galaxies over over Hubble
types. The late-type spirals are slightly predominant due to our selection
criterion
(radial velocity with respect
to the 3K background) were taken from RC3. The distance determinations
are described in the following subsection. Figure 1 shows the
number and luminosity distribution of the sample galaxies over over Hubble
types. The late-type spirals are slightly predominant due to our selection
criterion
![]() ,
which prefers blue (late type) galaxies.
,
which prefers blue (late type) galaxies.
The determination of the distances is crucial to obtain reliable scale lengths in kpc from the fit results in arcsec. We used different approaches for distance determinations, they are marked by a corresponding abbreviation in the column "Dist.Ref.'' of Table 1.
The most reliable distances exist for the calibrator galaxies with Cepheid
distances from the HST key project (Freedman et al. 2001; Macri et al. 2001)
Our galaxies with such distance determinations are marked
with hst in Table 1. The revised distance to the Virgo
cluster was determined in this way to 15.30 Mpc (![]() ).
).
For all other galaxies we used different sources from the literature and
reduced them all to a common Hubble constant
![]() km s-1 Mpc-1which is the optimum value from the HST key project
(Freedman et al. 2001). In a first step
the galaxy distances were calculated from the radial velocities by Tully (1988)
or Tully et al. (1992), who considered the group kinematics of the galaxies (tul).
These values were compared with the distances which Bottinelli et al. (1984, 1985,
1986, 1988) obtained from 21-cm line-widths via a revised B-band Tully-Fisher
relation (bot). Tully and Bottinelli et al. have many galaxies in common.
The distances from both authors are remarkably similar, so we used their mean
values for those galaxies (
km s-1 Mpc-1which is the optimum value from the HST key project
(Freedman et al. 2001). In a first step
the galaxy distances were calculated from the radial velocities by Tully (1988)
or Tully et al. (1992), who considered the group kinematics of the galaxies (tul).
These values were compared with the distances which Bottinelli et al. (1984, 1985,
1986, 1988) obtained from 21-cm line-widths via a revised B-band Tully-Fisher
relation (bot). Tully and Bottinelli et al. have many galaxies in common.
The distances from both authors are remarkably similar, so we used their mean
values for those galaxies (![]() ).
Finally, the SIMBAD databank was searched for dedicated papers on distances (sim).
Sharina et al. (1996) determined the distance of NGC 628.
).
Finally, the SIMBAD databank was searched for dedicated papers on distances (sim).
Sharina et al. (1996) determined the distance of NGC 628.
The observations were performed during March 2-7, 2000 at the 2.2 m
telescope at the Calar Alto Observatory, Spain. The CAFOS focal reducer
was used changing the focal ratio of the telescope from f/8 to f/4.4.
The CCD camera was equipped with a SITE
![]() pixel chip.
The pixel size was 24
pixel chip.
The pixel size was 24![]() ,
corresponding to 0.53 arcsec.
The circular field-of-use had a diameter of 16 arcmin.
Standard Johnson U, B, V and Cousins R, I Filters were used.
The exposure times in UBVRI are listed in Table 1.
,
corresponding to 0.53 arcsec.
The circular field-of-use had a diameter of 16 arcmin.
Standard Johnson U, B, V and Cousins R, I Filters were used.
The exposure times in UBVRI are listed in Table 1.
| |
Figure 1:
Distribution of the number of sample galaxies and their
|
| Open with DEXTER | |
Sky flats were exposed in every dawn and dusk phase. Furthermore, exposures of two empty fields in the night sky were obtained in all filters using the same exposure times as for the galaxies.
Photometric calibrations were performed every night, using stars in the open cluster NGC 2264 and the globular cluster NGC 2419 (Christian et al 1985; Racine & Harris 1975). The photometric quality of 3 nights was good or very good. One night was not photometric due to cirrus clouds. The non-photometric exposures of some galaxies through cirrus clouds make no problems for the geometrical parameters like scale-lengths, etc. In order to obtain reliable photometric data for those galaxies, additional, shortly exposed calibration images were obtained during a photometric night.
The observations of NGC 1232 and NGC 1288 were done in 1998 during the commissioning phase of the FORS focal reducer at the ESO VLT1 (Antu). For details see Möllenhoff et al. (1999).
The MIDAS program system was used for the data reduction.
From comparison and evaluation of all bias exposures
an optimal working bias image was constructed.
Similarly, from comparison and evaluation of all flat-field exposures
optimal working flat-field images were constructed for each color.
Bias subtraction and flat-field division were performed in the usual manner.
Then the images were flux-calibrated using the standard stars and
were extinction-corrected. Values for the galactic-foreground extinction
![]() were taken from RC3 (as described in Burstein & Heiles 1984).
The internal extinction in each galaxy
were taken from RC3 (as described in Burstein & Heiles 1984).
The internal extinction in each galaxy
![]() is statistically
dependent on the inclination and on the Hubble type. A corresponding
interpolation formula was also taken from the RC3 (de Vaucouleurs et al. 1991).
The extinction corrections for the other filters were computed by the
coefficients given in Cardelli et al. (1989) (their Table 3).
Since the K-corrections are very small they were not considered,
is statistically
dependent on the inclination and on the Hubble type. A corresponding
interpolation formula was also taken from the RC3 (de Vaucouleurs et al. 1991).
The extinction corrections for the other filters were computed by the
coefficients given in Cardelli et al. (1989) (their Table 3).
Since the K-corrections are very small they were not considered,
The flatness of the sky was checked in each image and corrected interactively, if necessary. The flatness of the sky down to less than 0.5% is an important condition for a reliable model of the surface-brightness distribution.
Instead of studying one-dimensional profiles it is advantageous to perform
a two-dimensional fit to the whole two-dimensional surface-brightness distribution
(Byun & Freeman 1995; de Jong 1996a; Moriondo et al. 1998; Wadadekar et al. 1999;
Möllenhoff & Heidt 2001, Paper I; MacArthur et al. 2003).
Two-dimensional surface-brightness functions for disk and bulge
were fitted simultaneously to the observed flux distribution.
For the radial flux distribution of the inclined disk we
assumed the exponential law
| (1) |
| R2 = |
(2) |
For the flux distribution of the bulge we assumed the generalized exponential
radial density law of Sérsic (1968) written
in the form (Caon et al. 1993):
| (3) |
Fitting the total flux
![]() simultaneously to the observed two-dimensional SB distribution results in a
nonlinear system of equations for the 4 + 5 = 9 free parameters.
A Levenberg-Marquardt algorithm was used for the solution of this system
(e.g. Bevington & Robinson 1992). No inner or outer truncation radii for
disk or bulge were adopted (for a discussion cf. MacArthur et al. 2003).
simultaneously to the observed two-dimensional SB distribution results in a
nonlinear system of equations for the 4 + 5 = 9 free parameters.
A Levenberg-Marquardt algorithm was used for the solution of this system
(e.g. Bevington & Robinson 1992). No inner or outer truncation radii for
disk or bulge were adopted (for a discussion cf. MacArthur et al. 2003).
Several technical steps were necessary as prerequisites for the fit:
Most images were cut to
![]() pixels.
For the larger objects like NGC 3031 we used the whole image of
pixels.
For the larger objects like NGC 3031 we used the whole image of
![]() pixels with a mask adapted to the circular field of view.
The images were centered to the same world coordinates.
The stars were marked interactively in the V image
and were removed in all 5 colors.
The center of the galaxy was measured in each image and the
functions of Sect. 5.1 were fitted to the whole image.
An ellipse fit to the isophotes in R yielded a rough guess for
the start values of the parameters in the Levenberq-Marquardt iteration.
Normally the fits was started in the I image, then using the results as
start value for the R fit, etc., for V, B, and U. In order to ensure that
the optimal model was found, the fit procedures were repeated starting
from totally different start values, with slightly modified sky values,
etc.
pixels with a mask adapted to the circular field of view.
The images were centered to the same world coordinates.
The stars were marked interactively in the V image
and were removed in all 5 colors.
The center of the galaxy was measured in each image and the
functions of Sect. 5.1 were fitted to the whole image.
An ellipse fit to the isophotes in R yielded a rough guess for
the start values of the parameters in the Levenberq-Marquardt iteration.
Normally the fits was started in the I image, then using the results as
start value for the R fit, etc., for V, B, and U. In order to ensure that
the optimal model was found, the fit procedures were repeated starting
from totally different start values, with slightly modified sky values,
etc.
The atmospheric turbulence (seeing) distorts the SB profile of the galaxies,
especially in the central region where the slope is steep. Therefore the
seeing has a big influence especially on the bulge profile. The two-dimensional
point spread function (PSF) was determined from several stars in each image
and was approximated by an (elliptical) two-dimensional Gauss function. This PSF
function was convolved with the SB model-function in each iteration step.
The convolved SB fit model was then compared with the observed SB distribution
and the control parameter ![]() was computed.
was computed.
The fit procedures and their stability were tested extensively with
artificial galaxies, including photon noise and seeing convolution.
The statistical errors from the ![]() -minimization can be computed
from the curvature matrix in the Levenberg-Marquardt algorithm
and are very small. The relevant errors here are systematic errors:
e.g. non-correct sky-subtraction, non-uniformness of the sky,
errors in the determination of the seeing point-spread-function.
To estimate the error contributions of these effects, artificial galaxy
images with typical sky levels, shot noise and seeing convolution were
fitted with our 2-dim models. The sky level and the PSF were artificially
set to different, slightly wrong values
and the effect to the photometric parameters was studied.
-minimization can be computed
from the curvature matrix in the Levenberg-Marquardt algorithm
and are very small. The relevant errors here are systematic errors:
e.g. non-correct sky-subtraction, non-uniformness of the sky,
errors in the determination of the seeing point-spread-function.
To estimate the error contributions of these effects, artificial galaxy
images with typical sky levels, shot noise and seeing convolution were
fitted with our 2-dim models. The sky level and the PSF were artificially
set to different, slightly wrong values
and the effect to the photometric parameters was studied.
An upper limit for the accuracy of the sky determination is ![]() 2%.
This leads to errors for
2%.
This leads to errors for ![]() and
and
![]() of
of ![]() 4%, for
4%, for ![]() ,
,
![]() and
and ![]() of
of ![]() 2%, and for the bulge/disk-ratio of
2%, and for the bulge/disk-ratio of ![]() 10%.
A pessimistic estimate of the accuracy for the PSF determination of
10%.
A pessimistic estimate of the accuracy for the PSF determination of ![]() 10%
leads to errors in above parameters of half the size.
Thus we conclude that the errors due to inaccurate sky levels or PSF determinations
are about
10%
leads to errors in above parameters of half the size.
Thus we conclude that the errors due to inaccurate sky levels or PSF determinations
are about ![]() 5% for the basic photometric parameters and
5% for the basic photometric parameters and ![]() 12% for the
bulge/disk-ratios. Larger errors may result from irregular perturbations of the light
distribution in the galaxies like asymmetric arms, bright star formation knots, etc.
The size of such errors is dependent on the morphological perturbations in each
individual galaxy.
12% for the
bulge/disk-ratios. Larger errors may result from irregular perturbations of the light
distribution in the galaxies like asymmetric arms, bright star formation knots, etc.
The size of such errors is dependent on the morphological perturbations in each
individual galaxy.
We did not consider any external truncation radius of the galaxies
(cf. Pohlen et al. 2000; Florido et al. 2001). An estimate of the corresponding
errors was obtained by the fit of truncated artificial galaxies with
our non-truncating algorithm.
For a truncation radius of
![]() we obtained
for
we obtained
for ![]() and
and
![]() errors of
errors of ![]() 20, 6, 0.5%, and
for
20, 6, 0.5%, and
for ![]() and
and
![]() errors of
errors of ![]() 13, 3, 0.3%, respectively.
13, 3, 0.3%, respectively.
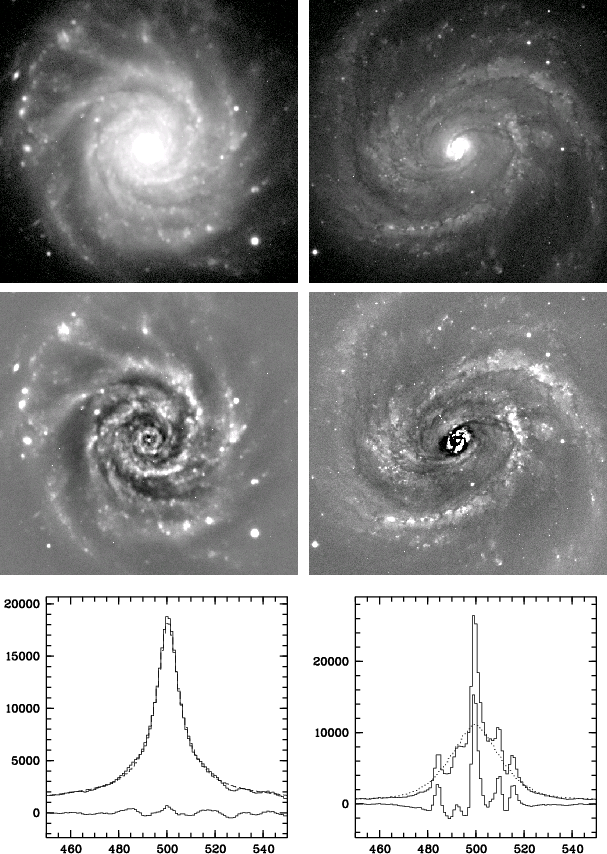 |
Figure 2: Examples of fits of different qualities to Sc galaxies. Top row: V-images of NGC 3938 and NGC 4321. The size is 500 pix or 265 arcsec. Center row: corresponding two-dimensional residuum-images. The residuum of NGC 4321 shows bright star-formation knots in the bulge region. Bottom row: horizontal cuts through galaxy- (solid line), model- (dotted line), and residuum-image (bottom solid line). |
| Open with DEXTER | |
The left column of Fig. 2 demonstrates results of a good two-dimensional fit-procedure using the Sc-galaxy NGC 3938 as an example. The top image shows the central section of the V image. The stars are still included, they were removed before the fit. The center image shows the corresponding two-dimensional residuum, i.e. the difference (galaxy-model). While the arms produce positive (white) residua, the inter-arm regions produce negative (black) residua. The sky is around zero (grey). This example for a good fit produces a generally smooth and symmetric residuum image. For the important quantitative view the bottom diagram shows a horizontal cut through galaxy NGC 3938 V (solid line), model (dotted line), and residuum (bottom solid line). For a better visibility only the central 100 pixels are shown. The bottom residual line is near to an ideal line at zero level.
The right column of Fig. 2 demonstrates the results of the
two-dimensional fit-procedure of the Sc-galaxy NGC 4321.
This was one of the most problematic cases.
It is already visible in the V image (top) that
this galaxy has an especially bright central region (bulge).
In the central residuum image very conspicuous bright knots appear in the
bulge region. They are due to a number of bright star formation (SF) regions,
arranged in a ring. These bright knots are of course
also clearly visible in the one-dimensional cuts (bottom image).
The two-dimensional fit searches an optimal smooth flux distribution
for the bulge region, without considering these fluctuations on small
spatial scales. The residual line shows the corresponding humps.
Nevertheless, the perturbations to the overall
flux distribution of the bulge are still small enough that we
can trust in the resulting photometric parameters.
This can be seen fromthe monotonic behaviour of all parameters
of NGC 4321 in the Tables 2-4
(tables only available in electronic form).
Only the slope parameter ![]() reaches unreasonable high values in U and B.
reaches unreasonable high values in U and B.
After a number of tests for each galaxy and detailed considerations about
the reliability of the parameters we ended up with a set
![]() for each galaxy in each filter U, B, V, R, and I. Table 2
(only available in electronic form) lists the structural parameters
for the disks of our galaxy sample. The central surface-brightness
values
for each galaxy in each filter U, B, V, R, and I. Table 2
(only available in electronic form) lists the structural parameters
for the disks of our galaxy sample. The central surface-brightness
values
![]() (in mag/square-arcsec) were obtained from the (seeing-deconvolved)
central flux densities
(in mag/square-arcsec) were obtained from the (seeing-deconvolved)
central flux densities ![]() of the disks using the photometric calibrations
and corrections for galactic and internal extinction (Sect. 3).
Note that these are the values if the galaxies were seen face on,
i.e. the
of the disks using the photometric calibrations
and corrections for galactic and internal extinction (Sect. 3).
Note that these are the values if the galaxies were seen face on,
i.e. the ![]() values are inclination-corrected,
values are inclination-corrected,
![]() .
The scale-lengths
.
The scale-lengths ![]() are given in arcsec and in kpc, using the distances
from Table 1. The last columns give the position angles
are given in arcsec and in kpc, using the distances
from Table 1. The last columns give the position angles
![]() and the axis ratios
and the axis ratios
![]() in all five colors.
in all five colors.
Table 3 (only available in electronic form) lists the corresponding
structural parameters for the bulges for UBVRI. The
![]() numbers were
calculated from the
numbers were
calculated from the
![]() as above.
Since the bulges are spheroids with unknown true axis ratios no inclination
corrections were applied. The effective radii
as above.
Since the bulges are spheroids with unknown true axis ratios no inclination
corrections were applied. The effective radii
![]() are given in kpc.
The following columns give the bulge exponents
are given in kpc.
The following columns give the bulge exponents
![]() for all five colors,
the position angles
for all five colors,
the position angles
![]() ,
and the axis ratios
Qb = b/a.
,
and the axis ratios
Qb = b/a.
Using the disk-parameter values
![]() (Table 2)
it is easy to calculate the flux for the disks by integration from
the center to infinity:
(Table 2)
it is easy to calculate the flux for the disks by integration from
the center to infinity:
![]() .
In a similar manner the bulge flux was integrated:
.
In a similar manner the bulge flux was integrated:
![]() ,
where
,
where
![]() and
and
![]() (Caon et al. 1993).
The total flux is simply
the sum of the fluxes of disk and bulge, the bulge/disk-ratio
is the corresponding quotient. The absolute magnitudes were
calculated using the distances from Table 1.
Table 4 (only available in electronic form) lists the
absolute magnitudes from the disk-bulge fits in UBVRI.
(Caon et al. 1993).
The total flux is simply
the sum of the fluxes of disk and bulge, the bulge/disk-ratio
is the corresponding quotient. The absolute magnitudes were
calculated using the distances from Table 1.
Table 4 (only available in electronic form) lists the
absolute magnitudes from the disk-bulge fits in UBVRI.
| |
Figure 3:
Left:
comparison between disk scale-lengths from other authors and our values.
|
| Open with DEXTER | |
Although there exists quite a number of papers with disk-bulge
decompositions of galaxy images in visual bands, there are only
few with common galaxies to our sample. Most of them present disk scale-lengths
in only one filter. Since the disk scale-lengths are color-dependent,
the comparison should be done for identical filters. In the following we compare
our disk scale-lengths with the corresponding numbers from 4 authors in the
literature. The left diagram in Fig. 3 shows the quotient
![]() ,
i.e. the disk scale-lengths obtained by those authors divided
by our corresponding values. The different symbols refer to:
,
i.e. the disk scale-lengths obtained by those authors divided
by our corresponding values. The different symbols refer to:
1. Open circles: Baggett et al. (1998), 17 common galaxies in B.
Mean value
![]() .
.
2. Triangles: Grosbøl (1985), 20 common galaxies in R.
Mean value
![]() .
.
3. Squares: Simien & de Vaucouleurs (1986), 8 common galaxies in B.
Mean value
![]() .
.
4. Crosses: Elmegreen & Elmegreen (1984), 8 common galaxies in B (+ crosses)
and I (![]() crosses). Mean value
crosses). Mean value
![]() for Band
for Band
![]() for I.
for I.
Very few extreme values (ratio >3) have been omitted. The mean value of all
quotients and the standard deviations are
![]() and are drawn in Fig. 3 (full and dotted lines).
Although there are some differences from author to author, the
overall result is satisfying.
and are drawn in Fig. 3 (full and dotted lines).
Although there are some differences from author to author, the
overall result is satisfying.
Bulge date were available only in Baggett et al. (1998) and in Simien & de Vaucouleurs (1986). Probably because of the different fit methods (they used R1/4 profiles) their results are so different from our values that a comparison is not meaningful.
NGC 4321 is the galaxy from our sample with the most measurements
in the literature. The right diagram in Fig. 3 shows the different
values obtained for the disk scale-length ![]() .
The filled circles correspond to the values from this paper.
The open circles are the UBVRI values of del Rio & Cepa (2003).
The squares are the BVRI values of Beckman et al. (1996).
The triangles are the BVRI values of Pompei & Natali (1997).
Two numbers for B and I stem each from Knapen & Beckman (1996, lozenges)
and Elmegreen & Elmegreen (1984, asterisks).
The + cross is the B value from de Jong (1996a).
The numbers from Baggett et al. (1998, B),
Grosbøl (1985, R), and Koopmann et al. (2001, R) are all
represented with
.
The filled circles correspond to the values from this paper.
The open circles are the UBVRI values of del Rio & Cepa (2003).
The squares are the BVRI values of Beckman et al. (1996).
The triangles are the BVRI values of Pompei & Natali (1997).
Two numbers for B and I stem each from Knapen & Beckman (1996, lozenges)
and Elmegreen & Elmegreen (1984, asterisks).
The + cross is the B value from de Jong (1996a).
The numbers from Baggett et al. (1998, B),
Grosbøl (1985, R), and Koopmann et al. (2001, R) are all
represented with ![]() crosses.
Although the results show quite a scatter, the tendency of
decreasing
crosses.
Although the results show quite a scatter, the tendency of
decreasing ![]() towards the red colors is slightly detectable.
As above, the bulge data in these papers stem from different
assumptions about the bulge profiles and do not allow reasonable
comparisons.
towards the red colors is slightly detectable.
As above, the bulge data in these papers stem from different
assumptions about the bulge profiles and do not allow reasonable
comparisons.
| |
Figure 4:
Disk scale-lengths |
| Open with DEXTER | |
The inspection of the parameters in Tables 2 and
3 shows that there exist general trends
in the behaviour of ![]() and
and
![]() with color.
In order to make these size correlations better visible
we neutralize the variations from
galaxy to galaxy by normalizing
with color.
In order to make these size correlations better visible
we neutralize the variations from
galaxy to galaxy by normalizing ![]() and
and
![]() to their
I-values of each galaxy. Figure 4 shows the behaviour of the
normalized radii with color. The values for each galaxy
are represented by a continuous line connecting the normalized values from
U, B, V, R, to I (=1). We see the following clear trends:
to their
I-values of each galaxy. Figure 4 shows the behaviour of the
normalized radii with color. The values for each galaxy
are represented by a continuous line connecting the normalized values from
U, B, V, R, to I (=1). We see the following clear trends:
1. The disk scale-lengths ![]() decrease monotonically from U to I,
i.e. in blue light the disks are more extended.
There are some exceptions with nearly color-independent
decrease monotonically from U to I,
i.e. in blue light the disks are more extended.
There are some exceptions with nearly color-independent ![]() and
only two cases with increasing scale-lengths (NGC 278 and 4736,
left diagram in Fig. 4).
The growth of the disks towards the blue is probably the consequence of
an increasing influence of star formation in the outer zones and/or
a higher concentration of old stars in the central regions
(cf. MacArthur et al. 2003).
and
only two cases with increasing scale-lengths (NGC 278 and 4736,
left diagram in Fig. 4).
The growth of the disks towards the blue is probably the consequence of
an increasing influence of star formation in the outer zones and/or
a higher concentration of old stars in the central regions
(cf. MacArthur et al. 2003).
2. Vice versa, the bulge effective radii
![]() increase from U to I,
with a scatter larger than that of the disks.
(right diagram in Fig. 4).
Again there are some exceptions with nearly color independent
increase from U to I,
with a scatter larger than that of the disks.
(right diagram in Fig. 4).
Again there are some exceptions with nearly color independent
![]() ,
and
two cases with strongly decreasing effective radius (NGC 3031 and NGC 3521).
The two galaxies which have their maximal
,
and
two cases with strongly decreasing effective radius (NGC 3031 and NGC 3521).
The two galaxies which have their maximal
![]() in the V filter are NGC 4274
and NGC 5055. A further division of this diagram according to different Hubble
types did not show clearer results; the number statistics is too small.
in the V filter are NGC 4274
and NGC 5055. A further division of this diagram according to different Hubble
types did not show clearer results; the number statistics is too small.
For 12 galaxies of our sample there exist similar photometric parameters
from the near infrared (NIR), (Paper I).
In general the trends of ![]() and
and
![]() in the visual filters continue
in the NIR. However, the scatter was larger there,
due to the smaller signal-to-noise ratio and the smaller field of view
(
in the visual filters continue
in the NIR. However, the scatter was larger there,
due to the smaller signal-to-noise ratio and the smaller field of view
(
![]() arcmin).
arcmin).
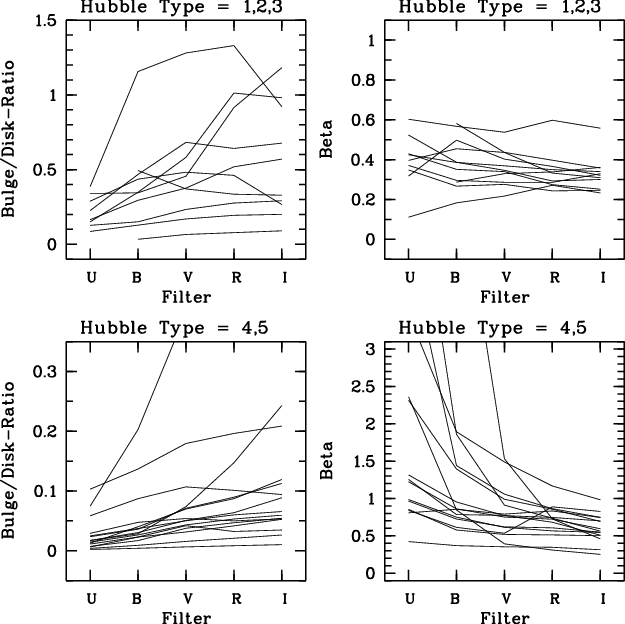 |
Figure 5:
Bulge/disk-ratios (left column) and |
| Open with DEXTER | |
Figure 5 shows the behaviour of bulge/disk-ratios
and ![]() plotted over colors.
Generally the bulge/disk-ratios increase monotonically from U to I,
i.e. the bulges are more dominant in red colors.
However, there is a distinction between the early- and
late-type spirals: for early and medium types (
plotted over colors.
Generally the bulge/disk-ratios increase monotonically from U to I,
i.e. the bulges are more dominant in red colors.
However, there is a distinction between the early- and
late-type spirals: for early and medium types (![]() ,
2, 3),
the bulge/disk-ratios have large values and show a fairly strong increase
from U to I (upper left diagram in Fig. 5).
For late-type spirals (
,
2, 3),
the bulge/disk-ratios have large values and show a fairly strong increase
from U to I (upper left diagram in Fig. 5).
For late-type spirals (
![]() )
the bulge/disk-ratios
have small values and show a weak increase from U to I,
with less scatter (bottom left diagram in Fig. 5;
the discordant line is from NGC 4254).
)
the bulge/disk-ratios
have small values and show a weak increase from U to I,
with less scatter (bottom left diagram in Fig. 5;
the discordant line is from NGC 4254).
The bulge slope parameter ![]() decreases monotonically from U to I.
For early and medium types, it varies between 0.6 and 0.2.
(top right diagram in Fig. 5).
For late type spirals
decreases monotonically from U to I.
For early and medium types, it varies between 0.6 and 0.2.
(top right diagram in Fig. 5).
For late type spirals ![]() varies more, from >1 in the blue
to
varies more, from >1 in the blue
to ![]() 0.3 in the red filters
(bottom right diagram in Fig. 5).
The trends of the bulge/disk-ratios and of
0.3 in the red filters
(bottom right diagram in Fig. 5).
The trends of the bulge/disk-ratios and of ![]() in the visual colors
are similarly continued in the NIR (Paper I).
in the visual colors
are similarly continued in the NIR (Paper I).
Note that all considerations in this section are distance-independent. In the following section it will be shown that above characteristics are also reflected in the correlations with the Hubble types.
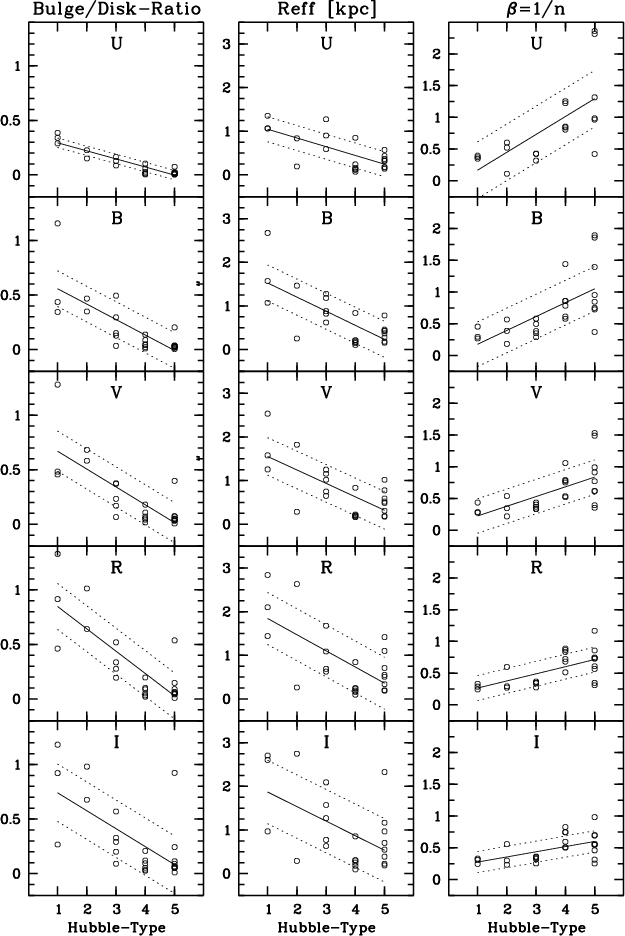 |
Figure 6:
Left column: the bulge/disk-ratios decrease from early
to late Hubble types (NGC 2460 omitted).
Center column: the bulge effective radii decrease
to late Hubble types for all colors UBVRI.
Right column: for early-type spirals the bulge slope-exponent
|
| Open with DEXTER | |
The left column of Fig. 6 shows the variation of the
bulge/disk-ratios and the exponent ![]() with Hubble types.
The bulge/disk-ratios (B/D) decrease in all colors towards the late
type spirals. This is not surprising, since this is just part of the
definition of the Hubble types.
The slope of this correlation as well as the scatter are least in U:
(
with Hubble types.
The bulge/disk-ratios (B/D) decrease in all colors towards the late
type spirals. This is not surprising, since this is just part of the
definition of the Hubble types.
The slope of this correlation as well as the scatter are least in U:
(
![]() ,
,
![]() ).
Both numbers increase towards the red colors
(V:
).
Both numbers increase towards the red colors
(V:
![]() ,
,
![]() ),
(I:
),
(I:
![]() ,
,
![]() ).
In other words, the differences in bulge/disk-ratios between
early- and late-type spirals are small in U, but with high
significance (7.5
).
In other words, the differences in bulge/disk-ratios between
early- and late-type spirals are small in U, but with high
significance (7.5![]() ). The corresponding differences are largest
in I, but with lower significance (3
). The corresponding differences are largest
in I, but with lower significance (3![]() ). This finding was unexpected.
). This finding was unexpected.
The center column of Fig. 6 shows that the effective
radii
![]() also decrease with Hubble types, early-type spirals have larger
bulges. Here again the scatter is smallest for the blue colors.
also decrease with Hubble types, early-type spirals have larger
bulges. Here again the scatter is smallest for the blue colors.
The right column of Fig. 6 shows the correlation of the slope
exponent ![]() over Hubble types for the different colors UBVRI.
The exponent
over Hubble types for the different colors UBVRI.
The exponent ![]() behaves just contrary to the bulge/disk-ratios:
behaves just contrary to the bulge/disk-ratios:
![]() increases in all colors towards the late type spirals. This
extends the K-band results of Andredakis et al. (1995) who found that
increases in all colors towards the late type spirals. This
extends the K-band results of Andredakis et al. (1995) who found that
![]() varies systematically with the Hubble types.
The slope as well as the scatter are largest in U:
(
varies systematically with the Hubble types.
The slope as well as the scatter are largest in U:
(
![]() ,
,
![]() ).
Both numbers decrease towards the red colors
(V:
).
Both numbers decrease towards the red colors
(V:
![]() ,
,
![]() ),
(I:
),
(I:
![]() ,
,
![]() ).
The
).
The ![]() -differences between early and late spirals are
similarly significant in all colors (
-differences between early and late spirals are
similarly significant in all colors (![]()
![]() The corresponding gradients in
The corresponding gradients in ![]() are largest in U.
This finding was unexpected as well.
are largest in U.
This finding was unexpected as well.
The plots of
![]() over Hubble types (center column of Fig 6)
show the contrary behaviour of the corresponding variations and scatters
of
over Hubble types (center column of Fig 6)
show the contrary behaviour of the corresponding variations and scatters
of ![]() ,
i.e. a shallow gradient
with smaller scatter in U and a steep gradient with large scatter in I.
It is an empirical finding that during the fit procedure
,
i.e. a shallow gradient
with smaller scatter in U and a steep gradient with large scatter in I.
It is an empirical finding that during the fit procedure ![]() and
and
![]() behave complementary: an increase of one of these parameters
during the numerical iterations is
accompanied by a decrease of the other one. Trujillo et al. (2001) have shown,
that this behaviour is not a mathematical artefact but is founded on the
physical structure of bulge-like components.
behave complementary: an increase of one of these parameters
during the numerical iterations is
accompanied by a decrease of the other one. Trujillo et al. (2001) have shown,
that this behaviour is not a mathematical artefact but is founded on the
physical structure of bulge-like components.
![\begin{figure}
\par\includegraphics[width=8cm,clip]{0122fi7.ps}
\end{figure}](/articles/aa/full/2004/07/aa0122/img93.gif) |
Figure 7:
The bulge absolute luminosities and the bulge effective radii
|
| Open with DEXTER | |
The left column of Fig. 7 shows how for each color UBVRI
the bulge luminosities depend on the (inverse) slope exponent
![]() .
The bulges with large n (small
.
The bulges with large n (small ![]() ,
i.e. similar to de Vaucouleurs profile) are brighter, as well absolutely
as relative to the disks. This result is complementary to
Fig. 5, which shows the correlations over colors and
early- or late-type spirals:
early-type spirals have brighter bulges and smaller
,
i.e. similar to de Vaucouleurs profile) are brighter, as well absolutely
as relative to the disks. This result is complementary to
Fig. 5, which shows the correlations over colors and
early- or late-type spirals:
early-type spirals have brighter bulges and smaller ![]() values
(i.e. larger n) than the late-type spirals.
(see Paper I for similar results in NIR, or MacArthur et al. 2003).
values
(i.e. larger n) than the late-type spirals.
(see Paper I for similar results in NIR, or MacArthur et al. 2003).
The right column of Fig. 7 shows how for each color UBVRI
the bulge effective radii
![]() depend on the (inverse) slope exponent
depend on the (inverse) slope exponent
![]() .
The bulges with large n (small
.
The bulges with large n (small ![]() )
are more
extended.
)
are more
extended.
Thus we can extend the corresponding conclusions from Sect. 7 as well to the linear sizes of bulges: the bulges of the early-type spirals are large, bright and are similar to elliptical galaxies, the bulges of the late types are tiny, faint and are similar to disks, especially in the blue colors.
![\begin{figure}
\par\includegraphics[width=7.5cm,clip]{0122fi8.ps}
\end{figure}](/articles/aa/full/2004/07/aa0122/img94.gif) |
Figure 8:
The size ratio
|
| Open with DEXTER | |
Late-type spirals have bulges with nearly exponential profiles.
Courteau et al. (1996) fitted an exponential disk plus an exponential
bulge to a large sample of late-type spiral galaxies.
They found that the ratio of the corresponding scale-lengths
was approximately constant:
![]() (r-band).
Graham (2001) and MacArthur et al. (2003) performed
similar studies (using Sérsic bulges) for galaxies of different Hubble types
and found slightly different results (see Sect. 12).
(r-band).
Graham (2001) and MacArthur et al. (2003) performed
similar studies (using Sérsic bulges) for galaxies of different Hubble types
and found slightly different results (see Sect. 12).
Figure 8 shows the variation of our
![]() values with
Hubble types for the different colors UBVRI. We observe a clear trend
of increasing
values with
Hubble types for the different colors UBVRI. We observe a clear trend
of increasing
![]() from late- to early-type spirals.
Furthermore, for each morphology class (
from late- to early-type spirals.
Furthermore, for each morphology class (
![]() )
we separate the colors
UBVRI by an artificial offset in HT:
)
we separate the colors
UBVRI by an artificial offset in HT:
![]() ,
,
![]() ,
V no offset,
,
V no offset,
![]() ,
,
![]() .
This separation shows a corresponding increasing trend
from blue (U) to red (I) colors. The lines in each HT class give the
linear regressions and the 1
.
This separation shows a corresponding increasing trend
from blue (U) to red (I) colors. The lines in each HT class give the
linear regressions and the 1![]() -deviations. Because of their extreme
-deviations. Because of their extreme
![]() values NGC 2460 and 4254 (Table 3) have been omitted here.
Table 5 shows the corresponding numbers from the linear
regressions. Our results support the idea of a close connection between
disk- and bulge-structure for late-type spirals. We obtain
a steeper dependence with Hubble types than
that found by MacArthur et al., even if we consider the small numbers of galaxies
in the Hubble classes T=1 and T=2.
values NGC 2460 and 4254 (Table 3) have been omitted here.
Table 5 shows the corresponding numbers from the linear
regressions. Our results support the idea of a close connection between
disk- and bulge-structure for late-type spirals. We obtain
a steeper dependence with Hubble types than
that found by MacArthur et al., even if we consider the small numbers of galaxies
in the Hubble classes T=1 and T=2.
Table 5:
![]() in UBVRI for the different Hubble types.
This quotient decreases systematically from early to late spirals
and decreases systematically from red to blue colors.
in UBVRI for the different Hubble types.
This quotient decreases systematically from early to late spirals
and decreases systematically from red to blue colors.
From the decomposition of each galaxy into disk and bulge we obtain the luminosities in each color and the corresponding color indices as well. Since NGC 2742 was exposed during non-photometric conditions and no later calibrations were possible, this galaxy is omitted in all following photometric diagrams.
As a photometric check we compare the total B luminosities
as well as
![]() with
the corresponding values from the RC3 (de Vaucouleurs et al. 1991).
Here always the extinction-corrected values are used.
The left diagram in Fig. 9 shows the
comparison of the total luminosities.
The scatter looks satisfying (
with
the corresponding values from the RC3 (de Vaucouleurs et al. 1991).
Here always the extinction-corrected values are used.
The left diagram in Fig. 9 shows the
comparison of the total luminosities.
The scatter looks satisfying (
![]() mag).
The object with the largest offset in
mag).
The object with the largest offset in
![]() is NGC 2855.
The right diagram in Fig. 9 shows the
comparison of the
is NGC 2855.
The right diagram in Fig. 9 shows the
comparison of the
![]() values. Here the scatter is only
values. Here the scatter is only
![]() (note the different y-scales of
the diagrams). The object with largest offset in
(note the different y-scales of
the diagrams). The object with largest offset in
![]() is NGC 628.
There is no systematic error in our color indices: The mean value of the
differences between RC3 and our
is NGC 628.
There is no systematic error in our color indices: The mean value of the
differences between RC3 and our
![]() values is very small: -0.003 mag.
values is very small: -0.003 mag.
| |
Figure 9:
Comparison between total B luminosities and
|
| Open with DEXTER | |
Figure 10 shows for each color UBVRI the variation of total-, of the disk-, and of the bulge-luminosities with Hubble types. The total-luminosities represent just the distribution of the selected sample. Apart from U the mean values of the total-luminosities show no variations with Hubble types. The disk-luminosities increase slightly with Hubble types, especially for the blue filters. In contrast to that the bulge-luminosities decrease with Hubble types for all colors. Late spirals have brighter disks and fainter bulges than the early types. This has the consequence that the bulge/disk-ratios decrease with Hubble types (Fig. 6). The increasing disk luminosities and the decreasing bulge luminosities act together here. Since the disk-luminosities are less variable towards the red colors, the decreasing bulge/disk-ratio in I is mainly a consequence of the bulge behaviour alone. This is consistent with the results of Trujillo et al. (2002) who found that for corresponding K observations the variations of the bulges are predominantly responsible for variations of the bulge/disk-ratios.
It is remarkable that the patterns of the scatter around the regression lines in Fig. 10 are very similar for total-, disk-, and bulge-luminosities as well. This scatter just reflects the individual luminosity variations from galaxy to galaxy.
The corrections for galactic and internal extinction have only a minor influence to above results. If we would plot in Fig. 10 the luminosities without these corrections they would look very similar, however slightly shifted. The shift due to the extinction correction in U was the largest: the regression line has moved to 0.47 mag brighter values. This shift was 0.30 mag in V and only 0.14 mag in I. The scatter remains the same, i.e. the variations are intrinsic.
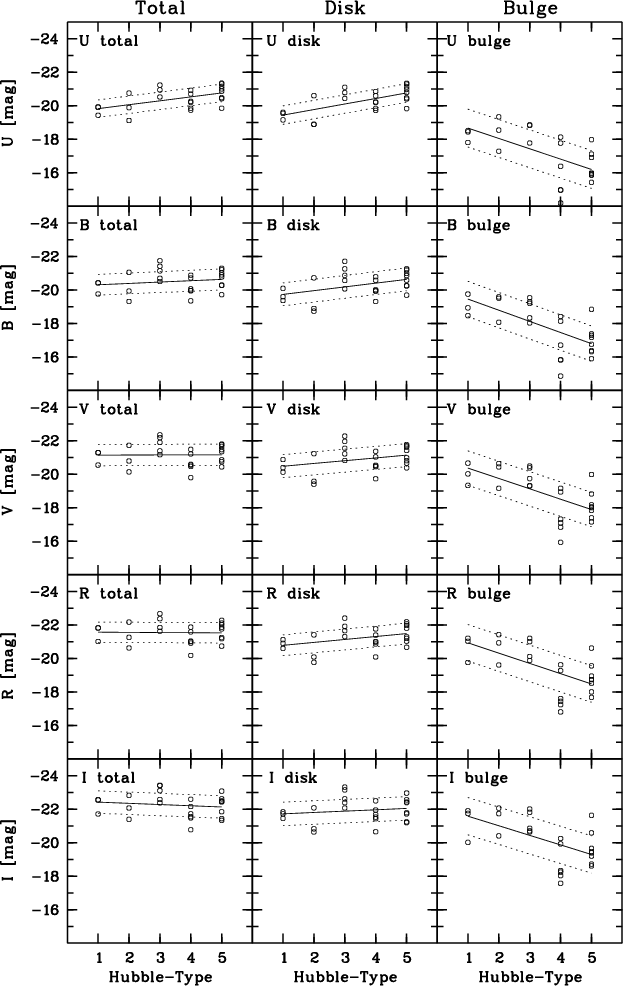 |
Figure 10: Absolute UBVRI-luminosities of the total galaxies, of the disks, and of the bulges over the Hubble types. While the disk-luminosities slightly increase to the late spirals, the bulge-luminosities decrease. |
| Open with DEXTER | |
![\begin{figure}
\par\includegraphics[width=8.5cm,clip]{0122fi11.ps}
\end{figure}](/articles/aa/full/2004/07/aa0122/img101.gif) |
Figure 11: Blue color indices U-B and B-V (in mag) for the total galaxies, the disks, and the bulges. The enhanced star formation rate in late-type spirals causes the bluer color indices of disks and total galaxies. |
| Open with DEXTER | |
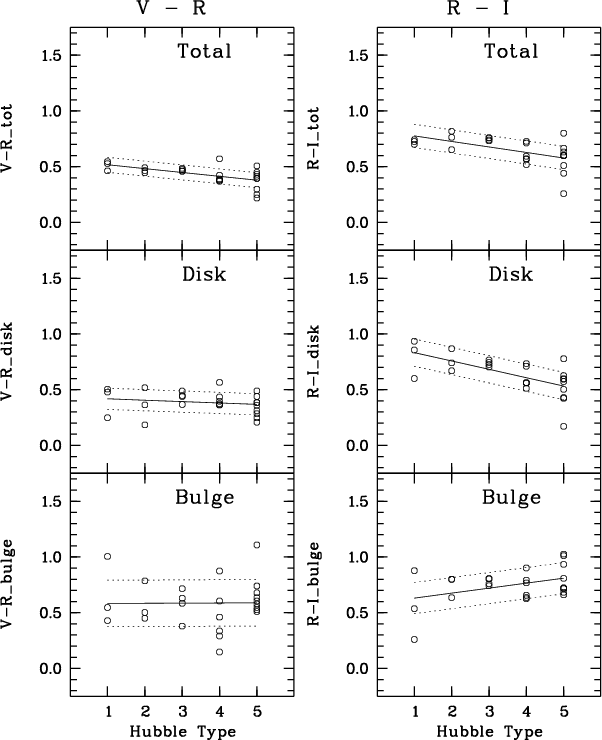 |
Figure 12: The red color indices V-R and R-I (in mag) for the total galaxies, the disks, and the bulges. For comparison reasons Figs. 11 and 12 have the same scale. |
| Open with DEXTER | |
The color indices were simply computed as the differences between the luminosities in the corresponding filters. In contrast to the absolute luminosities, color indices are independent on the distances. They are also much less sensitive to extinction corrections than the absolute luminosities.
Figure 11 shows the variations of the blue color indices
U-B and B-V over the Hubble types, for the total galaxies,
the disks, and the bulges, respectively. U-B total is
![]() 0.6 mag smaller for late-type spirals than for early types.
(these numbers are always the mean values from the linear regression),
i.e. the late types are bluer due to their stronger star formation.
The results are similar for the disks. Concerning the bulges, the weak decrease
of U-B with Hubble types is probably not significant since the scatter is fairly
large here. The mean values of the bulges are about 0.3 (Hubble type T=1)
to 0.7 mag (T=5) redder than those of the disks (for details see
Sect. 10.2). B-V (Fig. 11, right column)
shows a similar trend as U-B for the total galaxies and the disks,
however with a weaker gradient and with slightly less scatter.
Concerning the bulges, there is a tendency for redder color indices towards the
late types, again with a fairly big scatter, probably not significant as well.
0.6 mag smaller for late-type spirals than for early types.
(these numbers are always the mean values from the linear regression),
i.e. the late types are bluer due to their stronger star formation.
The results are similar for the disks. Concerning the bulges, the weak decrease
of U-B with Hubble types is probably not significant since the scatter is fairly
large here. The mean values of the bulges are about 0.3 (Hubble type T=1)
to 0.7 mag (T=5) redder than those of the disks (for details see
Sect. 10.2). B-V (Fig. 11, right column)
shows a similar trend as U-B for the total galaxies and the disks,
however with a weaker gradient and with slightly less scatter.
Concerning the bulges, there is a tendency for redder color indices towards the
late types, again with a fairly big scatter, probably not significant as well.
Figure 12 shows the corresponding variations of the red color indices
V-R and R-I over the Hubble types. V-R total shows only a small gradient:
the late spirals are slightly bluer (0.2 mag).
For the disks the gradient is similar but is disappearing for the bulges.
Compared to the blue color indices the scatter is smaller here
(bulge mean value
![]() mag).
R-I shows a somewhat steeper gradient,
mag).
R-I shows a somewhat steeper gradient, ![]() 0.3 mag between early
and late types for the total galaxies. Regarding the total luminosities,
the late types are bluer in all color indices, even in the red ones.
0.3 mag between early
and late types for the total galaxies. Regarding the total luminosities,
the late types are bluer in all color indices, even in the red ones.
The bulges show such large scatters in all color indices, that no
significant statement about the existence of gradients is possible.
We see no significant differences in the stellar populations
of the bulges between early- or late-type spirals. This behaviour
is different to that of the shape parameters (e.g. the slope ![]() ).
).
![\begin{figure}
\par\includegraphics[width=7.5cm,clip]{0122fi13.ps}
\end{figure}](/articles/aa/full/2004/07/aa0122/img104.gif) |
Figure 13: Differences between the color indices of the bulges and those of the disks, plotted over the Hubble types. The disks are practically always bluer than the bulges. |
| Open with DEXTER | |
Figure 13 shows the differences of color indices between bulges and disks. Generally, the bulges are always redder than the disks. This is valid for the blue differences U-B, B-V and even for the red differences V-R, R-I. This tendency increases from early- towards late-type spirals. The offset point in the B-V diagram stems from NGC 3031. In the case of R-I the line of linear regression indicates slightly bluer bulges for early-type spirals. However, this is not significant because of the small number of Sa galaxies and the large scatter there. R-I seems to vanish for early spirals.
Peletier & Balcells (1996) compared optical and NIR colors for a sample of
early-type spirals. They found that color differences (bulges at 0.5
![]() minus disks at 2
minus disks at 2![]() )
are very small:
)
are very small:
![]() .
From the results displayed in Fig. 13 we can not confirm these results;
we find
.
From the results displayed in Fig. 13 we can not confirm these results;
we find
![]() for early- (Sa) and
for early- (Sa) and
![]() for late-type spirals (Sc).
In contrast to Peletier & Balcells we used the whole bulge and whole disk
to calculate the differences. The local gradients of these components are not
large enough to explain these different results.
Our statements above were made for the mean differences of the
color indices between bulges and disks (using the linear regressions).
Figure 13 shows that for the blue color indices (U-B and B-V) the
bulges are redder than the disks for each single galaxy.
This is especially true for U-R, where the mean difference increases
from 0.9 for Sa- to 1.5 for Sc-galaxies. The minimum of the B-R difference is 0.5 mag. This is obviously the consequence of an increased star formation and/or a
younger population in the disks of all Hubble types. Concerning the
red color indices (V-R and R-I), here a few galaxies exist with a bluer
bulge than the disk, however not the majority (Fig. 13).
for late-type spirals (Sc).
In contrast to Peletier & Balcells we used the whole bulge and whole disk
to calculate the differences. The local gradients of these components are not
large enough to explain these different results.
Our statements above were made for the mean differences of the
color indices between bulges and disks (using the linear regressions).
Figure 13 shows that for the blue color indices (U-B and B-V) the
bulges are redder than the disks for each single galaxy.
This is especially true for U-R, where the mean difference increases
from 0.9 for Sa- to 1.5 for Sc-galaxies. The minimum of the B-R difference is 0.5 mag. This is obviously the consequence of an increased star formation and/or a
younger population in the disks of all Hubble types. Concerning the
red color indices (V-R and R-I), here a few galaxies exist with a bluer
bulge than the disk, however not the majority (Fig. 13).
In the following we compare the color indices of the total galaxies
for different Hubble types with some recent evolutionary synthesis results.
Figure 14 shows in the center of each sub-diagram our
observational values U-B, B-V, V-R, and R-I from Sect. 10.1
for Sa-, Sb-, and Sc-spirals, respectively.
The filled circles correspond to the total galaxies, together with
their statistical ![]() error bars.
For comparison reasons the color indices of the corresponding disks
(open circles) and bulges (open triangles) are also drawn.
The data values for these points are the corresponding values for
Sa-, Sb-, Sc-galaxies from the linear regression through
all points in Figs. 11 and 12.
error bars.
For comparison reasons the color indices of the corresponding disks
(open circles) and bulges (open triangles) are also drawn.
The data values for these points are the corresponding values for
Sa-, Sb-, Sc-galaxies from the linear regression through
all points in Figs. 11 and 12.
Bicker et al. (2003) computed chemically consistent models for Sa-, Sb-, Sc-galaxies from their formation until to the age of 15 Gyr. The luminosities of the total galaxies in the filters U, B, V (Johnson) and R, I (Cousins) were calculated as well as the corresponding color indices.
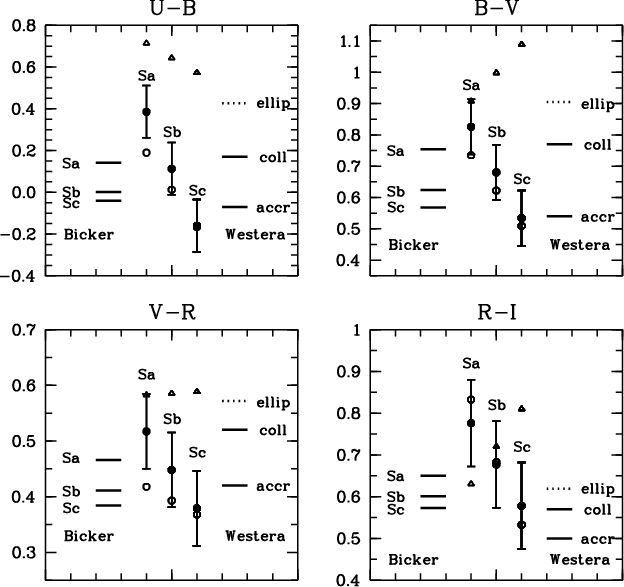 |
Figure 14: Comparison of the observed color indices U-B, B-V (upper row) and V-R, R-I (lower row) for spiral galaxies with evolutionary synthesis models of Bicker et al. (2003) and Westera et al. (2002). The observational values for the total galaxies (filled circles) are drawn in the center, together with their error bars. The color indices of the corresponding disks (open circles) and bulges (open triangles) are also shown. |
| Open with DEXTER | |
On the left-hand sides in the diagrams of Fig. 14 the short
solid lines give the results at 15 Gyr from the
calculations of Bicker et al. The coincidence between observations and models
is different for the different color indices:
U-B: the models do not explain the redder observational values,
especially for the Sa spirals (
![]() mag, i.e. >
mag, i.e. >![]() ).
The Sb galaxies fit satisfying. The bluer observational values of the
Sc-galaxies would fit with a younger age (3.7 Gyr).
B-V and V-R: here we have a fairly good coincidence between
observations and theory. The differences are smaller than the error bars.
R-I: the Sa models are 0.13 mag bluer than the observations
(>
).
The Sb galaxies fit satisfying. The bluer observational values of the
Sc-galaxies would fit with a younger age (3.7 Gyr).
B-V and V-R: here we have a fairly good coincidence between
observations and theory. The differences are smaller than the error bars.
R-I: the Sa models are 0.13 mag bluer than the observations
(>![]() ). For Sb and Sc the models fit at 15 Gyr good or very good.
). For Sb and Sc the models fit at 15 Gyr good or very good.
The general trend is that the evolutionary synthesis models of Bicker et al. (2003) show a smaller spread between Sa-, Sb-, and Sc-galaxies than our observations. Their Sa-galaxy models seem to be too blue in all color indices, especially in U-B and R-I. The differences can not be explained by systematic photometric errors in the observations (see Sect. 9.1).
Westera et al. (2002b) calculated the color evolution of disk galaxy models from z=4 to z=0. They combined the 3-dimensional chemodynamical galaxy models of Samland & Gerhard (2003) with the latest SED library of Westera et al. (2002a) and a new galaxy evolutionary code. They obtained images in all filters U to M for two typical models: a collapse model with a burst-like star-formation phase and a slowly growing accretion model with a long lasting star-formation on a low level.
On the right-hand sides in the diagrams of Fig. 14 the short
solid lines give the z=0 results for the galaxies from the
calculations of Westera et al.
The coincidence between observations and models is good:
U-B: the collapse model has a similar color index as the Sb-galaxies,
the accretion model is similar to the Sc observations.
This is reasonable according to the different star formation scenarios.
B-V: and V-R: this is a really good coincidence between
observation and theory: collapse model for Sa- to Sb-, and accretion model
for Sc-galaxies. The color indices are similar to those of Bicker et al.
R-I: here the collapse- and accretion models are bluer than
the corresponding models of Bicker et al. and have color indices of the
Sc observations. The Sa observations are about 0.2 mag redder than the
collapse models, the difference is larger than ![]() .
For Sb- and Sc-galaxies the corresponding models would still fit
fairly good to the observations.
.
For Sb- and Sc-galaxies the corresponding models would still fit
fairly good to the observations.
The chemodynamical synthesis models of Westera et al. (2002b) fit generally well to the observations: their collapse model to Sa-, or Sb-galaxies, their accretion model to Sc-galaxies. Only their R-I of the collapse model seems to be too blue.
Vazdekis et al. (1996) calculated evolutionary synthesis models for
a sequence of early type (elliptical) galaxies.
The short dotted lines on the right hand sides in Fig. 14
are the predicted color indices (age = 17 Gyr, high star formation rate
![]() ). The open triangles in Fig. 14 are the observed color
indices of the bulges. The scatter here is much large than for the total
galaxies (cf. Figs. 11 and 12).
The observed values tend to be slightly bluer than the models.
However, due to the large scatter no separation between color indices
of bulges from early- or late-type spirals is possible.
). The open triangles in Fig. 14 are the observed color
indices of the bulges. The scatter here is much large than for the total
galaxies (cf. Figs. 11 and 12).
The observed values tend to be slightly bluer than the models.
However, due to the large scatter no separation between color indices
of bulges from early- or late-type spirals is possible.
The correlations between the photometric parameters shown in the preceding sections support different formation mechanisms for bulges in early- or late-type spirals.
It was shown in Sect. 7.1
that the disk scale-lengths ![]() decrease monotonically from U to I,
i.e. in blue light the disks are more extended.
Different hints for such a color dependence of the disk scale-lengths
were already found by several authors.
The physical interpretation for this trend is still in discussion.
Some authors came to the conclusion that this trend is due
to the presence of dust in the inner zone (e.g. Beckman et al. 1996;
Pompei & Natali 1997). Other authors stated, that the color gradients in face-on
spiral galaxies are best explained by age- and metalicity-gradients in the stellar
populations and that dust reddening plays a minor role (e.g. de Jong 1996b).
This would mean that the disks have younger populations at large radii,
i.e. the disks were be formed inside-out. A final decision is not yet possible
at this stage of observations and dust models.
decrease monotonically from U to I,
i.e. in blue light the disks are more extended.
Different hints for such a color dependence of the disk scale-lengths
were already found by several authors.
The physical interpretation for this trend is still in discussion.
Some authors came to the conclusion that this trend is due
to the presence of dust in the inner zone (e.g. Beckman et al. 1996;
Pompei & Natali 1997). Other authors stated, that the color gradients in face-on
spiral galaxies are best explained by age- and metalicity-gradients in the stellar
populations and that dust reddening plays a minor role (e.g. de Jong 1996b).
This would mean that the disks have younger populations at large radii,
i.e. the disks were be formed inside-out. A final decision is not yet possible
at this stage of observations and dust models.
1. Bulge effective radii:
In contrast to the disks, the bulge effective radii
![]() increase from
U to I, with a scatter larger than that of the disks. (right diagram in
Fig. 4).
Evans (1994) calculated the variations on the profiles of disks and bulges
in dependence of the wavelength for different dust distributions. He found
subtle differences in the disk scale-lengths of similar amount as observed.
The disk-bulge models of Evans showed steeper inner profiles due to increasing
dust extinction.
increase from
U to I, with a scatter larger than that of the disks. (right diagram in
Fig. 4).
Evans (1994) calculated the variations on the profiles of disks and bulges
in dependence of the wavelength for different dust distributions. He found
subtle differences in the disk scale-lengths of similar amount as observed.
The disk-bulge models of Evans showed steeper inner profiles due to increasing
dust extinction.
The dust models point to the same direction as the observations.
However, it is not clear if the bulge behaviour in Fig. 4
may be explained by dust extinction alone.
The size of the bulges is also correlated with the Hubble types:
![]() decreases to late spirals
in all filters UBVRI. Since the slope
decreases to late spirals
in all filters UBVRI. Since the slope ![]() is anticorrelated to
is anticorrelated to
![]() (Fig. 6), it seems hard to explain how
dust extinction alone could produce these parameter correlations.
(Fig. 6), it seems hard to explain how
dust extinction alone could produce these parameter correlations.
2. Bulge radial profiles:
The bulge slopes ![]() increase from early- to late-type spirals
(right column of Fig. 6).
As a corollary to the correlation over Hubble types we obtain also a
relation between
increase from early- to late-type spirals
(right column of Fig. 6).
As a corollary to the correlation over Hubble types we obtain also a
relation between
![]() and
and
![]() (Fig. 7).
Together: bulges of early-type spirals are large and have similar
profiles as ellipticals, while the bulges of late-type
spirals are tiny have similar profiles as disks.
(Fig. 7).
Together: bulges of early-type spirals are large and have similar
profiles as ellipticals, while the bulges of late-type
spirals are tiny have similar profiles as disks.
3. Bulge-to-disk size-ratios:
In several studies nearly constant ratios of the characteristic
radii of the disks and bulges were found.
Courteau et al. (1996) stated that late types (Sb, Sc)
are best fitted by an exponential disk plus an exponential bulge
(fixed ![]() ). The ratio of the corresponding scale lengths
was approximately constant:
). The ratio of the corresponding scale lengths
was approximately constant:
![]() (r-band).
(r-band).
Graham (2001) performed two-dimensional fits,
using an exponential disk plus a Sérsic bulge.
Studying different correlations of parameters with Hubble types
he found that the mean
![]() values are larger for early-type
spirals than for the late-type spirals. However, the difference was not
particularly significant. MacArthur et al. (2003) found
values are larger for early-type
spirals than for the late-type spirals. However, the difference was not
particularly significant. MacArthur et al. (2003) found
![]() in the I filter with a mild trend
with Hubble types (
in the I filter with a mild trend
with Hubble types (
![]() for T=5, 1 respectively).
for T=5, 1 respectively).
We found the ratio
![]() to be small (0.06 to 0.15 from U to I)
on a nearly constant level for Sc-, Sbc-, and Sb- spirals, however
increasing significantly towards Sba-, and Sa-spirals (0.4 to 0.7 from U to I),
(Fig. 8 and Table 5). This is another
hint for a coupling of bulge- and disc-structure
in late-type spirals, in contrast to early-type spirals.
to be small (0.06 to 0.15 from U to I)
on a nearly constant level for Sc-, Sbc-, and Sb- spirals, however
increasing significantly towards Sba-, and Sa-spirals (0.4 to 0.7 from U to I),
(Fig. 8 and Table 5). This is another
hint for a coupling of bulge- and disc-structure
in late-type spirals, in contrast to early-type spirals.
4. Bulge luminosities: In Fig. 6 we saw that the bulge/disk-ratios decrease to late spirals in all colors. Correspondingly, Fig. 10 shows that the bulge absolute luminosities decrease to late spirals in all colors, while the total luminosities of the sample galaxies are nearly constant over the Hubble types. Independently on any Hubble classification, one can state that bright and large bulges are of de Vaucouleurs type, while small and faint bulges are of exponential type.
Concerning the structure of the bulges, we observe a systematic change between
early- and late-type spirals: a decrease in effective radius and luminosity and
an increase of the exponent ![]() .
This is not just an effect of
dust extinction. The bulges of early- and late-type spirals are different
in their intrinsic structure.
.
This is not just an effect of
dust extinction. The bulges of early- and late-type spirals are different
in their intrinsic structure.
The decomposition of the spiral galaxies into disks and bulges allowed to calculate the luminosities and color indices of these components.
1. Bulge colors: In contrast to the disks, the color indices of the bulges (Figs. 11 and 12) show no significant gradient over the Hubble types, with a fairly high scatter. However, the bulges are always redder than the disks, for all Hubble types (Fig. 13). Their color indices correspond fairly well to the population synthesis models for ellipticals of Vazdekis et al. (1996), cf. Sect. 11.3. A color separation between bulges of early- and late-type spirals is not possible with our data.
2. Color indices and evolutionary synthesis: In Sect. 11 we compared the observed colors of the total galaxies with different evolutionary-synthesis models. Westera et al. (2002b) calculated the color evolution of disk galaxies for a collapse model and an accretion model, corresponding roughly to an early or secular bulge formation, respectively. The models fit generally well to the observations: their collapse model to Sa-, or Sb-galaxies, their accretion model to Sc-galaxies. This is another support for the existence of at least two different bulge formation mechanisms.
Concluded, early-type spirals have large and bright bulges with profiles similar to elliptical galaxies. These bulges were probably formed prior to the disks in a monolithic collapse or via early mergers. On the other hand, late-type spirals have tiny and faint bulges with strongly color dependent profiles, more similar to disks, especially in the blue colors. They are also correlated in size to the disks. The bulges in these galaxies were probably formed simultaneously or after the disks during a secular evolution process, e.g. from a disk instability (bar). Such a dynamical interaction between disk and bulge occurs on time scales shorter than a Hubble time.
The good consistency between observed color indices and evolutionary synthesis model calculations also supports the two different scenarios: 1. An early collapse of the bulge with a short burst of star formation for early-type spirals. 2. A less vigorous formation of the bulge for late-type spirals with a long-lasting star formation, either by accretion of matter (dwarf companions) or a secular formation of the bulge out of disk material.
These formation scenarios are only typical for early- or late-type spirals, respectively. Obviously we do not observe two distinct classes in the structure parameters, but a continuum. Therefore both mechanisms may work at different epochs in the same galaxies and leave the corresponding traces in the structure (cf. Trager et al. 1999).
The bulge stars are obviously old, but a bulge could have been formed recently, e.g. from a bar instability. An age determination of the bulges of the different spiral galaxies is not possible from out data. Detailed spectral information and line strength measurements would be necessary.
We observe a continuum in nearly all structural parameters
over Hubble types (luminosity, size, shape).
The Hubble type is mainly determined by the bulge/disk-ratio.
Is it possible, that bulges grow such that
galaxies evolve along the Hubble sequence?
Aguerri et al. (2001) showed by collionless N-body simulations that
an exponential bulge can grow due to satellite accretion and transforms
its profile towards smaller ![]() ,
i.e. towards early-type bulges.
However, such an accretion would lead also to a thickening of the disk,
thus the bulge growth must have been occurred before the last formation of
a thin disk in the corresponding galaxy.
,
i.e. towards early-type bulges.
However, such an accretion would lead also to a thickening of the disk,
thus the bulge growth must have been occurred before the last formation of
a thin disk in the corresponding galaxy.
Acknowledgements
This project was supported by the Sonderforschungsbereich 439 of the Deutsche Forschungsgemeinschft (DFG). We are grateful to the Calar Alto team for the effective support during the observations. We acknowledge the use of the SIMBAD database (CNRS data centre, Strasbourg).