A&A 413, 643-655 (2004)
DOI: 10.1051/0004-6361:20034045
L. Scelsi1 - A. Maggio2 - G. Peres1 - Ph. Gondoin3
1 - Dipartimento di Scienze Fisiche ed Astronomiche, Sezione di Astronomia, Università di Palermo, Piazza del Parlamento 1, 90134 Palermo, Italy
2 -
INAF - Osservatorio Astronomico di Palermo, Piazza del Parlamento 1, 90134 Palermo, Italy
3 -
Research and Scientific Support Department, ESA-ESTEC, Noordwijk, The Netherlands
Received 3 July 2003 / Accepted 29 September 2003
Abstract
We have analysed the XMM-Newton X-ray spectra of the yellow
giant 31 Com with the aim of deriving information on the coronal structures of
this archetypical Hertzsprung-gap star. To determine the emission measure
distribution vs. temperature, EM(T), and the elemental abundances of the
coronal plasma, with an accurate line-based approach, we have
developed a new method for simple and accurate line measurements, based on
rebinning and co-adding the two RGS spectra. We have reconstructed the EM(T) independently with both APED and CHIANTI atomic databases in order to
investigate possible differences in the final outcome of the analysis, and we
have obtained consistent results. The derived emission
measure distribution has a well defined peak at
![]() K and
a significant amount of plasma at higher temperatures; there is
also evidence for plasma at temperatures below
K and
a significant amount of plasma at higher temperatures; there is
also evidence for plasma at temperatures below ![]() 106.5 K, with a mean
electron density of
106.5 K, with a mean
electron density of ![]()
![]() cm-3, as inferred from the
line ratio of the O VII triplet. We have made a global fitting of the
EPIC spectra, using multi-component isothermal (3-T) model, and then compared
the results with the EM(T), looking for a consistent multi-temperature
description of both the RGS and EPIC spectra, over the whole spectral range.
While the EM(T) and the 3-T models individually provide a good description of
the data set on which they are based, none of them describes adequately the
data of all the other instruments; the disagreements may be related, at least
in part, to cross-calibration problems. Finally, we have used the EM(T) to derive information about the properties of the coronal structures. Our
results indicate that the corona of 31 Com is dominated by a class of magnetic
loops with peak temperature
cm-3, as inferred from the
line ratio of the O VII triplet. We have made a global fitting of the
EPIC spectra, using multi-component isothermal (3-T) model, and then compared
the results with the EM(T), looking for a consistent multi-temperature
description of both the RGS and EPIC spectra, over the whole spectral range.
While the EM(T) and the 3-T models individually provide a good description of
the data set on which they are based, none of them describes adequately the
data of all the other instruments; the disagreements may be related, at least
in part, to cross-calibration problems. Finally, we have used the EM(T) to derive information about the properties of the coronal structures. Our
results indicate that the corona of 31 Com is dominated by a class of magnetic
loops with peak temperature ![]() 107 K and apparently more isothermal
than the solar ones.
107 K and apparently more isothermal
than the solar ones.
Key words: X-rays: stars - techniques: spectroscopic - stars: activity - stars: coronae - stars: individual: 31 Com
Spatially resolved observations of the solar corona provide us with some hints to interpret the X-ray emission from unresolved late-type stars, in terms of coronal magnetic loops confining an optically thin plasma. On the other hand, the results of past and present analyses of stellar X-ray spectra suggest that in many cases the coronae can not be described simply as a scaled-up version of the solar one; indeed, there is increasing evidence that the coronae of very active stars, with emission levels up to 104 times that of the Sun, are hotter and more isothermal than coronae of solar-type stars (Sanz-Forcada et al. 2002; Guedel 1997; Drake et al. 2000).
One of the central issues in the physics of outer stellar atmospheres is how coronal structures in high-luminosity late-type stars compare with the solar-type coronal loops. Most of the previous analyses of low- or medium-resolution spectra have been performed using simple models with a few isothermal components, which make an interpretation of the observed X-ray emission in terms of coronal structures difficult. Line spectroscopy, finally achievable with the instruments onboard the satellites EUVE, XMM and Chandra, allows us to measure the flux of individual emission lines to derive the emission measure distribution vs. temperature of the coronal plasma, to estimate density and pressure from spectroscopic diagnostics and, more generally, to study the characteristics of the coronal plasma in greater detail than before. These information can be employed to characterize the coronal structures and loop populations using techniques developed for this purposes by Peres et al. (2001) and recently employed for modeling the corona of Capella (Argiroffi et al. 2003).
High X-ray luminosity yellow giants are especially interesting because
(i) their magnetic dynamo is probably very "young'' (Pizzolato et al. 2000),
because in stars with
![]() it is triggered by the onset of
efficient subphotospheric convection occuring in the phase of crossing the
Hertzsprung-gap; (ii) surface gravity is significantly lower than in dwarf stars, with the implication that pressure scale heights are larger and hence
coronae may be significantly more extended than in solar-type stars; (iii) different interpretative models have been suggested for them: hot but otherwise
solar-like coronal structures, or large-scale magnetospheres (Ayres et al. 1998).
it is triggered by the onset of
efficient subphotospheric convection occuring in the phase of crossing the
Hertzsprung-gap; (ii) surface gravity is significantly lower than in dwarf stars, with the implication that pressure scale heights are larger and hence
coronae may be significantly more extended than in solar-type stars; (iii) different interpretative models have been suggested for them: hot but otherwise
solar-like coronal structures, or large-scale magnetospheres (Ayres et al. 1998).
31 Com (HD 111812) is a good target for such a kind of studies because it is a
single star with high X-ray flux at Earth, due to its high X-ray luminosity
(
![]() erg s-1) and its distance
erg s-1) and its distance ![]() pc
(parallax
pc
(parallax
![]() mas, Perryman et al. 1997).
It is an evolved G0III star in the Hertzsprung-gap, having a mass of
mas, Perryman et al. 1997).
It is an evolved G0III star in the Hertzsprung-gap, having a mass of ![]()
![]() and estimated radius of
and estimated radius of ![]()
![]() (Pizzolato et al. 2000). 31 Com is also a rapid rotator, its projected velocity
being
(Pizzolato et al. 2000). 31 Com is also a rapid rotator, its projected velocity
being
![]() km s-1 (de Medeiros & Mayor 1999). This target has
been observed many times with past generation instrumentation: Einstein
(Maggio et al. 1990), ROSAT (Pizzolato et al. 2000), ASCA
(Ueda et al. 2001), EUVE (Ayres et al. 1998). Here we present results of an
XMM-Newton observation, which allowed us to obtain simultaneously
medium-resolution EPIC CCD spectra and high-resolution RGS spectra of this
source. One of the issues addressed in this paper is whether a coherent and
consistent description can be derived from these different data sets, which can
be analyzed with different methods. In fact, while multi-T models are still
adequate to perform global fitting of EPIC CCD spectra, the RGS data call for a
more detailed and accurate analysis based on the identification and measurement
of individual emission lines. A second issue related to the line-based analysis
of the emission line spectra is whether different atomic databases yield
consistent results. In particular, the two most up to date public databases
currently available are APED (Smith et al. 2001) and CHIANTI
(Dere et al. 1997,2001; Young et al. 1998; Landi et al. 1999). The former includes in part the
CHIANTI data, and possibly it is the most complete database because transitions
from high-n states are also included. However the analysis of either
Chandra or XMM-Newton grating spectra is usually performed with
only one of the two databases, and it is not sufficiently clear whether the
results of such analyses can be compared.
km s-1 (de Medeiros & Mayor 1999). This target has
been observed many times with past generation instrumentation: Einstein
(Maggio et al. 1990), ROSAT (Pizzolato et al. 2000), ASCA
(Ueda et al. 2001), EUVE (Ayres et al. 1998). Here we present results of an
XMM-Newton observation, which allowed us to obtain simultaneously
medium-resolution EPIC CCD spectra and high-resolution RGS spectra of this
source. One of the issues addressed in this paper is whether a coherent and
consistent description can be derived from these different data sets, which can
be analyzed with different methods. In fact, while multi-T models are still
adequate to perform global fitting of EPIC CCD spectra, the RGS data call for a
more detailed and accurate analysis based on the identification and measurement
of individual emission lines. A second issue related to the line-based analysis
of the emission line spectra is whether different atomic databases yield
consistent results. In particular, the two most up to date public databases
currently available are APED (Smith et al. 2001) and CHIANTI
(Dere et al. 1997,2001; Young et al. 1998; Landi et al. 1999). The former includes in part the
CHIANTI data, and possibly it is the most complete database because transitions
from high-n states are also included. However the analysis of either
Chandra or XMM-Newton grating spectra is usually performed with
only one of the two databases, and it is not sufficiently clear whether the
results of such analyses can be compared.
Summing up, in this paper we will address both the scientific issue of inferring the properties of coronal structures in high-luminosity coronal sources and issues related to the data analysis. In Sect. 2 we report the details of the observation analyzed here; in Sect. 3 we describe the data reduction and the methods used for the analyses of EPIC and RGS spectra; we show the results in Sect. 4 and discuss them in Sect. 5. Finally, we draw our conclusions in Sect. 6.
31 Com was observed on January 9, 2001, as part of the first XMM-Newton
Guest Observation phase (PI: Ph. Gondoin). The satellite is equipped with three
X-ray telescopes (Gondoin et al. 2000) and carries five detectors: two
European Photon Imaging Cameras with MOS CCDs
(EPIC MOS, Turner et al. 2001), one with pn CCDs
(EPIC pn, Strüder et al. 2001), and two Reflection Grating Spectrometers
(RGS, den Herder et al. 2001). The non dispersive EPIC cameras provide spectral
resolution
![]() in the range 0.1-10 keV; the RGS spectrometers cover the wavelength range 5-38 Å (
0.32-2.5 keV) with
resolution
in the range 0.1-10 keV; the RGS spectrometers cover the wavelength range 5-38 Å (
0.32-2.5 keV) with
resolution
![]() .
For the observation analyzed here, data are
available from all the X-ray detectors on board XMM. Table 1
reports details on the instrument configuration and on the observation (exposure
time, mode of data acquisition, filter and the source count-rates in each
extraction region). RGS1 data are affected by the lack of CCD 7, corresponding
to the spectral region containing the Ne IX triplet, while the RGS2 spectrum lacks the region of the O VII triplet, due to the failure of CCD 4.
.
For the observation analyzed here, data are
available from all the X-ray detectors on board XMM. Table 1
reports details on the instrument configuration and on the observation (exposure
time, mode of data acquisition, filter and the source count-rates in each
extraction region). RGS1 data are affected by the lack of CCD 7, corresponding
to the spectral region containing the Ne IX triplet, while the RGS2 spectrum lacks the region of the O VII triplet, due to the failure of CCD 4.
Table 1: Log of the XMM-Newton observation.
The data were reduced using SAS version 5.3.3 together with the calibration files available at the time of the analysis (summer 2002). The pn and MOS responses were generated with the SAS rmfgen and arfgen tasks. Second order RGS spectra have not been considered, because of their low statistics.
We have selected Good Time Intervals by removing a few short time intervals (![]() 2 ks in total) which show the presence of presumable proton flares
in the X-ray light curve of the background extracted from CCD 9 of the RGS (the excluded intervals are those with background count rate >0.1 cts s-1).
2 ks in total) which show the presence of presumable proton flares
in the X-ray light curve of the background extracted from CCD 9 of the RGS (the excluded intervals are those with background count rate >0.1 cts s-1).
EPIC spectra were analyzed with XSPEC using multi-component thermal models based on the Astrophysical Plasma Emission Database (APED/ATOMDB V1.2).
For line-based analysis of RGS spectra, we employed the software package PINTofALE (Kashyap & Drake 2000) and, in part, also XSPEC and the MIT/CXC Interactive Spectral Interpretation System (ISIS, Houck & Denicola 2000). We have adopted both APED/ATOMDB (V1.2) and the CHIANTI (V3) database, together with the Mazzotta et al. (1998) ionization equilibrium, for line identification and the emission measure analysis.
Note that the RGS Line Spread Functions are characterized by extended wings which often make it impossible to determine the true source continuum emission from the data. We have used the multi-T model best-fitting the EPIC pn spectrum to evaluate the initial guess of the continuum level for the line measurements; it represents a good starting point in the iterative procedure aimed at obtaining the emission measure distribution vs. temperature, as described in Sect. 3.2.
For MOS data, source photons have been extracted from a circular region (60'' radius), and background events from an annular region around the source and inside the central CCD.
The EPIC pn data were affected by pile-up and we avoided this effect by removing the central part of the Point Spread Function, i.e. extracting source counts from an annulus ( 7.5''-50'' radii), within CCD 4; background photons were obtained from the rest of CCD 4, excluding the source and its out-of-time events.
The pn background-subtracted light curve of 31 Com, with time bins of 200 s, is shown in Fig. 1 and it is consistent with the null
hypothesis of a constant emission (
![]() ,
with 175 d.o.f.).
We have verified that the same result follows with a 500 s time
binning.
,
with 175 d.o.f.).
We have verified that the same result follows with a 500 s time
binning.
![\begin{figure}
\par\includegraphics[width=8cm,clip]{0045f1.ps}
\end{figure}](/articles/aa/full/2004/02/aa0045/img21.gif) |
Figure 1: pn light curve in the 1.2-62 Å (0.2-10 keV) band, with time bins of 200 s. The gaps correspond to the time of high background emission, excluded from the analysis. The dotted line marks the mean count rate of the source during the observation. The analysis shows that no significant variability is present. |
| Open with DEXTER | |
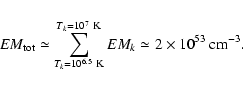
We have used a global fitting to analyze the EPIC spectra
(Fig. 2). The instrumental response of the two MOS detectors
are thought to be very similar so, at first, their data were fitted
simultaneously. Yet, the result of the fitting showed evidence for residual
cross-calibration discrepancies between the two instruments, the major problems
being possibly ascribed to the MOS1; details about this subject are reported in
Appendix B, where we also discuss cross-calibration inconsistencies between the MOS1 and the RGS spectrometers. We eventually performed global fittings of each
of the MOS spectra separately.
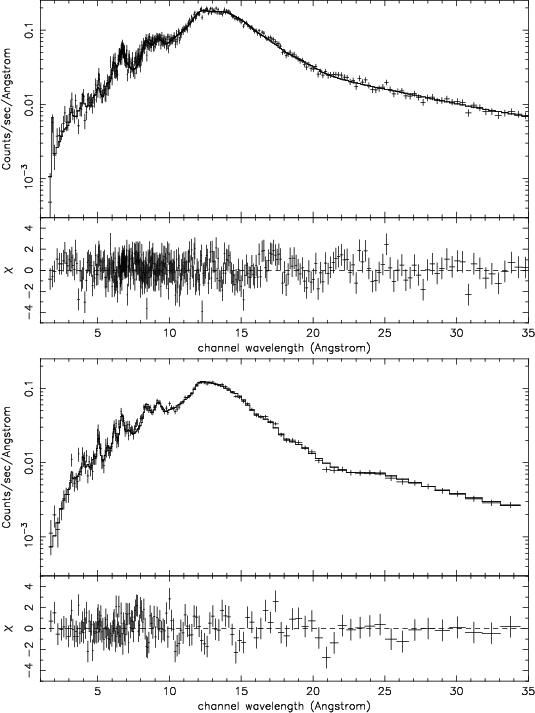 |
Figure 2: EPIC pn (upper) and MOS2 (lower) spectra, with their best-fit model spectra (the parameters of the models are listed in Table 2). |
| Open with DEXTER | |
The model chosen to fit the EPIC spectra is an absorbed, optically-thin, three components thermal plasma; we added a fourth component to investigate whether it is possible to obtain a better description of the data, but we found no improvement. The free abundances of the model are those of O, Ne, Mg, Si, S, Fe and Ni, whose line complexes are strong and clearly detected in EPIC spectra (but also in RGS spectra). On the contrary, the abundances of C, N, Al, Ar and Ca were tied to that of Fe because, when left free to vary, their best-fit values were ill-constrained. This choice allowed us to limit the number of free parameters to 13.
Table 2:
Best-fit models of the EPIC data (in the 1.5-41 Å band), with 90% statistical confidence ranges computed for one interesting parameter at
a time; nominal errors on Ti and EMi are at the 10% level. Element
abundances are relative to the solar ones (Grevesse et al. 1992). Mean
temperatures are calculated as
<T> =
![]() .
.
The analysis of RGS spectra consisted of the following steps: line identification, flux measurements, line screening, reconstruction of the emission measure distribution vs. temperature, EM(T), and simultaneous determination of elemental abundances, followed by estimate of metallicity and check of the solution.
We have combined the RGS1 and RGS2 spectra (Fig. 3) in order to increase the signal-to-noise ratio and, consequently, to make line identification easier and to get more accurate flux measurements. Both RGS spectra are defined, by default, onto 3400 wavelength channels, whose width ranges from 0.007 to 0.014 Å. However, the wavelength grids of RGS1 and RGS2 do not coincide, hence their spectra cannot be summed directly. The approach we adopted to measure line fluxes allowed us to get a self-consistent solution in terms of EM(T) and a set of abundances, i.e. a solution which reproduces the measured fluxes and the continuum level assumed for flux measurements, and which gives a sufficiently accurate description of the RGS spectra of 31 Com, within the limitations of the atomic database (Fig. 4).
For the identification of the strongest emission lines and the measurement of their fluxes, we have co-added the background-subtracted RGS1 and RGS2 spectra, after rebinning each of them on the same grid, and we have adopted a Lorentzian line profile. We give further details on the new methodology we have developed in Appendix A, where we also demonstrate that it provides total line fluxes consistent with those obtained by fitting the line profiles in the individual RGS spectra with the detailed Line Spread Function; on the other hand, our approach allows to work on data with higher S/N ratio.
We based the subsequent EM reconstruction on a set of selected lines, among
the identified ones, whose flux measurements and theoretical emissivities were
reliable. In particular, we rejected lines with low signal-to-noise ratio or
highly blended with others, lines lying in proximity of bad pixels and
inter-chip-gaps, lines whose fluxes are not compatible with those of others lines
of the same ion, according to theoretical estimates (possibly indicating large
uncertainty in the relevant emissivity curves). Finally, we also excluded
density-sensitive lines. In this way, the equation relating the differential
emission measure (
![]() )
of an
optically thin plasma with the flux at Earth Fif of an ion transition from
the level i to the level f contains only temperature-dependent quantities:
)
of an
optically thin plasma with the flux at Earth Fif of an ion transition from
the level i to the level f contains only temperature-dependent quantities:
![\begin{figure}
\par\resizebox{\textwidth}{!}{\includegraphics[clip]{0045f3.ps}}
\end{figure}](/articles/aa/full/2004/02/aa0045/img50.gif) |
Figure 3: Co-added RGS spectrum of 31 Com with the identification of the most prominent lines; the bin size is 0.02 Å. The dashed line represents the continuum emission of the source, derived from the final EM(T) model; note that it is impossible to estimate the continuum from the data in the 10-17 Å range. |
| Open with DEXTER | |
![\begin{figure}
\par\resizebox{\textwidth}{!}{\includegraphics[angle=-90,clip]{0045f4.ps}}
\end{figure}](/articles/aa/full/2004/02/aa0045/img51.gif) |
Figure 4: The "APED'' model spectrum derived from the EM(T) is compared with the original RGS1 and RGS2 spectra. |
| Open with DEXTER | |
The MCMC method is based on the random sampling of the values EM(Tk),
in order to maximize the probability:
![\begin{displaymath}P(F_{1},...,F_{{\rm N}})\propto\exp\left[-~\sum_{j=1}^{N}\frac{(F_{j}-F_{j}^{{\rm pred}})^{2}}{2~\sigma_{j}^{2}}\right]
\end{displaymath}](/articles/aa/full/2004/02/aa0045/img52.gif) |
(2) |
The method also provides estimates of element abundances, relative to iron, with their statistical uncertainties.
We checked the solution obtained with the MCMC in three steps. First,
we compared the line fluxes predicted according to our solution with the
measured ones; we then checked the reliability of the "cool'' and
"hot'' tails of the EM(T) and, at the same time, estimated the iron
abundance, by scaling the emission measure distribution accounting for various
metallicities and by comparing the synthetic spectrum with the observed one, in
selected spectral regions free of overlapping emission lines (these are the
regions at
![]() Å in the RGS spectrum and at
Å in the RGS spectrum and at
![]() Å in
EPIC spectra). We finally checked the consistency between the continuum level
assumed for flux measurements and the predicted continuum. In this analysis we
have found agreement between the observed and predicted fluxes, indicating a
substantially correct shape of the EM(T), at least in the central part of the
temperature range where it is formally constrained, and we have verified a
good agreement between the assumed and the predicted levels of the continuum
even in the wavelength range 10-17 Å, where the large number of blends
does not allow us to estimate it directly. Hence, checking the solution was
successful already after one iteration of the whole procedure, in both the cases
where we used the APED or the CHIANTI database.
Å in
EPIC spectra). We finally checked the consistency between the continuum level
assumed for flux measurements and the predicted continuum. In this analysis we
have found agreement between the observed and predicted fluxes, indicating a
substantially correct shape of the EM(T), at least in the central part of the
temperature range where it is formally constrained, and we have verified a
good agreement between the assumed and the predicted levels of the continuum
even in the wavelength range 10-17 Å, where the large number of blends
does not allow us to estimate it directly. Hence, checking the solution was
successful already after one iteration of the whole procedure, in both the cases
where we used the APED or the CHIANTI database.
Figure 2 shows the pn and MOS2 spectra with their best-fit
models. In these spectra we can clearly detect the line complexes of
Mg XI-XII (![]() 8.5-9.3 Å), Si XIII-XIV (
8.5-9.3 Å), Si XIII-XIV (![]() 6-6.8 Å)
and S XV (
6-6.8 Å)
and S XV (![]() 5 Å), while the complexes of Ar XVII
(
5 Å), while the complexes of Ar XVII
(![]() 4 Å) and Ca XIX (
4 Å) and Ca XIX (![]() 3.2 Å) are only just detectable.
The pn spectrum also shows emission from the Fe XXV 1.85 Å line,
indicating the presence of a hot corona (this ion forms at
3.2 Å) are only just detectable.
The pn spectrum also shows emission from the Fe XXV 1.85 Å line,
indicating the presence of a hot corona (this ion forms at ![]() 107.8 K).
107.8 K).
The fittings were performed in the 1.5-41 Å (0.3-8 keV) interval; we used the result of the EM analysis to fix the coronal ratio between the C and Fe abundances equal to 0.25 times the solar one (Grevesse et al. 1992), while for N, Al, Ar and Ca the abundances were linked to that of Fe assuming the same ratios as the solar case (see the criteria mentioned in Sect. 3.1).
In Table 2 we list the best-fit parameters for the pn and MOS2 data only (the simultaneous fitting of MOS spectra as well as the
description of the MOS1 spectrum alone provided by the 3-T model were not
statistically acceptable; they will be partially discussed in Appendix B).
Note the large emission measures (
![]() cm-3) obtained for
the high temperature components (
cm-3) obtained for
the high temperature components (
![]() MK). Note also that we have
fixed the interstellar absorption at the value
MK). Note also that we have
fixed the interstellar absorption at the value
![]() cm-2measured by Piskunov et al. (1997). If left free to vary, the best fit value
for
cm-2measured by Piskunov et al. (1997). If left free to vary, the best fit value
for ![]() would be
would be ![]()
![]() cm-2, an order of
magnitude higher than that estimated assuming a mean hydrogen density
cm-2, an order of
magnitude higher than that estimated assuming a mean hydrogen density ![]() 0.1 cm-3 (Paresce 1984).
0.1 cm-3 (Paresce 1984).
In the RGS1+RGS2 spectrum of 31 Com (Fig. 3), we have
identified about 80 lines from
Fe XVII-XXIV ions, from He-like and H-like O VII-VIII,
Ne IX-X, Mg XI-XII, Si XIII and C VI ions, and from Ni XIX-XX. These lines are listed in Table 3, where we
made the effort to match the atomic transitions in the CHIANTI database with
those in APED, based on the spectroscopic term, whenever possible![]() . The total number of listed
APED transitions is 219, while in the case of CHIANTI only 135 transitions have
been identified; it is worth noting that there are about 20 spectral
features for which significantly or totally different identifications result
from the two databases. In principle, these differences might yield different
outcomes of the emission measure analyses performed with APED and CHIANTI,
but we will show in the following that consistent results can be obtained with
our approach.
. The total number of listed
APED transitions is 219, while in the case of CHIANTI only 135 transitions have
been identified; it is worth noting that there are about 20 spectral
features for which significantly or totally different identifications result
from the two databases. In principle, these differences might yield different
outcomes of the emission measure analyses performed with APED and CHIANTI,
but we will show in the following that consistent results can be obtained with
our approach.
The lines used for the EM reconstruction with APED or CHIANTI are marked with "a'' or "c'', respectively. Note the few lines making exception to the
selection criteria reported in Sect. 3.2: the resonance line of
the Ne IX triplet was selected although blended with the Fe XIX
lines at ![]() 13.52 Å , because it is the only one with a peak of
emissivity at
13.52 Å , because it is the only one with a peak of
emissivity at
![]() and helps to extend the emission measure
distribution to lower temperatures, after the initial reconstruction using the
Fe lines only; the weak Fe XXIII 8.31 Å line has been included in the
APED selection because it is consistent with the other Fe XXIII-XXIV lines and helps in determining the EM(T) at high temperature
(
and helps to extend the emission measure
distribution to lower temperatures, after the initial reconstruction using the
Fe lines only; the weak Fe XXIII 8.31 Å line has been included in the
APED selection because it is consistent with the other Fe XXIII-XXIV lines and helps in determining the EM(T) at high temperature
(
![]() ); we have also used the strong Fe XVII 17.05 Å line, which lies in proximity of an inter-chip gap, as its flux
agrees with the value obtained by the alternative method described in
Appendix A.
); we have also used the strong Fe XVII 17.05 Å line, which lies in proximity of an inter-chip gap, as its flux
agrees with the value obtained by the alternative method described in
Appendix A.
The emission measure distributions derived with the APED and CHIANTI databases
are shown in Fig. 5; they look very similar and share several
notable features. Considering first the constrained part (i.e. for
which error bars could be derived) in common to both,
![]() ,
we observe agreement within the error bars. Note also that the
"CHIANTI'' distribution resulted statistically constrained in a slightly
larger range with respect to the "APED'' solution, as a consequence of the
smaller number (relative to the total) of lines which form at intermediate
temperatures (
,
we observe agreement within the error bars. Note also that the
"CHIANTI'' distribution resulted statistically constrained in a slightly
larger range with respect to the "APED'' solution, as a consequence of the
smaller number (relative to the total) of lines which form at intermediate
temperatures (
![]() )
in the "CHIANTI'' selection with respect to
the "APED'' one. This caused a slightly different sampling for the EM(Tk) values by the MCMC procedure in the two cases and hence a different set of
constrained values.
)
in the "CHIANTI'' selection with respect to
the "APED'' one. This caused a slightly different sampling for the EM(Tk) values by the MCMC procedure in the two cases and hence a different set of
constrained values.
The two distributions are sharply peaked at ![]() and both show the presence of plasma both at temperatures lower than 106.5 K and higher than 107.2 K. Although we are not able to assign
errors on these "cool'' and "hot'' tails of the EM(T), they are rather
reliable: in fact, the "cool'' tail is needed to adequately describe the
O VIII Ly
and both show the presence of plasma both at temperatures lower than 106.5 K and higher than 107.2 K. Although we are not able to assign
errors on these "cool'' and "hot'' tails of the EM(T), they are rather
reliable: in fact, the "cool'' tail is needed to adequately describe the
O VIII Ly ![]() / O VII ratios, while the "hot'' tail is
required by the Fe XXIII-XXIV lines measured in the RGS spectrum, as well
as by the H-like and He-like complexes of S, Ca, Ar and Fe and the continuum
visible at high energies in the EPIC spectra.
/ O VII ratios, while the "hot'' tail is
required by the Fe XXIII-XXIV lines measured in the RGS spectrum, as well
as by the H-like and He-like complexes of S, Ca, Ar and Fe and the continuum
visible at high energies in the EPIC spectra.
![\begin{figure}
\par\includegraphics[width=8.5cm,clip]{0045f5.ps}
\end{figure}](/articles/aa/full/2004/02/aa0045/img68.gif) |
Figure 5: Emission measure distributions reconstructed with the MCMC method and the APED (solid line) and CHIANTI (dashed line) databases. |
| Open with DEXTER | |
In Fig. 6 we compare the observed and predicted fluxes, most
of which agree within a factor 2; yet, some problems relevant to the
emissivities of Fe XVIII lines in the CHIANTI database are evident, as
the fluxes of the selected Fe XVIII lines, which form at
![]() ,
are all underestimated, except the one at 14.20 Å. In
the case of APED, we do not note such a systematic trend, and only two out of
nine Fe XVIII lines, at 15.87 Å and 16.07 Å , are underestimated.
,
are all underestimated, except the one at 14.20 Å. In
the case of APED, we do not note such a systematic trend, and only two out of
nine Fe XVIII lines, at 15.87 Å and 16.07 Å , are underestimated.
The elemental abundances obtained from both analyses are shown in Table 4 and they are all compatible each others; in both cases, we
estimated an iron abundance in
![]() times the solar one. As an
example, Fig. 7 shows the predicted continuum spectra
for different metallicities superimposed to the observed spectrum, for the
case of the analysis performed with APED.
times the solar one. As an
example, Fig. 7 shows the predicted continuum spectra
for different metallicities superimposed to the observed spectrum, for the
case of the analysis performed with APED.
![\begin{figure}
\par\includegraphics[width=7.7cm,clip]{0045f6a.ps}\par\vspace*{2mm}
\includegraphics[width=7.7cm,clip]{0045f6b.ps}
\end{figure}](/articles/aa/full/2004/02/aa0045/img71.gif) |
Figure 6: Comparison between observed fluxes and the fluxes predicted with the APED (upper panel) and CHIANTI (lower panel) EM(T) models, for lines used in the EM reconstruction; Fe: open diamonds, Ne: triangles, Mg: open squares, Si: filled diamond, Ni: filled circles, O: filled squares, C: open circle. |
| Open with DEXTER | |
Though the wavelength range of the RGS includes the He-like triplets of the ions C V, N VI, O VII, Ne IX, Mg XI and Si XIII, we were able to analyze only the O VII triplet, the others being either not detectable (C V and N VI), or too weak and only partially resolved (Mg XI and Si XIII) or highly blended with Fe XIX lines (Ne IX).
We determined the plasma electron density and temperature, averaged over the
region where the triplet forms, from the ratios
![]() and
and
![]() respectively (Porquet et al. 2001; Gabriel & Jordan 1969), where f is the flux of the forbidden line, i of the intercombination line and rof the resonance line. Due to the low photon counting statistics (Table 3), the errors on these ratios are very large: we obtain
respectively (Porquet et al. 2001; Gabriel & Jordan 1969), where f is the flux of the forbidden line, i of the intercombination line and rof the resonance line. Due to the low photon counting statistics (Table 3), the errors on these ratios are very large: we obtain
![]() and
and
![]() ,
and hence we derive a
mean plasma density of
,
and hence we derive a
mean plasma density of
![]() (with 68% confidence range
(with 68% confidence range ![]()
![]() )
and an average temperature of
)
and an average temperature of
![]() K, using the theoretical curves by Smith et al. (2001). From the
values of
K, using the theoretical curves by Smith et al. (2001). From the
values of ![]() and
and ![]() we can estimate the average pressure
relative to the region where the triplet forms:
we can estimate the average pressure
relative to the region where the triplet forms:
![]() dyn cm-2, with an uncertainty range (extremes of the product
dyn cm-2, with an uncertainty range (extremes of the product
![]() )
)
![]() 1.5-220 dyn cm-2.
1.5-220 dyn cm-2.
Table 4: Ratios between elemental and iron coronal abundances, relative to the solar photospheric ratios (Grevesse et al. 1992), derived from RGS data, using the APED and CHIANTI databases; errors are at 68% confidence level. For each element, the number of lines included in the EM reconstruction is also shown.
![\begin{figure}
\par\includegraphics[width=8cm,clip]{0045f7.ps}
\end{figure}](/articles/aa/full/2004/02/aa0045/img94.gif) |
Figure 7: Comparison between observed spectrum and continuum emission predicted with the EM(T) for different metallicities Z; we have used the APED database. |
| Open with DEXTER | |
We performed the two analyses with the APED and CHIANTI databases indipendently
from each other, with the consequence that the sets of selected lines are not
the same. This choice is motivated by the need of testing the overall effect
of one database with respect to the other on the EM reconstruction. Although
some ion transitions may be described with emissivity curves significantly
different in the two databases (Fig. 8), we have found that the
two EM solutions are compatible, as shown in Fig. 5 and in
Table 4.
| |
Figure 8: Examples of differences between emissivity curves of the same transitions in the APED (solid line) and CHIANTI (dashed line) databases. |
| Open with DEXTER | |
The reason of the robustness of our result is that the emission measure
reconstruction is based on a set of several lines
and the EM distribution averages the information at each temperature coming
from the lines forming around that temperature. Therefore, we may find
significant discrepancies between the two solutions if there exist systematic
differences between the line emissivity functions in the two databases and,
in order to be relevant, these differences should affect several lines over a
rather large interval of temperature. In practice, though most of the fluxes
of Fe XVIII lines turn out to be systematically underestimated with
the EM(T) reconstructed using the CHIANTI database (see lower panel in
Fig. 6), suggesting possible uncertainties in their
emissivities, this occurrence did not affect the result appreciably, because
some information on the amount of plasma at
![]() (the temperature
of formation of Fe XVIII) is also provided by the strength of the Fe XVII and Fe XIX lines included in the analysis.
(the temperature
of formation of Fe XVIII) is also provided by the strength of the Fe XVII and Fe XIX lines included in the analysis.
As a further remark, we note that lines which largely disagree with others of the same ion are rejected in the selection phase; the disagreement may be due to errors in the emissivity functions, but also to the incompleteness of the database: in fact, one of the databases may ignore transitions giving important contributions to an observed spectral line (see in Table 3, for example, the lines at 10.10 Å, 10.36 Å, 15.09 Å, 15.87 Å, included in the analysis performed with APED, but not in that with CHIANTI).
In Figs. 9 and 10 we compare the results obtained
from the RGS and EPIC data. Figure 9 shows that the two hottest
components of the pn and MOS2 3-T models agree; they are also consistent with
the shape of the EM(T), which peaks at
![]() K and shows the
presence of plasma at higher temperatures. On the contrary, the cool
components are different; in particular, the pn best-fitting model provides a
significant emission measure at
K and shows the
presence of plasma at higher temperatures. On the contrary, the cool
components are different; in particular, the pn best-fitting model provides a
significant emission measure at
![]() K, where the EM(T) has
its minimum.
K, where the EM(T) has
its minimum.
![\begin{figure}
\par\includegraphics[width=8.5cm,clip]{0045f9.ps}
\end{figure}](/articles/aa/full/2004/02/aa0045/img98.gif) |
Figure 9:
RGS-derived EM distribution (histogram; dashed in poorly
constrained regions) and EPIC best-fit 3-T solutions (squares for the pn and
diamonds for the MOS2). The dotted line is the power-law
|
| Open with DEXTER | |
![\begin{figure}
\par\includegraphics[width=8.2cm,clip]{0045f10.ps}
\end{figure}](/articles/aa/full/2004/02/aa0045/img99.gif) |
Figure 10: Ratios between the elemental abundances of Fe and other elements, relative to the solar photospheric ratios (Grevesse et al. 1992), as a function of first ionization potential, derived from RGS (triangles), pn (squares) and MOS2 (diamonds). |
| Open with DEXTER | |
![\begin{figure}
\par\includegraphics[width=8cm,clip]{0045f11a.ps}\par\vspace*{2mm}
\includegraphics[width=8cm,clip]{0045f11b.ps}
\end{figure}](/articles/aa/full/2004/02/aa0045/img100.gif) |
Figure 11: Comparison between observed fluxes and the fluxes predicted with the pn 3-T model (upper panel) and MOS2 3-T model (lower panel), for lines used in the EM reconstruction; Fe: open diamonds, Ne: triangles, Mg: open squares, Si: filled diamond, Ni: filled circles, O: filled squares, C: open circle. |
| Open with DEXTER | |
In Fig. 10 we plot the elemental ratios
![]() derived from these three models vs.
First Ionization Potential (FIP). We observe the largest discrepancies for Ni (the MOS2 value is significantly lower than the pn and RGS values) and Ne (the
pn value is the highest), and we note a marginal inconsistency between the
values for S (available from MOS2 and pn spectra only).
derived from these three models vs.
First Ionization Potential (FIP). We observe the largest discrepancies for Ni (the MOS2 value is significantly lower than the pn and RGS values) and Ne (the
pn value is the highest), and we note a marginal inconsistency between the
values for S (available from MOS2 and pn spectra only).
We have tested the capability of the 3-T models to describe the strength of
individual emission lines with the ratios between observed and predicted
fluxes shown in Fig. 11. By comparing this figure with
the analogous one for the EM model (Fig. 6), we find that
the best overall description of the measured fluxes is provided by the RGS EM model, as expected; we note that this model underestimates the flux of the
Ne IX resonance line, but we suspect that its measurement is not
accurate, owing to the blend with Fe XIX (![]() 13.52 Å). On
the other hand, none of these models describes well the selected Ne IX 13.46 Å and Ne X 12.14 Å lines at the same time, supporting
this hypothesis. The quality of the pn model seems to be comparable to that of
the EM(T), but this model overpredicts all the strong Fe XVII line
fluxes, the O VII-VIII lines, as well as the Ne X line (whose
measurement is more accurate than the Ne IX one). The main problems
with the MOS2 model are instead the underprediction of the O VII and
C VI lines, because of the too high temperature of the coolest
component (
13.52 Å). On
the other hand, none of these models describes well the selected Ne IX 13.46 Å and Ne X 12.14 Å lines at the same time, supporting
this hypothesis. The quality of the pn model seems to be comparable to that of
the EM(T), but this model overpredicts all the strong Fe XVII line
fluxes, the O VII-VIII lines, as well as the Ne X line (whose
measurement is more accurate than the Ne IX one). The main problems
with the MOS2 model are instead the underprediction of the O VII and
C VI lines, because of the too high temperature of the coolest
component (
![]() MK), and of the Ni lines, as a consequence of the
lower abundance derived for Ni by fitting the MOS2 spectrum with respect to
the other cases.
MK), and of the Ni lines, as a consequence of the
lower abundance derived for Ni by fitting the MOS2 spectrum with respect to
the other cases.
Vice versa, by comparing the EM model spectrum (convolved with the pn and MOS2
responses) with the relative data of EPIC detectors, we have found systematic
discrepancies at energies above ![]() 15 Å.
15 Å.
It is evident that there is still some disagreement between the descriptions of the coronal plasma temperature structure, as independently derived from detailed emission measure analysis of RGS spectra or from multi-T fitting of EPIC spectra. Such disagreements may be in part due to cross-calibrations uncertainties between the detectors, relevant at low energies and possibly not restricted to the MOS1 (see Appendix B).
Anyway, although 3-T models may suffice to describe EPIC spectra, we emphasize
their roughness for a non-ambigous determination of the thermal structure of
coronal plasma, as described by EM models. To shed light on this aspect, we
have generated X-ray spectra with the APED EM(T) model (see
Fig. 5 and Table 4), using the same exposure
times as in the pn and MOS observations (Table 1), convolved
them with the current pn and MOS instrumental responses and applied poissonian
statistics randomization to the relevant photon count numbers. We have then
fitted these simulated pn and MOS spectra with absorbed 3-T models. Since the
instrumental responses used to generate and fit each of the EPIC spectra are
exactly the same, we can exclude any problem related to their unprecise
knowledge, thus focusing just on the ability of pn- and MOS-like detectors in
determining the thermal structure of coronal plasma. In brief, the most
interesting result of this analysis is shown in Fig. 12:
the two hottest components for the pn and the MOS models still agree with
each others and are coherent with the EM(T), but the cool components do not.
This demonstrates that, even if we know exactly the instrumental responses of
two detectors like the pn and MOS, the results of 3-T model fitting are
inherently affected by some ambiguity about the description of the coronal
thermal structure: in the example considered, i.e. a source whose thermal
structure is described by the EM(T) shown in Fig. 12,
the coolest components remain ill-determined.
![\begin{figure}
\par\includegraphics[width=7.5cm,clip]{0045f12.ps}
\end{figure}](/articles/aa/full/2004/02/aa0045/img103.gif) |
Figure 12: 3-T solutions best-fitting the pn and MOS simulated spectra, generated with the same EM(T) (histogram) shown in figure. |
| Open with DEXTER | |
As for the abundances, we consider the values obtained with the RGS the most accurate ones because they are based on individual line measurements, but it is worth noting that the abundances derived from the EPIC data (as well as those recovered by fitting the simulated spectra) differ at most by a factor 2 for some of the elements (see Ne and Ni in Fig. 10); hence, we conclude that 3-T model fitting of XMM/EPIC spectra of quality similar to those of 31 Com may suffice in determining the general behavior of the abundances vs. FIP in stellar coronae. On the other hand, a detailed analysis of XMM and Chandra observations of AB Dor (Sanz-Forcada et al. 2003) shows that 3-T models are not adequate to fit high-resolution X-ray spectra in a reliable way, and a line-based approach is preferable whenever feasible.
In the past years, several works have investigated the presence of a "First Ionization Potential (FIP) effect'' in stellar coronae (Laming & Drake 1999; Bowyer et al. 2000; Drake et al. 1997), namely an enhancement of low-FIP elemental abundances in corona with respect to photospheric values, as proposed for the Sun (see, for a recent review, Feldman & Laming 2000). Most recently Audard et al. (2003) have studied a sample of RS CVn-like binary systems and have suggested that the FIP bias is correlated with the activity level, changing from a marked inverse FIP effect in highly active stars to a possible solar-like effect in low activity stars. We do not find evidence of either a clear FIP effect or an inverse FIP effect for the case of 31 Com (Fig. 10), but rather we observe a pattern of abundances vs. FIP with an initial decrease (with respect to solar photospheric values) down to a minimum value for carbon, followed by increasing abundances for elements with higher FIP (>11 eV), similar to the pattern found for the young active star AB Dor by Sanz-Forcada et al. (2003).
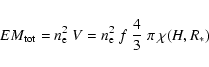
We use the EM model distribution derived from RGS data to get clues on the loop population and on the properties of the quiescent coronal structures in 31 Com. Indeed, the light curve in Fig. 1 does not show any flare, thus supporting the hypothesis of an X-ray emission coming from stationary structures.
Owing to the low surface gravity of the star (
![]() )
and to the high coronal temperatures, the pressure scale height
)
and to the high coronal temperatures, the pressure scale height ![]() is
of the order of the radius of 31 Com (
is
of the order of the radius of 31 Com (
![]() cm):
we obtain
cm):
we obtain
![]() cm for
cm for
![]() K, and
K, and
![]() cm for
cm for
![]() K, where the lines
contributing to the bulk of the observed X-ray emission form. We tentatively
assume that the structures responsible for the observed emission have
characteristic lengths smaller than the pressure scale height (see below). Under
this hypothesis, the pressure is approximatively uniform inside each loop,
implying that the emission measure distribution of a single loop depends only on
its maximum temperature
K, where the lines
contributing to the bulk of the observed X-ray emission form. We tentatively
assume that the structures responsible for the observed emission have
characteristic lengths smaller than the pressure scale height (see below). Under
this hypothesis, the pressure is approximatively uniform inside each loop,
implying that the emission measure distribution of a single loop depends only on
its maximum temperature
![]() (Maggio & Peres 1996), with a functional form
(Maggio & Peres 1996), with a functional form
![]() for
for
![]() .
Considering that the EM(T) of
the whole stellar corona is the sum of the em(T) of individual loops,
following the approach by Peres et al. (2001) we interpret the constrained part
of the EM(T) as due to a population of loops, each of them having
.
Considering that the EM(T) of
the whole stellar corona is the sum of the em(T) of individual loops,
following the approach by Peres et al. (2001) we interpret the constrained part
of the EM(T) as due to a population of loops, each of them having
![]() ,
and whose distribution in
,
and whose distribution in
![]() is
negligible for
is
negligible for
![]() K. In fact, according to this model, the
total EM(T) would be proportional to
K. In fact, according to this model, the
total EM(T) would be proportional to
![]() for
for
![]() ,
and we observe that the emission measure
distribution for 31 Com is approximatively a power-law for
,
and we observe that the emission measure
distribution for 31 Com is approximatively a power-law for
![]() (Fig. 9).
By means of a linear fitting over the latter temperature range, we have
estimated the power-law slope
(Fig. 9).
By means of a linear fitting over the latter temperature range, we have
estimated the power-law slope
![]() ,
which we assume as a
characteristic of the emission measure distribution of individual loops. Note
that loop models with constant cross-section and uniform heating would have
,
which we assume as a
characteristic of the emission measure distribution of individual loops. Note
that loop models with constant cross-section and uniform heating would have
![]() ,
which well describes the ascending slope of the emission measure
distribution derived for the solar corona as a whole
(Peres et al. 2000; Orlando et al. 2000). The larger value we have obtained indicates
that the dominant structures in the corona of 31 Com, having
,
which well describes the ascending slope of the emission measure
distribution derived for the solar corona as a whole
(Peres et al. 2000; Orlando et al. 2000). The larger value we have obtained indicates
that the dominant structures in the corona of 31 Com, having
![]() K or higher, may be different from the solar ones
K or higher, may be different from the solar ones![]() . Such structures
are characterized by an excess of plasma emission measure at high temperatures,
with respect to the solar case, that might be attained if the heating were
concentrated at the loop footpoints, where the radiative losses are higher; in
this way, the thermal conductive flux from the loop apex to the footpoints would
play a minor role in the energy balance, thus flattening the temperature profile
along the loop.
. Such structures
are characterized by an excess of plasma emission measure at high temperatures,
with respect to the solar case, that might be attained if the heating were
concentrated at the loop footpoints, where the radiative losses are higher; in
this way, the thermal conductive flux from the loop apex to the footpoints would
play a minor role in the energy balance, thus flattening the temperature profile
along the loop.
We emphasize that what just stated refers to the dominant population
of coronal loops, at
![]() K and higher; indeed, the
derived EM(T) suggests the presence of a cooler class of structures, at
K and higher; indeed, the
derived EM(T) suggests the presence of a cooler class of structures, at
![]() K, but the available data do not allow us to obtain
information about their
K, but the available data do not allow us to obtain
information about their ![]() value.
value.
Using a simplified coronal model, we can now show that the hypothesis
of loops shorter than the pressure scale height is not at all restrictive.
Let H be the height of the coronal loops with
![]() K.
The total volume of these structures is
K.
The total volume of these structures is
![\begin{displaymath}V \simeq f~\frac{4}{3}~\pi~\left[(R_{*}+H)^{3}-R_{*}^{3}\right]=f~\frac{4}{3}~\pi~\chi (H,R_{*})
\end{displaymath}](/articles/aa/full/2004/02/aa0045/img121.gif) |
(3) |
 |
(4) |
 |
(5) |
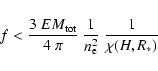 |
(7) |
![\begin{figure}
\par\includegraphics[width=7.5cm,clip]{0045f13.ps}
\end{figure}](/articles/aa/full/2004/02/aa0045/img127.gif) |
Figure 13:
Filling factor (f) as a function of the density (assumed to be
uniform along the loop), for different values of the loop height. If |
| Open with DEXTER | |
From the analysis of the far-ultraviolet spectrum of 31 Com taken with the
Space Telescope Imaging Spectrograph, Ayres et al. (2003) have found
evidence for excess broadening, with respect to the thermal and instrumental
ones, in the semipermitted subcoronal O V 1371 Å line and in the
forbidden coronal Fe XXI 1354 Å line; in an analogous study of spectra
taken with the Far Ultraviolet Spectroscopic Explorer,
Redfield et al. (2003) have found evidence for anomalously large broadening of the
Fe XVIII 974 Å coronal forbidden line. They interpret the large line
widths![]() in terms of rotational broadening, which could indicate
emission from highly extended coronal regions. In the following we examine the
compatibility of this interpretation with our results.
in terms of rotational broadening, which could indicate
emission from highly extended coronal regions. In the following we examine the
compatibility of this interpretation with our results.
First, we observe that, if we accept the hypothesis of rotational broadening and
the values of the line widths measured by Ayres et al., the regions where the O V (
![]() K) and the Fe XXI (
K) and the Fe XXI (
![]() K)
lines form would be located respectively at
K)
lines form would be located respectively at ![]()
![]() cm and
cm and ![]()
![]() cm above the photosphere; the uncertainty on the width
of the Fe XVIII 974 Å line measured by Redfield et al. is too large
for deriving any further useful information.
cm above the photosphere; the uncertainty on the width
of the Fe XVIII 974 Å line measured by Redfield et al. is too large
for deriving any further useful information.
Second, we have compared the observed fluxes of these Fe XXI and
Fe XVIII lines with those predicted with the EM(T) computed in the
present work![]() , and we have found excellent agreement for the Fe XXI line (
, and we have found excellent agreement for the Fe XXI line (
![]() erg cm-2 s-1 observed vs.
erg cm-2 s-1 observed vs.
![]() predicted) and agreement within a factor 1.5 for the
Fe XVIII line (
predicted) and agreement within a factor 1.5 for the
Fe XVIII line (
![]() erg cm-2 s-1 observed vs.
erg cm-2 s-1 observed vs.
![]() predicted). So, the bulk of the
EM(T) describes well also these UV and far-UV lines, and we can deduce that
all the plasma at
predicted). So, the bulk of the
EM(T) describes well also these UV and far-UV lines, and we can deduce that
all the plasma at ![]() 107 K, i.e. at the top of the loops which dominate
in the corona of 31 Com, is located at
107 K, i.e. at the top of the loops which dominate
in the corona of 31 Com, is located at ![]() 1012 cm above the photosphere.
Note that the height of these structures is comparable to the pressure scale
height and hence they are approximatively in isobaric condition. Therefore, our
results would be compatible with those of Ayres, Redfield and collaborators for
apex densities and filling factors constrained by the curve in Fig. 13 corresponding to H=1012 cm.
1012 cm above the photosphere.
Note that the height of these structures is comparable to the pressure scale
height and hence they are approximatively in isobaric condition. Therefore, our
results would be compatible with those of Ayres, Redfield and collaborators for
apex densities and filling factors constrained by the curve in Fig. 13 corresponding to H=1012 cm.
For the rest of our analysis we need the plasma density
at the top of the hot (
![]() K) loops.
From the XMM-Newton data, we have derived an estimate of
the (average) plasma density only at
K) loops.
From the XMM-Newton data, we have derived an estimate of
the (average) plasma density only at
![]() K, namely
at the temperature of formation of the O VII triplet (see Sect. 4.2.3). The related plasma pressure of
K, namely
at the temperature of formation of the O VII triplet (see Sect. 4.2.3). The related plasma pressure of ![]() 13 dyn cm-2cannot be ascribed to the hot loops, but rather, more likely, to cooler loops
with
13 dyn cm-2cannot be ascribed to the hot loops, but rather, more likely, to cooler loops
with
![]() K, as suggested by the shape of the derived EM(T) (Fig. 9). If we assume that indeed the corona of 31 Com
is made of at least two classes of loops, and that loops with higher
K, as suggested by the shape of the derived EM(T) (Fig. 9). If we assume that indeed the corona of 31 Com
is made of at least two classes of loops, and that loops with higher
![]() have higher pressure, in analogy with the case of Capella
(see Argiroffi et al. 2003) which is similar to 31 Com, then the
extended structures with
have higher pressure, in analogy with the case of Capella
(see Argiroffi et al. 2003) which is similar to 31 Com, then the
extended structures with
![]() cm and
cm and
![]() K
should have pressure values larger than what derived from the O VII triplet. Given the uncertainty on the density measurement and assuming
conservatively that the hot loops have
K
should have pressure values larger than what derived from the O VII triplet. Given the uncertainty on the density measurement and assuming
conservatively that the hot loops have
![]() dyn cm-2, i.e.
the lowest value compatible with our results in Sect. 4.2.3,
we obtain a lower limit for the apex density of these extended loops
(
dyn cm-2, i.e.
the lowest value compatible with our results in Sect. 4.2.3,
we obtain a lower limit for the apex density of these extended loops
(
![]() cm-3) and hence, from Fig. 13, a strict upper limit to the filling factor (f < 4%), too
small to be compatible with the absence of variability observed for this star.
cm-3) and hence, from Fig. 13, a strict upper limit to the filling factor (f < 4%), too
small to be compatible with the absence of variability observed for this star.
Finally, the magnetic field needed to confine the plasma inside these long
structures should be larger than ![]() 6 G. In particular, this value applies
to the plasma at the loop apex, and a simple extrapolation to the photospheric
level yield surface magnetic fields of the order of 103 G up to 104 G,
depending on the assumed depth of a magnetic dipole configuration. Future
observations and estimates of density and magnetic field could help in
clarifying the issue of the coronal structures in Hertzsprung-gap giants which,
in our opinion, remains still open.
6 G. In particular, this value applies
to the plasma at the loop apex, and a simple extrapolation to the photospheric
level yield surface magnetic fields of the order of 103 G up to 104 G,
depending on the assumed depth of a magnetic dipole configuration. Future
observations and estimates of density and magnetic field could help in
clarifying the issue of the coronal structures in Hertzsprung-gap giants which,
in our opinion, remains still open.
In this work we have analyzed XMM-Newton X-ray spectra of the high-luminous Hertzsprung-gap star 31 Com, focusing both on methodological issues and on the scientific aspect of deriving information about the magnetic coronal structures confining the emitting plasma.
At least for RGS spectra with photon counting statistics similar to that of the spectra of 31 Com, we have shown that: (i) flux measurements can be obtained from rebinned and co-added RGS spectra, using a Lorentzian as the line profile, provided the continuum level is estimated independently from the data; this method provides accurate line fluxes in a faster way than using individual RGS spectra and the detailed Line Spread Function for each spectral line; (ii) the emission measure distributions and the abundance sets obtained from RGS spectra with the two most up to date public emissivity databases currently available, i.e. APED and CHIANTI, are compatible, thus demonstrating the robustness of the method we have adopted and the reliability of our results.
By comparing 3-T models that fit the EPIC spectra and the emission measure distribution derived from RGS spectra, we have found some disagreements which have revealed cross-calibration uncertainties between the detectors onboard XMM-Newton, as well as the ambiguity of 3-T models in describing the thermal structure of coronal plasma. More precisely, we have found that (i) low-temperature components, as derived from pn and MOS spectra separately, may differ significantly; (ii) the metallicity obtained by fitting the MOS spectra is lower by a factor 2 than the values obtained with the pn and RGS data; (iii) it is difficult, if not impossible, to guess the shape of the emission measure distribution vs. temperature, as derived from the analysis of RGS spectra, starting from 3-T best-fit models. We stress that the above results (i) and (ii) should not be generalized naively to other cases of thermal emission line source, i.e. we are not claiming that they represent a systematic bias in the analysis results (for different outcomes, see, e.g., Franciosini et al. 2002; Güdel et al. 2001). We conclude that, at present, some care is needed to interpret the results of XMM-Newton observations, especially when these results are based on only one of the EPIC detectors. The calibration effort of the XMM instruments is still ongoing (Kirsch 2003) and hence we are confident that some inconsistencies among the various instruments will be likely resolved in the near future.
The EM(T) of 31 Com peaks at
![]() K and the ascending part of the
distribution, for
K and the ascending part of the
distribution, for
![]() ,
is approximatively
proportional to T5. The steep slope of the EM(T) confirm itself to be a
characteristic of high-luminous stellar coronae, as already found in the case of
Capella (Argiroffi et al. 2003), and not necessarily associated to active binary
systems (in fact 31 Com is a putative single G-type giant). The corona of 31 Com
appears to be dominated by a class of loops with maximum temperature
,
is approximatively
proportional to T5. The steep slope of the EM(T) confirm itself to be a
characteristic of high-luminous stellar coronae, as already found in the case of
Capella (Argiroffi et al. 2003), and not necessarily associated to active binary
systems (in fact 31 Com is a putative single G-type giant). The corona of 31 Com
appears to be dominated by a class of loops with maximum temperature ![]() 107 K, having a steeper profile of the emission measure distribution
vs. temperature with respect to the solar case; to explain the derived value of
the total emission measure of such structures, relatively small loop lengths
(L < R*) are generally possible with filling factors strongly dependent on
the plasma density, while extended structures necessarily imply very low apex
densities (
107 K, having a steeper profile of the emission measure distribution
vs. temperature with respect to the solar case; to explain the derived value of
the total emission measure of such structures, relatively small loop lengths
(L < R*) are generally possible with filling factors strongly dependent on
the plasma density, while extended structures necessarily imply very low apex
densities (
![]() cm-3) or very small filling factors,
hardly compatible with the absence of variability.
cm-3) or very small filling factors,
hardly compatible with the absence of variability.
Acknowledgements
We thank V. Kashyap and J. Drake for allowing us to use their software for the emission measure reconstruction. We also thank J. Sanz-Forcada for his help in the use of ISIS. Finally we acknowledge partial support from Ministero dell'Istruzione, dell'Università e della Ricerca and from Agenzia Spaziale Italiana.
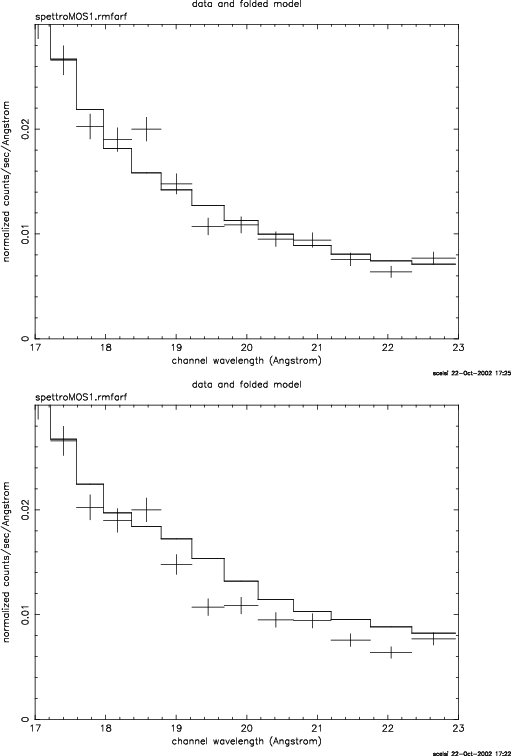
We also show that the cross-calibration between MOS1 and RGS is not consistent
in the region including the O VIII
![]() and the O VII triplet. Essentially, the MOS1 and MOS2 best-fit models (as stated in Sect. 4.1 the former is not statistically acceptable) differ
significatively for the coolest temperature T1 and the O abundance.
In particular, these values for the MOS1 model
(
and the O VII triplet. Essentially, the MOS1 and MOS2 best-fit models (as stated in Sect. 4.1 the former is not statistically acceptable) differ
significatively for the coolest temperature T1 and the O abundance.
In particular, these values for the MOS1 model
(
![]() K and
K and
![]() )
imply that this model lacks appreciable contributions from the O lines, in fact
it underpredicts the O VIII and O VII lines in RGS spectrum
(upper panel in Fig. B.2); nevertheless, the model
fits the data in this region (upper panel in Fig. B.3). On the
contrary, the MOS2 model (Table 2) describes well the
O VIII Ly
)
imply that this model lacks appreciable contributions from the O lines, in fact
it underpredicts the O VIII and O VII lines in RGS spectrum
(upper panel in Fig. B.2); nevertheless, the model
fits the data in this region (upper panel in Fig. B.3). On the
contrary, the MOS2 model (Table 2) describes well the
O VIII Ly![]() ,
underpredicting only the O VII triplet
(Fig. 11 and lower panel in Fig. B.2).
,
underpredicting only the O VII triplet
(Fig. 11 and lower panel in Fig. B.2).
To underline better the inconsistencies between the MOS and RGS detectors, we
have fixed to zero the O abundance in the MOS1 model and we have simulated
the O lines by adding four monochromatic components at the wavelengths of the
O VIII Ly![]() and the O VII triplet, their fluxes equal
to the measured ones in RGS spectrum. The result is shown in the lower panel
of Fig. B.3: note the systematic overprediction of the model
with respect to the data, which may indicate just an erroneous calibration
between the MOS1 and the RGS detectors.
and the O VII triplet, their fluxes equal
to the measured ones in RGS spectrum. The result is shown in the lower panel
of Fig. B.3: note the systematic overprediction of the model
with respect to the data, which may indicate just an erroneous calibration
between the MOS1 and the RGS detectors.
We have repeated the same analysis for the MOS2, but we did not observe this
kind of disagreement. We explain this by noting that the MOS2 model describes
well the strong O VIII Ly![]() and, owing to the spectral
resolution (
and, owing to the spectral
resolution (
![]() Å at these wavelengths), the far weaker
O VII lines are not relevant for the comparison between model and data.
Å at these wavelengths), the far weaker
O VII lines are not relevant for the comparison between model and data.
We conclude that the calibration problems are much more serious for the MOS1.
Table 3: Strongest lines in the spectrum of 31 Com.
We have performed flux measurements on the spectrum defined as the sum of
rebinned RGS1 and RGS2 spectra, using the software PINTofALE.
The wavelength grids of the rebinned spectra are the same; the new channels
(1700 in all) range from 4 to 38 Å and have a constant width equal to 0.02 Å , i.e. twice larger than the mean width of the original ones. The
errors on the counts in each channel have been estimated according to
Gehrels (1986).
Since the rebinning does not alter the Line Spread Function (LSF), we can
characterize the response of the co-added spectrum with the total LSF,
defined as:
 |
(8) |
The line wavelength and the total line counts have been derived with the
fitting procedure. We have nearly always performed multi-component fitting,
because of the frequent blends in the spectrum of 31 Com, with the continuum
initially fixed to the level estimated from the 3-temperature fit of the EPIC pn spectrum. The statistical uncertainties on line wavelengths and counts have
been evaluated at the 68% confidence level. An example of line fitting is
shown in Fig. A.2. The measured flux of a line and its error should
be multiplied by a corrective factor, if the integral of the
![]() and
that of the Lorentzian, which best approximates it, are not the same. This was
not the case in our analysis, because their relative differences were lower
than the relative errors on the flux by an order of magnitude, for the lines
selected for the emission measure reconstruction
and
that of the Lorentzian, which best approximates it, are not the same. This was
not the case in our analysis, because their relative differences were lower
than the relative errors on the flux by an order of magnitude, for the lines
selected for the emission measure reconstruction![]() (see Sect. 4.2).
(see Sect. 4.2).
In the following, we report the result of the comparison between flux
measurements obtained with PINTofALE and with the software ISIS. In the latter
approach, we have performed line fittings of RGS1 and RGS2 data considered
separately, using a delta-function model convolved with the actual Line Spread
Functions of the two spectrometers; as in the case of the PINTofALE (PoA)
measurements, the continuum emission was estimated from the 3-temperature fit
of the pn spectrum.
To check the reliability of the measurements on the rebinned and co-added spectrum, we have selected some of the strongest lines in the spectrum of 31 Com (the O VIII 18.97 Å line and the Fe XVII 16.77 Å and 17.05 Å lines) because their relative errors are small and, consequently, possible errors in the measurements due to the rebinning procedure might be relevant. For these lines, we have performed simultaneous fittings of RGS1 and RGS2 data. We have also fitted the lines of the O VII triplet (in the RGS2 spectrum only, the RGS1 data being missed in this region), because of their importance in density diagnostics.
Comparison of the two sets of measurements (Fig. A.3) shows agreement within the statistical uncertainties. This test demonstrates that we can consider reliable the measured fluxes of all lines whose cores are visible. As to the weaker lines, or lines highly blended with others, we can not state the same a priori. However, the agreement between observed and predicted fluxes we have found for most of the lines of the same ions, including many lines with not clearly detectable cores, as well as the self-consistence of the result, make us believe that most of the flux measurements performed in rebinned and co-added RGS spectra are rather accurate.
![\begin{figure}
\par\includegraphics[angle=-90,width=7cm,clip]{0045fb1.ps}
\end{figure}](/articles/aa/full/2004/02/aa0045/img141.gif)
![\begin{figure}
\par\includegraphics[width=7cm,clip]{0045fb2a.ps}\par\vspace*{2mm}
\includegraphics[width=7cm,clip]{0045fb2b.ps}
\end{figure}](/articles/aa/full/2004/02/aa0045/img143.gif)
![\begin{figure}
\par\includegraphics[width=8cm,clip]{0045fa1.ps}
\end{figure}](/articles/aa/full/2004/02/aa0045/img383.gif)
![\begin{figure}
\par\includegraphics[width=7.5cm,clip]{0045fa2a.ps}\par\vspace*{2mm}
\includegraphics[width=7.5cm,clip]{0045fa2b.ps}
\end{figure}](/articles/aa/full/2004/02/aa0045/img389.gif)
![\begin{figure}
\par\includegraphics[width=7cm,clip]{0045fa3.ps}
\end{figure}](/articles/aa/full/2004/02/aa0045/img390.gif)