A&A 404, 267-282 (2003)
DOI: 10.1051/0004-6361:20030444
On the gas temperature in the shocked circumstellar envelopes of
pulsating stars
III. Dynamical models for AGB star winds including time-dependent
dust formation and non-LTE cooling
V. Schirrmacher - P. Woitke - E. Sedlmayr
Zentrum für Astronomie und Astrophysik, Technische
Universität Berlin, Hardenbergstraße 36, 10623 Berlin, Germany
Received 30 October 2002 / Accepted 18 March 2003
Abstract
In this paper, we examine the mass loss mechanism of C-rich AGB
stars by means of spherically symmetric model calculations, which
combine hydrodynamics, grey radiative transfer (with constant gas and
variable dust opacity) and time-dependent
dust formation (based on equilibrium chemistry and modified
classical nucleation theory) with a time-independent non-LTE
description of the state functions of the gas, in particular
concerning the radiative heating and cooling function.
According to our models, the dissipative heating by shock waves
created by the stellar pulsation does not lead to a
long-lasting increase of the gas temperatures close to the star,
because the radiative cooling is too effective. The gas
results to be mostly in radiative equilibrium (RE), except for some
narrow but hot post-shock cooling zones. Consequently, the
dust formation and wind acceleration proceeds in a similar way as
described by Fleischer et al. (1992) and we find a dust-driven wind
triggered by the stellar pulsation, but no evidence for a
purely pulsation-driven mass loss. Several new effects occur in
the models which are causally connected with the non-LTE state
functions. In particular, the dissociation/re-formation of H2 consumes/liberates so much energy that the radiative relaxation
towards RE can be significantly delayed in regions where
the phase transition
 takes
place. These regions may stay in non-RE for a considerable
fraction of the stellar pulsation period. The radiative cooling
behind the strongest, dissociative shock waves (
takes
place. These regions may stay in non-RE for a considerable
fraction of the stellar pulsation period. The radiative cooling
behind the strongest, dissociative shock waves (
 )
usually proceeds in a two-step process where the initially rapid
cooling by permitted atomic lines down to
)
usually proceeds in a two-step process where the initially rapid
cooling by permitted atomic lines down to  6000 K is
followed by a second phase of intense radiative cooling below
3000 K, as soon as the first molecules (e.g. CO) have
formed. In the meantime, the gas cools slowly by forbidden metal
emission lines, or by adiabatic expansion. This re-increase of the
radiative cooling function with decreasing gas temperature causes a
radiative instability which may temporarily lead to a coexistence of
cool molecule-rich and warm molecule-poor regions in the radiative
relaxation zone.
6000 K is
followed by a second phase of intense radiative cooling below
3000 K, as soon as the first molecules (e.g. CO) have
formed. In the meantime, the gas cools slowly by forbidden metal
emission lines, or by adiabatic expansion. This re-increase of the
radiative cooling function with decreasing gas temperature causes a
radiative instability which may temporarily lead to a coexistence of
cool molecule-rich and warm molecule-poor regions in the radiative
relaxation zone.
Key words: equation of state - instabilities -
shock waves - stars: AGB and post-AGB - mass loss - winds,
outflows
Intermediate and low-mass stars (with main sequence mass
 )
cease their life on the asymptotic giant
branch (AGB), where they lose a substantial fraction of their initial mass by
stellar winds (Habing 1996; Wallerstein & Knapp 1998). The mass loss of AGB stars finally occurs on
time-scales shorter than typical nuclear burning time-scales, which drives
them towards the planetary-nebula phase (Wachter et al. 2002).
The stellar outflows of AGB stars are furthermore important for the enrichment
of the interstellar medium with dust and heavy elements. A detailed
understanding of the dynamical processes responsible for the formation of AGB
star winds is therefore essential not only for the modelling of late stages of
stellar evolution, but also as a key ingredient for the chemical evolution of
galaxies.
)
cease their life on the asymptotic giant
branch (AGB), where they lose a substantial fraction of their initial mass by
stellar winds (Habing 1996; Wallerstein & Knapp 1998). The mass loss of AGB stars finally occurs on
time-scales shorter than typical nuclear burning time-scales, which drives
them towards the planetary-nebula phase (Wachter et al. 2002).
The stellar outflows of AGB stars are furthermore important for the enrichment
of the interstellar medium with dust and heavy elements. A detailed
understanding of the dynamical processes responsible for the formation of AGB
star winds is therefore essential not only for the modelling of late stages of
stellar evolution, but also as a key ingredient for the chemical evolution of
galaxies.
The mass loss mechanism of AGB stars is still a matter of debate
(see e.g. Woitke 2002). Radiation pressure on dust
grains provides a satisfactory explanation for very cool and luminous AGB stars (e.g. Gail & Sedlmayr 1987a). However, for
average AGB stellar parameters, dust-driven winds already require the
assistance of another mechanism which supplies the dust formation zone
with enough stellar matter, most likely the stellar pulsation
(Fleischer et al. 1992, 1995; Höfner et al. 1995; Winters et al. 2000). For higher effective temperatures
(
 K), the dust-driving becomes finally
ineffective because the dust formation zone is located too far away
from the stellar surface. Furthermore, concerning metal-poor AGB stars
like in the LMC, the maximum radiation pressure on dust grains
attainable by condensing out all available heavy elements, may
not be sufficient to drive a stellar wind (Helling et al. 2002). Thus, the
concept of dust-driven winds is probably not applicable on the
complete AGB. Other mechanisms are important to understand the mass
loss of these stars, e.g. radiation pressure on molecules
(Maciel 1977; Helling et al. 2000), the momentum input by small-scale
magneto-hydrodynamic or acoustic waves (Pijpers & Hearn 1989; Pijpers & Habing 1989), or a
combination of pulsation and inefficient radiative cooling of the gas,
usually called "pulsation-driven mass loss''.
K), the dust-driving becomes finally
ineffective because the dust formation zone is located too far away
from the stellar surface. Furthermore, concerning metal-poor AGB stars
like in the LMC, the maximum radiation pressure on dust grains
attainable by condensing out all available heavy elements, may
not be sufficient to drive a stellar wind (Helling et al. 2002). Thus, the
concept of dust-driven winds is probably not applicable on the
complete AGB. Other mechanisms are important to understand the mass
loss of these stars, e.g. radiation pressure on molecules
(Maciel 1977; Helling et al. 2000), the momentum input by small-scale
magneto-hydrodynamic or acoustic waves (Pijpers & Hearn 1989; Pijpers & Habing 1989), or a
combination of pulsation and inefficient radiative cooling of the gas,
usually called "pulsation-driven mass loss''.
The latter mechanism has been studied by Wood (1979) and
Bowen (1988), who showed that shock waves created by the stellar
pulsation will successively heat up the gas around the star if the
radiative cooling in the outer atmosphere is ineffective.
In this case, a hot and slow pressure-driven wind develops, whose
mass loss rate depends critically on the assumptions made about
the radiative cooling rates (Willson & Bowen 1998).
Thus, the radiative heating/cooling of the gas is a key quantity to
identify the wind driving mechanism of AGB stars. Moreover, since
chemistry, nucleation and dust formation depend critically on the
temperature structure in the circumstellar environment, the radiative
heating/cooling rate as leading source term in the energy equation can
also have an important indirect influence on dust-driven winds.
In Woitke et al. (1996a, henceforth Paper I) detailed
non-LTE calculations of radiative heating and cooling rates have been
presented. These rates have been applied to the problem of
shock-induced dust formation around R Coronae Borealis stars in
(Woitke et al. 1996b, henceforth Paper II). In this work,
we have implemented an updated and enlarged version of these
heating/cooling rates in dynamical model calculations for C-star winds
developed by A. Fleischer, J. M. Winters and A. Gauger (the
C HILD-Code). These models contain a time-dependent description
of the dust formation process according to Gail & Sedlmayr (1988). Thereby, we
extend the investigations on circumstellar dust shells around
long-period variables carried out in a series of 9 papers starting
with Fleischer et al. (1992). We hope that this extension provides some new
input for the scientific discussion about the mass loss mechanism of AGB stars.
In Sect. 2, we summarise the system of partial differential
equations describing the hydrodynamics, thermodynamics, radiative transfer and
dust formation. Section 3 contains a
description of
the non-LTE state and cooling functions used in this paper.
An overview
over the numerical method is given in Sect. 4. The results are
presented in Sect. 5 and our conclusions are drawn in
Sect. 6.
2 Physical description
The hydrodynamical model calculations carried out in this paper are
based on the C HILD-Code (see introduction). Since the code has
been subject to various modifications over the past ten years, we give
a brief overview about the current version of the code as used
in this paper.
A model is determined by six parameters:  ,
,
 ,
,
 ,
C/O, P and
,
C/O, P and  denoting
the (initial) stellar luminosity, (initial) effective temperature,
stellar mass, carbon-to-oxygen ratio, pulsation period and pulsational
velocity amplitude. The circumstellar envelope is assumed to be
spherically symmetric, thereby reducing the model to one spatial
dimension. A co-moving Lagrangian frame is chosen as coordinate
system. The pulsation of the star is simulated by the piston
approximation (see Sect. 2.2.1). The circumstellar
gas-dust-mixture is regarded as a one-component compressible fluid,
i.e. complete position and momentum coupling between gas and dust via
frictional forces is assumed. Shock waves are broadened by using the
tensor-viscosity of Tscharnuter & Winkler (1979). The radiative transfer is treated
by the time-independent moment method, closed by a two-stream
approximation according to (Unno & Kondo 1976) in the improved version of
Hashimoto (1995) for spherical symmetry, grey opacities, local
thermodynamical equilibrium (LTE) and radiative equilibrium
(for details see Winters et al. 1997). Nucleation, growth and evaporation of dust
particles are treated time-dependently, using the moment method
developed by Gail & Sedlmayr (1988) and Gauger et al. (1990) for amorphous carbon
dust.
denoting
the (initial) stellar luminosity, (initial) effective temperature,
stellar mass, carbon-to-oxygen ratio, pulsation period and pulsational
velocity amplitude. The circumstellar envelope is assumed to be
spherically symmetric, thereby reducing the model to one spatial
dimension. A co-moving Lagrangian frame is chosen as coordinate
system. The pulsation of the star is simulated by the piston
approximation (see Sect. 2.2.1). The circumstellar
gas-dust-mixture is regarded as a one-component compressible fluid,
i.e. complete position and momentum coupling between gas and dust via
frictional forces is assumed. Shock waves are broadened by using the
tensor-viscosity of Tscharnuter & Winkler (1979). The radiative transfer is treated
by the time-independent moment method, closed by a two-stream
approximation according to (Unno & Kondo 1976) in the improved version of
Hashimoto (1995) for spherical symmetry, grey opacities, local
thermodynamical equilibrium (LTE) and radiative equilibrium
(for details see Winters et al. 1997). Nucleation, growth and evaporation of dust
particles are treated time-dependently, using the moment method
developed by Gail & Sedlmayr (1988) and Gauger et al. (1990) for amorphous carbon
dust.
2.1 Basic equations
This is the set of equations solved in the current implementation of
the code. The meaning of all physical quantities is listed
in Appendix B.
- Equation of motion:
 |
(1) |
 |
(2) |
 |
(3) |
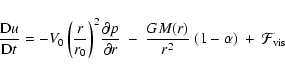
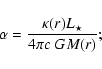
- Energy equation:
 |
|
|
(4) |
- Radiative transfer:
![$\displaystyle {T_{\rm rad}}^4 = \frac{r^2 F(r_{\rm inner})}{2\sigma}
\cdot \big...
..._r^R
\Big(\kappa(r') + \frac{2\mu_{r'}}{r'}\Big)\frac{{\rm d}r'}{{r'}^2}~\bigg]$](/articles/aa/full/2003/22/aah4073/img60.gif) |
|
|
(5) |
 |
(6) |
- Dust moment equations:
 |
(7) |
 |
(8) |
Note that in the Lagrangian formulation, the continuity equation is
automatically fulfilled according to Eq. (1).
2.2 Boundary and initial conditions
2.2.1 Hydrodynamical initial and boundary conditions
Inner boundary: The inner boundary is situated
a few scale heights below the initial stellar radius. In order to
simulate the pulsation of the star, a sinusoidal variation of the
velocity at the inner boundary is assumed (piston
approximation, Wood 1979)
 |
(9) |
Outer boundary: A constant (pressure-)
gradient condition is applied in order to determine the velocity at the
outermost grid point (see Fleischer et al. 1992, p. 324).
Initial condition: The dynamical calculations
are started from a dust-free solution of the basic Eqs. (2)-(6) in the hydrostatic case and radiative equilibrium, which is obtained on the same grid with the same
discretisation scheme (in the following referred to as the start model).
Inner boundary: The frequency-integrated
radiative flux at the inner boundary
 is assumed to
be constant, thereby fixing the stellar luminosity as function of time
according to the position of the inner boundary
is assumed to
be constant, thereby fixing the stellar luminosity as function of time
according to the position of the inner boundary
 .
The separation angle at the inner
boundary is set zero
.
The separation angle at the inner
boundary is set zero
 |
(10) |
Outer boundary: The optical depth
is forced to vanish at the outer boundary. Outer irradiation is
neglected.
[2mm]
Consistency condition:
The position of the stellar radius
 and the effective
temperature
and the effective
temperature
 are calculated from the Stefan-Boltzmann-law
and a consistency condition at
are calculated from the Stefan-Boltzmann-law
and a consistency condition at

 |
(11) |
which states two equations for the two unknowns
and
.
These quantities, however, have only informal
character and are not used elsewhere.
 is the grey
radiative equilibrium temperature structure calculated according
to Eq. (5).
is the grey
radiative equilibrium temperature structure calculated according
to Eq. (5).
2.3 Material functions
The calculation of the source terms emerging in the basic Eqs. (2) to (8) requires the knowledge of several material
functions. These material functions, which describe the couplings between
hydrodynamics, thermodynamics, radiative transfer, chemistry and dust
formation, are determined from various microphysical considerations. In the
following, we list the required material functions along with a short
description of the underlying concepts for their determination.
3 The state functions
3.1 Time-independent non-LTE description
In the following, we resume the basic concept of non-LTE state
functions (see also Mihalas 1978, p. 140) for partly molecular gases
under the influence of a continuous radiation field as developed in
Paper I and describe the updates and improvements made since Paper I.
In comparison to the standard LTE approach, where  and
and  are
sufficient to determine the complete state of the gas, including all
relevant particle densities and occupational numbers, we consider the
mean spectral intensity
are
sufficient to determine the complete state of the gas, including all
relevant particle densities and occupational numbers, we consider the
mean spectral intensity  as (a set of) additional
fundamental thermodynamical variable(s). From these variables, all
gain and loss terms in the non-LTE statistical equations can be
determined, such that the time-independent solution of these equations
can be determined. By relying on the time-independent case, we
assume that the internal relaxation by atomic and molecular processes
(e.g. dissociation, excitation and ionisation) is fast in comparison to
changes of the thermodynamical variables in the ambient medium (e.g.
due to velocity fields). The non-LTE statistical equations are
completed by the requirement of total particle and charge
conservation, describing the chemical conversions between different
kinds of particles.
as (a set of) additional
fundamental thermodynamical variable(s). From these variables, all
gain and loss terms in the non-LTE statistical equations can be
determined, such that the time-independent solution of these equations
can be determined. By relying on the time-independent case, we
assume that the internal relaxation by atomic and molecular processes
(e.g. dissociation, excitation and ionisation) is fast in comparison to
changes of the thermodynamical variables in the ambient medium (e.g.
due to velocity fields). The non-LTE statistical equations are
completed by the requirement of total particle and charge
conservation, describing the chemical conversions between different
kinds of particles.
A high-dimensional system of algebraic equations is obtained,
which is solved by iteration. The result is a vector of molecular,
atomic and ionic particle densities, including all occupational
numbers, and the electron density, from which all relevant state
functions can be computed. This approach allows for an inclusion of
various important non-LTE effects, like photo-ionisation and the
depopulation of excited states in the case of small densities and weak
radiation fields. Time-dependent non-LTE effects, however, cannot be
described by this approach.
For this work, the outlined concept for the calculation of the
state of the gas is carried out with the following additional
approximations:
- 1.
- For the sake of simplicity, we assume chemical equilibrium
between molecules and neutral atoms. Our approach could, in
principle, also be carried out by calculating the time-independent solution of a chemical rate network, but this
procedure would be very time-consuming and goes beyond our current
capabilities
![[*]](/icons/foot_motif.gif) . In contrast, the ratios between ions and
neutral atoms are properly calculated in non-LTE.
. In contrast, the ratios between ions and
neutral atoms are properly calculated in non-LTE.
- 2.
- Optical depth effects in spectral lines are treated by using an
escape probability method according to Sobolev theory
(e.g. Puls & Hummer 1988).
In doing so, we can replace the usually
unknown local mean intensities
by other quantities again
regarded as fundamental thermodynamical variables (see Eq. (12) in
Paper I), namely (i) the local continuous mean intensity
 ,
and (ii) the local mean velocity gradient
,
and (ii) the local mean velocity gradient
 .
Both are available in radiation-hydrodynamical
simulations.
.
Both are available in radiation-hydrodynamical
simulations.
- 3.
- Our hydrodynamical models only include a grey
continuum radiative transfer, where detailed knowledge about the
frequency distribution of
is not available, but
only its frequency integral
 is
known. In order to proceed further, we assume
is
known. In order to proceed further, we assume
 |
(20) |
which is strictly correct only in the optically thick limiting
case. The set of variables for
is hence simplified to a single variable, namely
 ,
and the complete set of fundamental thermodynamical
variables needed to calculate the state of the gas is reduced to ,
,
and
,
and the complete set of fundamental thermodynamical
variables needed to calculate the state of the gas is reduced to ,
,
and
 .
.
With these assumptions, all particle densities (neutral atoms,
molecules, electrons and single ions) and level populations are determined in
statistical equilibrium. The resulting state functions are calculated and
tabulated as function of our four fundamental thermodynamical variables. This
concerns the internal energy of the gas e, the gas pressure p and the net
radiative heating function
 .
These three four-dimensional tables are
used later in the hydrodynamical model calculations.
.
These three four-dimensional tables are
used later in the hydrodynamical model calculations.
An overview of the included photo-processes for the calculation of
is given in Table 1. The resulting
magnitude and importance of the various radiative processes in the
temperature-density-plane can be found in Woitke & Schirrmacher (1999).
Table 1:
Overview of included heating/cooling processes.
Concerning the non-LTE treatment of the neutral atoms and first ions,
we use the same methods and equations as presented in Paper I, but the
atomic data has been updated and considerably enlarged as described in
(Woitke & Sedlmayr 1999). The model atoms now include
several thousand permitted, forbidden and fine-structure lines, and
b-f transitions from excited levels. New species like Ca I, Ca II,
Mg I and Mg II are taken into account
(see Table 1 in Woitke & Sedlmayr 1999).
In addition to the photo-ionisation and direct
recombination rates, collisional ionisation from all neutral (ground
and excited) levels is included, affecting e.g. the determination of
the electron particle densities which is important for the collision
rates.
Concerning the treatment of the molecules, several updates and
methodological improvements have been carried out since Paper I,
which are outlined in Appendix A. Polyatomic
molecules like H2O, C2H2, HCN and CO2 are taken into
account and the non-LTE treatment has been refined in order to allow for
the inclusion of overtone transitions, combination bands, and the important
ro-vibrational pumping effect.
![\begin{figure}
\par\includegraphics[width=7.8cm,clip]{H4073F1.PS}
\end{figure}](/articles/aa/full/2003/22/aah4073/Timg105.gif) |
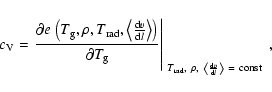
Figure 1:
Upper panel: Dependence of the thermal gas pressure p on the gas temperature
for various densities in units of
 (solid and dotted lines as indicated).
 K and K and
 are fixed
parameters. For comparison, the dashed line shows an ideal
mono-atomic gas (
are fixed
parameters. For comparison, the dashed line shows an ideal
mono-atomic gas (
 )
for )
for
 .
Lower panel: Mean
molecular weight .
Lower panel: Mean
molecular weight  in atomar mass units over gas temperature
for
.
The upper dashed line
corresponds to the value of
where all hydrogen is bound in
H
in atomar mass units over gas temperature
for
.
The upper dashed line
corresponds to the value of
where all hydrogen is bound in
H ,
the lower dashed line to atomic hydrogen. ,
the lower dashed line to atomic hydrogen. |
| Open with DEXTER |
Thermal equation of state:
Figure 1 shows the resulting dependence of
the thermal gas pressure p as calculated by
 |
|
|
(21) |
 |
|
|
|
on the gas temperature
for a collection of different gas densities .
The lower panel of Fig. 1 shows the resulting mean molecular weight
calculated by
 |
(22) |
At low temperatures
is dominated by the ratio of H2 to H atoms, at high temperatures by ionisation of abundant
metal atoms and, in particular, of hydrogen. Clearly, an ideal gas
with constant
(sometimes assumed in other models) is not
appropriate for the modelling of AGB star winds, as it would introduce
an error of a factor  2.
2.
Caloric equation of state:
The total internal energy is calculated by summing up the various
contributions from all internal pools of energy, including potential
energies due to ionisation and dissociation
 |
|
|
(23) |
 |
|
|
|
The different forms of internal energy ei are calculated according
to Eqs. (3) to (8) in Paper I. The dependence of the internal energy
on the gas temperature
is shown in Fig. 2.
Again, the assumption of an ideal mono-atomic gas yields realistic
values only in those domains where hydrogen is actually mainly atomic.
Two distinct steps are caused by the dissociation and the ionisation
of hydrogen. The slope of
 is the specific heat
capacity
is the specific heat
capacity
 of the gas, defined by
 |
(24) |
which peaks in the phase transition regions between atomic and
molecular hydrogen, and between atomic and ionised hydrogen.
![\begin{figure}
\par\includegraphics[width=7.8cm,clip]{H4073F2.PS}
\end{figure}](/articles/aa/full/2003/22/aah4073/Timg117.gif) |
Figure 2:
Internal energy e over gas temperature
(solid line)
for constant
 ,
K and
.
For comparison, the internal
energy of an ideal mono-atomic gas is shown as dashed line. ,
K and
.
For comparison, the internal
energy of an ideal mono-atomic gas is shown as dashed line. |
| Open with DEXTER |
Both equations of state reveal essentially the same behaviour as used
from LTE calculations. However, the dependencies are considerably
affected by the ionisation equilibrium (mainly triggered the balance
between photo-ionisation and direct recombination) and, thus, also
depend on the radiation field (not shown in
Figs. 1 and 2).
Net radiative heating rate:
varies by orders of magnitude, changes its sign and depends
strongly on all four parameters ,
,
and
.
Figures 3 and 4 give a rough impression of the
dependencies on
and
in the case
 ,
i.e. with
negligible continuous radiation field where,
clearly, the gas cools by radiative losses. Other illustrative
examples are shown in Woitke & Sedlmayr (1999) and in Woitke & Schirrmacher (1999).
,
i.e. with
negligible continuous radiation field where,
clearly, the gas cools by radiative losses. Other illustrative
examples are shown in Woitke & Sedlmayr (1999) and in Woitke & Schirrmacher (1999).
Figure 3 shows that
usually has a maximum around
 .
Towards lower densities, the radiative
cooling becomes less effective because of the decreasing
collisional excitation rates. Towards higher densities, the optical depths
in the spectral lines generally increase which results in a significant
trapping of the emitted line photons.
.
Towards lower densities, the radiative
cooling becomes less effective because of the decreasing
collisional excitation rates. Towards higher densities, the optical depths
in the spectral lines generally increase which results in a significant
trapping of the emitted line photons.
Figure 4 demonstrates that
does usually not follow a
simple relaxation ansatz like
 or
or
 .
On the contrary, the resulting
cooling rates generally have a local maximum around
.
On the contrary, the resulting
cooling rates generally have a local maximum around
 where molecules are present in the gas phase,
which are effective coolants because of their numerous
ro-vibrational transitions, in particular the polar and abundant
CO-molecule: The radiative cooling rate can re-increase with decreasing gas
temperature.
where molecules are present in the gas phase,
which are effective coolants because of their numerous
ro-vibrational transitions, in particular the polar and abundant
CO-molecule: The radiative cooling rate can re-increase with decreasing gas
temperature.
4 The numerical method
A detailed description of the CHILD-Code can be found
in Fleischer et al. (1992) and Winters et al. (1997). We therefore give only a short
summary here.
![\begin{figure}
\par\includegraphics[width=7.8cm,clip]{H4073F3.PS}
\end{figure}](/articles/aa/full/2003/22/aah4073/Timg126.gif) |
Figure 3:
Radiative cooling rate
 over gas density
for
over gas density
for
 , ,
 K and K and
 . . |
| Open with DEXTER |
![\begin{figure}
\par\includegraphics[width=8.2cm,clip]{H4073F4.PS}
\end{figure}](/articles/aa/full/2003/22/aah4073/Timg128.gif) |
Figure 4:
Radiative cooling rate
over gas temperature
for
,
and different
gas densities ( as indicated). Note that this case is
only one example. An increase of the continuous radiation field
will, for example, result in more photoionisation and hence to an
increase of the electron concentration which usually intensifies
the radiative cooling.
as indicated). Note that this case is
only one example. An increase of the continuous radiation field
will, for example, result in more photoionisation and hence to an
increase of the electron concentration which usually intensifies
the radiative cooling. |
| Open with DEXTER |
The equation system described in Sect. 2.1 is
discretised on a staggered mesh according to the scheme of
Richtmyer & Morton (1967), and solved by explicit forward integration in time.
The length of the time-steps is adapted dynamically, in order to
handle the rapid evolution of the dust component in phases when
new dust shells condense.
The fraction of the maximum allowed CFL-time step is set to
 .
A stellar period is typically calculated in 105
time steps. A rezoning mechanism is implemented
(see Fleischer et al. 1992), which discards zones that cross an arbitrary
outer limit and insert new grid points by splitting
zones in regions where
the gradients are steep.
.
A stellar period is typically calculated in 105
time steps. A rezoning mechanism is implemented
(see Fleischer et al. 1992), which discards zones that cross an arbitrary
outer limit and insert new grid points by splitting
zones in regions where
the gradients are steep.
The dynamical calculations are started by switching on the motion of the
piston at the inner boundary. The velocity amplitude is carefully incremented
until the desired value is reached, in order to reduce the effects caused by
the very first shock waves which steepen up dramatically in the initially
hydrostatic atmosphere. The number of grid points, initially 512, is gradually
increased to 1925 by inserting more and more points via the rezoning
procedure. For the models presented in this paper, we have fixed the outer
boundary at 25 R0, thus assuring a satisfactory resolution behind the shock
waves. The results are taken after the pulsation amplitude and the number of
grid points have reached their final value, and after several further shock
waves, generated close to the star, have reached the outer boundary.
The new state functions are interpolated from 4-dimensional
tables for
 ,
,
 and e.
The variables are ,
,
and
on a
and e.
The variables are ,
,
and
on a
 -grid.
,
and
run on a logarithmic spacing
(
-grid.
,
and
run on a logarithmic spacing
(
 ,
,
 and
and
 ), while
for
we
chose a spacing that ensures a high density of points around
), while
for
we
chose a spacing that ensures a high density of points around
 (
(
 K).
K).
The main loop of the forward integration consists of the following steps:
- 1.
- Determination of the time step
 .
For details of
the adapted criteria see Fleischer (1994).
.
For details of
the adapted criteria see Fleischer (1994).
- 2.
- Calculation of the new hydrodynamic structure
 ,
,
 ,
,
 and
and
 according to Eqs. (1), (2), mass conservation
and Eq. (17) of Paper I.
according to Eqs. (1), (2), mass conservation
and Eq. (17) of Paper I.
- 3.
- Determination of the new gas temperatures
 by means of the semi-implicitly discretised energy Eq. (4). In the internal iteration required to find the root
of this equation, the quantities
by means of the semi-implicitly discretised energy Eq. (4). In the internal iteration required to find the root
of this equation, the quantities
 ,
,
 and
and
 are interpolated from the 4-dimensional
tables as functions of
,
,
and
are interpolated from the 4-dimensional
tables as functions of
,
,
and
 .
.
- 4.
- Determination of the new grey radiative equilibrium
temperature structure
 by means of the
solution of Eqs. (5) and (6), where the
dust opacities are iteratively determined according to
(Winters et al. 1997).
by means of the
solution of Eqs. (5) and (6), where the
dust opacities are iteratively determined according to
(Winters et al. 1997).
- 5.
- Calculation of the dust complex. The new chemical
concentrations of the dust forming species are calculated
according to
and
and the
dust moment Eqs. (7) and (8) are
explicitly integrated forward.
- 6.
- Validation of the time step. The artificial viscosities
and radiative acceleration
 for the next time step are
evaluated, taking into account the new opacities which depend on the
new dust moments and the new temperatures. The time step is discarded
if the resulting change of any quantity is too large.
for the next time step are
evaluated, taking into account the new opacities which depend on the
new dust moments and the new temperatures. The time step is discarded
if the resulting change of any quantity is too large.
5 Results and discussion
Before we present the results of our dynamical models which include a
non-LTE treatment of the state functions as described in
Sect. 3, we start with a short discussion of the
start models. These hydrostatic structures already reveal some
remarkable deviations from the former calculations, where isothermal
or LTE radiative cooling was assumed and the state functions of a
perfect mono-atomic gas were considered
(henceforth called the classical models, see e.g. Fleischer et al. 1992; Winters et al. 2000).
Figure 5 depicts the calculated hydrostatic density
stratification in comparison with two start models calculated with a
constant mean molecular weight, corresponding to a H/He mixture
("mono-atomic'') and a H2/He mixture ("di-atomic''),
respectively. The plot demonstrates that the new density structure
lies between these two limiting cases and differs from
the classical start model (which considers a perfect mono-atomic gas) by
about two orders of magnitude in the outer regions.
The reason for the lower densities in the outer regions of the new models is
the changing H/H2 ratio as indicated by the lower plot of
Fig. 5. As the temperature decreases outward in the inner
atmospheric layers, molecular hydrogen starts to form. However, although the
temperature still decreases slowly in the outer regions, the pressure gradient
in the hydrostatic case is so steep, that the dissociative equilibrium of
H2 finally favours atomic hydrogen again. In the region around the stellar
radius, where
has a pronounced maximum, the logarithmic density gradient
is about a factor 2 steeper since
 |
(25) |
Consequently, the density starts to fall behind the classical
mono-atomic model outside of about  .
.
Thus, the new models already show distinct deviations from the
classical models in the hydrostatic case. A detailed comparison of
single pairs of classical and new models for the same parameters, e.g.
at a certain instant of time, is hence a lot less meaningful than
suggested by intuition. Therefore, after reviewing the results of the
new model calculations in general (Sect. 5.2), we will
mainly focus on the new physical effects introduced by the refined
state and cooling functions.
![\begin{figure}
\par\includegraphics[width=8cm,clip]{H4073F5.PS}\vspace*{3mm}
\par\includegraphics[width=7.8cm,clip]{H4073F6.PS}
\end{figure}](/articles/aa/full/2003/22/aah4073/Timg161.gif) |
Figure 5:
Start models for parameters
 , ,
 and
and
 K
(derived quantities K
(derived quantities
 cm, cm,
 )
compared with two start models calculated with
constant )
compared with two start models calculated with
constant
 amu (H/He mixture, dashed) and amu (H/He mixture, dashed) and
 amu
(H2/He mixture, dashed-dotted). amu
(H2/He mixture, dashed-dotted). |
| Open with DEXTER |
5.2 Dynamical models - An overview
The results of the new dynamical model calculations generally reveal a
dust-driven wind triggered by the pulsation of the star, similar to
the classical models. Sound waves initiated by the sinusoidal
variation of the inner boundary quickly steepen up to strong shock
waves in the large density gradient of the photosphere. For the
relatively compact AGB star with Mira-like parameters considered in Fig. 6, shock
waves with velocities up to 35 km s-1 develop slightly above the
time-dependent position of the stellar radius
(see
Eq. (11)). While propagating outwards through the dust-free regions
close to the star, the shock waves are damped and strongly levitate
the outer atmosphere. When a shock wave reaches the dust formation
zone around 2...3 R0, this zone is compressed which temporarily
creates favourable conditions for dust formation. Radiation pressure
on the newly formed dust grains then pushes the gas-dust-mixture
outwards, thus providing the basic wind driving mechanism in these
models. The dynamic coupling between pulsation and time-dependent dust
formation usually leads to the production of radial dust shells in
sometimes periodic, but often multi-periodic or chaotic time intervals
(see lower box of Fig. 6). The dust-forming shock
waves are re-accelerated which causes density inversions to develop in
the post-shock regions.
![\begin{figure}
\par\includegraphics[width=8.4cm,clip]{H4073F7.PS}
\end{figure}](/articles/aa/full/2003/22/aah4073/Timg171.gif) |
Figure 6:
A typical radial snapshot of a model with parameters
 , ,
 , ,
 K, K,
 , ,
 km s-1 and km s-1 and
 d (derived quantities d (derived quantities
 cm
and cm
and
 ). Upper box: velocity u (full line) and total
hydrogen particle density ). Upper box: velocity u (full line) and total
hydrogen particle density
 (dashed).
Second box: gas temperature
(full) and grey radiative
equilibrium temperature
(dashed). Middle double box:
radiative (full black), adiabatic (full grey) and viscous (dotted) heating
rates (upper part) and cooling rates (lower part) in
(dashed).
Second box: gas temperature
(full) and grey radiative
equilibrium temperature
(dashed). Middle double box:
radiative (full black), adiabatic (full grey) and viscous (dotted) heating
rates (upper part) and cooling rates (lower part) in
![$[\rm erg/g/s]$](/articles/aa/full/2003/22/aah4073/img34.gif) .
Fifth box: mean molecular weight .
Lower box: degree of
condensation of carbon .
Fifth box: mean molecular weight .
Lower box: degree of
condensation of carbon
 (full) and ratio of
radiative acceleration to gravitational deceleration
(full) and ratio of
radiative acceleration to gravitational deceleration  (dashed).
 |
| Open with DEXTER |
In contrast to the classical models, several new features appear in the
model calculations which are further discussed in the Sects. 5.3 to 5.5. The most striking difference is the occurrence of high
temperature peaks around the positions of the strongest shock
waves. If the pre-shock gas is H2-rich, only shock waves
20 km s-1 are energetically capable to completely dissociate the
H2 molecules. The surplus energy dissipated by the shock is then
converted into thermal kinetic energy, leading easily to post-shock
temperatures of about 8000 K to 11 000 K. Shock waves below this
threshold ( non-dissociative shocks) usually produce much smaller post-shock
temperatures.
The double box in the centre of Fig. 6 gives an overview of
the energetic processes of the gas affected by viscous heating
 (representing the energy dissipation by shock waves),
radiative heating/cooling
and
hydrodynamical work
(representing the energy dissipation by shock waves),
radiative heating/cooling
and
hydrodynamical work
 .
After the passage of a shock wave with respective
dissipative shock heating, the gas cools down quickly and relaxes towards
radiative equilibrium (RE), eventually assisted by adiabatic cooling. This
usually happens in a thin zone behind the shock fronts, extending between a
few 1/1000
.
After the passage of a shock wave with respective
dissipative shock heating, the gas cools down quickly and relaxes towards
radiative equilibrium (RE), eventually assisted by adiabatic cooling. This
usually happens in a thin zone behind the shock fronts, extending between a
few 1/1000  (unresolved in this case) to about
1/10 ,
depending on the pre-shock gas density. However, the details of the
temperature structure in the post-shock relaxation zone are biased due to the
usage of artificial viscosity. A more exact description of these structures
and the relevant radiative cooling processes can be found in
Woitke (2002). The gas in most parts of the outer atmosphere
is hence characterised by an energetic equilibrium where the adiabatic cooling
in the expanding wind and the re-expanding flow behind the compressing shock
waves is balanced by the radiative heating due to absorption of radiation, in
particular in ro-vibrational bands of polar molecules like CO, henceforth
called quasi-RE.
(unresolved in this case) to about
1/10 ,
depending on the pre-shock gas density. However, the details of the
temperature structure in the post-shock relaxation zone are biased due to the
usage of artificial viscosity. A more exact description of these structures
and the relevant radiative cooling processes can be found in
Woitke (2002). The gas in most parts of the outer atmosphere
is hence characterised by an energetic equilibrium where the adiabatic cooling
in the expanding wind and the re-expanding flow behind the compressing shock
waves is balanced by the radiative heating due to absorption of radiation, in
particular in ro-vibrational bands of polar molecules like CO, henceforth
called quasi-RE.
There are, however, also exceptions from this rule. (i) The
dissociation/re-formation of H2 consumes/liberates so much energy
(see Fig. 2) that the radiative relaxation is slowed down
considerably, leading to
parts in the model where the gas is out of RE and the mean molecular weight
changes slowly in time. We call this effect the H2 energy buffer and
discuss it further in Sect. 5.3.
(ii) Inside of a newly forming (optically thick) dust shell, the radiative
equilibrium temperature
can increase
so quickly due to backwarming that the gas temperature cannot follow,
thus causing this region to be temporarily out of RE. (iii) The
gas density can be so small in the outermost regions (e.g.
 at
at
 )
that the radiative
heating/cooling rates become negligible and the gas behaves almost
adiabatically, usually resulting in lower temperatures in the expanding
wind.
)
that the radiative
heating/cooling rates become negligible and the gas behaves almost
adiabatically, usually resulting in lower temperatures in the expanding
wind.
A general increase of the mean molecular weight from 1.3 to
2.4 can be observed in relaxed models, typically between
the stellar radius and a distance of  .
This means
that the gas in the outer atmosphere is often close to the
dissociation equilibrium of H2 due to energetic constraints, i.e. H2 molecules are again and again destroyed by the propagating
shocks and do only slowly form again. This behaviour is related
to the dust formation which occurs at similar temperatures.
It also suppresses the appearance of very low temperatures close to
the star in consequence of a two-step cooling process (radiative +adiabatic) as it has been reported to occur in models for R Coronae
Borealis stars (Paper II), which consist of a
hydrogen-poor gas (mainly He and C).
.
This means
that the gas in the outer atmosphere is often close to the
dissociation equilibrium of H2 due to energetic constraints, i.e. H2 molecules are again and again destroyed by the propagating
shocks and do only slowly form again. This behaviour is related
to the dust formation which occurs at similar temperatures.
It also suppresses the appearance of very low temperatures close to
the star in consequence of a two-step cooling process (radiative +adiabatic) as it has been reported to occur in models for R Coronae
Borealis stars (Paper II), which consist of a
hydrogen-poor gas (mainly He and C).
![\begin{figure}
\par\includegraphics[width=5.8cm,clip]{H4073F8.PS}\hspace*{2mm}
\...
....PS}\hspace*{2mm}
\includegraphics[width=5.8cm,clip]{H4073F10.PS}
\end{figure}](/articles/aa/full/2003/22/aah4073/Timg185.gif) |
Figure 7:
Enlarged hydrodynamic structures of a dust-forming,
non-dissociative shock wave propagating outwards. Parameters:
,
 ,
K,
,
km s-1 and ,
K,
,
km s-1 and
 d (derived quantities d (derived quantities
 cm and cm and
 ). The plotted quantities are explained in the caption
of Fig. 6. For clarity, the adiabatic work is not
depicted here. ). The plotted quantities are explained in the caption
of Fig. 6. For clarity, the adiabatic work is not
depicted here. |
| Open with DEXTER |
The depicted model is an example for a stellar wind with a relatively
small mass loss rate (
 ).
Even for such a thin circumstellar environment, the model does not
show a long-lasting increase of the gas temperatures close to the star
as consequence of the energy input by the stellar pulsation (the
formation of a "calorisphere'' as termed by Willson 2000).
The radiative cooling rates are just to strong to allow for this
effect. Consequently, we did not find any evidence for a purely
pulsation-driven outflow in our model calculations - the models
always reveal a mainly dust-driven wind, just as in the classical
models.
).
Even for such a thin circumstellar environment, the model does not
show a long-lasting increase of the gas temperatures close to the star
as consequence of the energy input by the stellar pulsation (the
formation of a "calorisphere'' as termed by Willson 2000).
The radiative cooling rates are just to strong to allow for this
effect. Consequently, we did not find any evidence for a purely
pulsation-driven outflow in our model calculations - the models
always reveal a mainly dust-driven wind, just as in the classical
models.
5.3 The H2-energy buffer
Figure 7 shows
three snapshots of a slow, non-dissociative shock
wave propagating through the dust formation zone which is previously
H2-rich. The radiative heating/cooling rates at post-shock densities
 are so efficient that the
radiative cooling zone of this shock is unresolved (see Sect. 5.2) in the model, leading to an
apparently smooth temperature structure around the shock front in the first
two depicted time steps.
Hence, in the dust formation region, the
gas approximately behaves like in the
isothermal limiting case, which probably explains
why the general results of the new models are so similar to the classical
ones. The compression by this
are so efficient that the
radiative cooling zone of this shock is unresolved (see Sect. 5.2) in the model, leading to an
apparently smooth temperature structure around the shock front in the first
two depicted time steps.
Hence, in the dust formation region, the
gas approximately behaves like in the
isothermal limiting case, which probably explains
why the general results of the new models are so similar to the classical
ones. The compression by this
 shock wave initiates dust
formation at about 1.7 R0 in the model, leading to a narrow peak in the
degree of condensation (first depicted time step, lower box) and a
remarkable step in the temperature structure by backwarming (second time-step,
second box). Thereby, the shock wave does not only initiate dust formation,
but also destroys most of the H2 simultaneously.
shock wave initiates dust
formation at about 1.7 R0 in the model, leading to a narrow peak in the
degree of condensation (first depicted time step, lower box) and a
remarkable step in the temperature structure by backwarming (second time-step,
second box). Thereby, the shock wave does not only initiate dust formation,
but also destroys most of the H2 simultaneously.
![\begin{figure}
\par\includegraphics[width=5.6cm,clip]{H4073F11.PS}\hspace*{2mm}
...
....PS}\hspace*{2mm}
\includegraphics[width=5.6cm,clip]{H4073F13.PS}
\end{figure}](/articles/aa/full/2003/22/aah4073/Timg192.gif) |
Figure 8:
A dissociative shock wave propagating through the circumstellar
gas. Parameters:
,
 ,
K,
,
km s-1 and
d (derived
quantities ,
K,
,
km s-1 and
d (derived
quantities
 cm and cm and
 ). The plotted quantities are explained in the
caption of Fig. 6, however, the velocity is
depicted as dashed line and the density as full line here. ). The plotted quantities are explained in the
caption of Fig. 6, however, the velocity is
depicted as dashed line and the density as full line here. |
| Open with DEXTER |
According to our dynamical model calculations, the potential energies
stored in the bindings of H2-molecules play an important role for the
thermal behaviour of the gas in the circumstellar environment of AGB stars.
The dissociation/formation of H2 consumes/liberates so much energy that the
gas temperature remains nearly constant during the phase transition between H
and H2 (while the gas is constantly heated/cooled). This slow temperature
increase/descrease can be interpreted in terms of an enlargement of the heat
capacity of the transition state (see Fig. 2 and
Eq. (24)), since the time-scale for radiative relaxation is
proportional to the heat capacity as
 |
(26) |
The last depicted time step in Fig. 7 shows the energy
buffering effect in both directions. On the one hand, it limits the
temperature increase by dissipative heating in the shock front. On the
other hand, it delays the post-shock cooling of the
gas. By comparing the difference between
and
with the mean molecular weight
in
Fig. 7, it becomes obvious that the state of quasi-RE
(
 )
can often be reached only in those regions
where hydrogen is predominantly atomic or predominantly molecular. The
delaying influence of the H-buffer can result in H2-forming
regions staying out of RE for a substantial fraction of the
pulsational period (see last depicted time step in
Fig. 7 and central region around 8 R0 in
Fig. 6).
)
can often be reached only in those regions
where hydrogen is predominantly atomic or predominantly molecular. The
delaying influence of the H-buffer can result in H2-forming
regions staying out of RE for a substantial fraction of the
pulsational period (see last depicted time step in
Fig. 7 and central region around 8 R0 in
Fig. 6).
Figure 8 shows three consecutive snapshots of a
dissociative shock wave propagating into a H2-rich gas. The
parameters of this model describe a more compact AGB star than in
Fig. 7, which results in stronger shock waves in the
circumstellar environment. The velocity of the considered shock wave
is just above the dissociative threshold, resulting in post-shock
temperatures between 5000 K and 7000 K.
We have divided each plot in Fig. 8 into five zones (by the
vertical grey solid lines) to facilitate the identification
of the different radiative and chemical processes.
- Zone 1 is the cool, H2-rich pre-shock gas in
quasi-RE, which is not yet affected by the
approaching shock wave and irrelevant for our
discussion here.
- Zone 2 is the shock front, where the kinetic energy of the
flow is mainly converted into internal energy of the gas by
dissipative processes. This zone is numerically broadened by
the usage of artificial viscosity, which gives approximately the right
amount of dissipated energy, but the energy input is unphysically
smeared out over this zone. Therefore, we refrain from any discussion
of this zone.
- Zones 3 and 4 are the actively cooling post-shock regions
with vanishing influence of the artificial viscosity
 .
.
- Zone 4 is featured by a re-increase of the radiative cooling
rate
.
- In zone 5, the gas is back in quasi-RE.
All molecules in zone 3 are dissociated, but the gas temperature is
with 3000 K to 6000 K not high enough to collisionally excite
permitted cooling lines like Ly,
H,
Ca II H+K or
Mg II h+k. However, some low-lying energy levels of certain
forbidden and fine-structure lines, in particular of Fe I and Fe II,
can still be excited (Woitke & Sedlmayr 1999).
Consequently, the mainly neutral atomic gas cools slowly by radiative
losses of the order of
 (at
densities
(at
densities
 ).
).
This moderate radiative cooling is sufficient to reach temperatures
 3000 K appropriate for molecule formation within a distance of
about 0.1 R0 to 0.2 R0 behind the shock front. Once the first
molecules are present (zone 4), the large amount of permitted
ro-vibrational lines of polar molecules, in particular CO, causes a
substantial re-increase of the radiative cooling rate (by about one
order of magnitude in the depicted case, despite the fact that the
difference between
and
is here at least 2000 K smaller
than in zone 3). From the mean molecular weight plotted in the lower
panel in Fig. 8, we see that zone 4 is also the site where
the re-formation of H2 takes place. In fact, the re-increase of the
cooling rate (by CO-formation) occurs slightly before the
re-formation of H
begins. The radiative cooling in zone 4 is at
first prolonged by the H2-energy-buffer. Once the re-formation of
H
is complete, however, an almost instantaneous relaxation towards
quasi-RE results and zone 5 is reached.
3000 K appropriate for molecule formation within a distance of
about 0.1 R0 to 0.2 R0 behind the shock front. Once the first
molecules are present (zone 4), the large amount of permitted
ro-vibrational lines of polar molecules, in particular CO, causes a
substantial re-increase of the radiative cooling rate (by about one
order of magnitude in the depicted case, despite the fact that the
difference between
and
is here at least 2000 K smaller
than in zone 3). From the mean molecular weight plotted in the lower
panel in Fig. 8, we see that zone 4 is also the site where
the re-formation of H2 takes place. In fact, the re-increase of the
cooling rate (by CO-formation) occurs slightly before the
re-formation of H
begins. The radiative cooling in zone 4 is at
first prolonged by the H2-energy-buffer. Once the re-formation of
H
is complete, however, an almost instantaneous relaxation towards
quasi-RE results and zone 5 is reached.
Since the gas pressure in the (sub-sonic) downstream gas (zones 3-5) remains approximately constant, the phases of efficient
radiative cooling are accompanied by a compression of the gas.
Accordingly, the upper panels of Fig. 8 show that the
initial shock-compression is followed by another phase of post-shock
compression in zone 4.
The second and third depicted time step in Fig. 8 show a
strongly wriggled region concerning the spatial structure of ,
,
and
at the right edge of zone 3, which develops
from the "smooth'' structure on the l.h.s. as time passes.
After checking the numerics, we conclude that this feature
is actually caused by a physical effect which we identify as a radiative instability of the post-shock cooling gas.
The main effect is the re-increase of the cooling rate with decreasing
gas temperature as described in
Sect. 3.2. This causes the cooling
trajectories in the post-shock region to be unstable. If parts of a
cooling volume have already reached slightly lower temperatures, the
further cooling of these parts is faster and the temperature
difference to the other, still warmer parts in the volume increases
exponentially.
The main effect is schematically depicted on the r.h.s. of
Fig. 9. An increase of the radiative cooling rate
leads to a temperature decrease
( )
which
causes an increase of the molecular concentrations
)
which
causes an increase of the molecular concentrations
 ()
which accelerates the cooling (
()
which accelerates the cooling ( ). This leads to an
overall positive feedback in the r.h.s. control loop
(
). This leads to an
overall positive feedback in the r.h.s. control loop
(
 )
which means that small
perturbations in the system are self-amplifying and can grow to large
temperature differences, which characterises this instability.
Another control loop is depicted on the l.h.s. of
Fig. 9. The post-shock cooling gas is approximately in
pressure balance, because the downstream flow is subsonic (close inspection of
Fig. 9 in fact shows that the temperature and density
wriggles are anti-correlated wheras the pressure structure is
smooth). Therefore, a decrease of the temperature
causes an
increase of the density
()
which increases the
collision rates what usually (compare Fig. 3) has a
positive effect on the cooling rate
()
which
decreases the temperature ()
- another unstable mechanism
which coworks with the former control loop.
)
which means that small
perturbations in the system are self-amplifying and can grow to large
temperature differences, which characterises this instability.
Another control loop is depicted on the l.h.s. of
Fig. 9. The post-shock cooling gas is approximately in
pressure balance, because the downstream flow is subsonic (close inspection of
Fig. 9 in fact shows that the temperature and density
wriggles are anti-correlated wheras the pressure structure is
smooth). Therefore, a decrease of the temperature
causes an
increase of the density
()
which increases the
collision rates what usually (compare Fig. 3) has a
positive effect on the cooling rate
()
which
decreases the temperature ()
- another unstable mechanism
which coworks with the former control loop.
The impact of this instability on our calculations can be seen in
Fig. 8. The
initially small pertubations of the gas temperature
(probably of
numerical nature, see l.h.s. of Fig. 8) are amplified and
result in a very inhomogeneous hydrodynamic structure, where cool,
fast cooling and dense domains alternate with comparatively hot, slow
cooling and thin domains. Density inhomogeneities of
about one order of magnitude are generated which, however, finally
disappear when all cooling domains have reached quasi-RE.
Since the spatial extentions of the inhomogeneities are of the order of
the grid spacing (a single peak consists of 1-4 Lagrangian elements), we
conclude that we are not able to spatially resolve the developing
structures.
In our models, the described radiative cooling instability occurs if
the following criteria are fulfilled:
- The energy dissipation in the shock wave is strong enough to
completely dissociate all molecules relevant for the radiative
cooling (in particular CO);
- The shocked gas remains in pressure equlibrium with its local
environment;
- The mass density of the shocked gas does not exceed a value of
10
 ,
otherwise the effect of increasing
optical depth in the spectral lines inhibits the instability
(see Fig. 3).
,
otherwise the effect of increasing
optical depth in the spectral lines inhibits the instability
(see Fig. 3).
The described radiative instability is of course not restricted
to spherical symmetry as our model, and the resulting structure formation
in the post-shock cooling gas, temporarily leading to a side-by-side of
molecule-rich and molecule-poor regions, may be part of the explanation
of the internal "clumpiness'' of the thin CO-shells observed in the
detached shells of TT Cyg by (Olofsson et al. 2000).
![\begin{figure}
\par\includegraphics[width=6.5cm,clip]{H4073F14.PS}
\end{figure}](/articles/aa/full/2003/22/aah4073/Timg203.gif) |
Figure 9:
Control loop of the radiative instability.
and
mark positive and negative feedbacks, respectively. For
example,
indicates that an increase of the causing
quantity results in a decrease of the affected quantity and vice
versa. All closed loops (including the big circle) have an
overall positive feedback, i.e. are self-amplifying. |
| Open with DEXTER |
6 Conclusions
In this paper, dynamical model calculations for the winds of C-stars have been
presented which contain a time-independent non-LTE description of the gas and
a time-dependent description of dust nucleation, growth and evaporation.
The results have been obtained by
applying the non-LTE state and cooling functions developed in Paper I
in the frame of the Berlin C HILD-code developed by
Fleischer et al. (1992).
These new models are technically realised by using
4-dimensional tables of the state functions in the hydro-code.
According to the outlined approximations for the non-LTE treatment of
the gas, the state functions (pressure p, internal energy e,
radiative net heating function
)
depend on ,
,
and
.
The main result of the new models is that the gas behaves almost isothermal
close to the star, in particular in the dust formation zone, where the
densities are of the order of
 .
Just at these densities, the efficiency of the energy exchange
between gas and radiation field is maximum which results in a close coupling
of the gas to the condition of radiative equilibrium (RE). Therefore,
propagating shock waves caused by the stellar pulsation are only accompanied by
very narrow post-shock cooling zones in this region (actually unresolved in
our numerical models).
.
Just at these densities, the efficiency of the energy exchange
between gas and radiation field is maximum which results in a close coupling
of the gas to the condition of radiative equilibrium (RE). Therefore,
propagating shock waves caused by the stellar pulsation are only accompanied by
very narrow post-shock cooling zones in this region (actually unresolved in
our numerical models).
Consequently, the dust formation and wind acceleration proceeds in a
very similar way as outlined by Fleischer et al. (1992) and Höfner et al. (1995)
and our conclusions about the mass loss
mechanism of AGB stars are basically identical. We generally find a
dust-driven outflow triggered by the pulsation of the star. In
contrast, no computational evidence for a long-lasting increase of the
temperatures close to the pulsating AGB star have been found in the
models (the occurrence of a "calorisphere'' as termed by Willson 2000),
which is a straightforward consequence of the applied radiative
cooling rates. Only if the pre-shock gas densities were as
small as
 ,
the radiative cooling
would be so inefficient that the relaxation towards RE would remain
incomplete, before the next shock wave encounters the gas element.
However, such small gas densities close to the star are not consistent
with the observed mass loss rates, which implies that the purely
pulsation-driven mass loss as proposed by Bowen (1988) is incompatible
with our non-LTE radiative cooling rates.
,
the radiative cooling
would be so inefficient that the relaxation towards RE would remain
incomplete, before the next shock wave encounters the gas element.
However, such small gas densities close to the star are not consistent
with the observed mass loss rates, which implies that the purely
pulsation-driven mass loss as proposed by Bowen (1988) is incompatible
with our non-LTE radiative cooling rates.
The new model calculations have recently been used as reference model
for the analysis of permitted and forbidden Fe II emission lines as
observed in Mira stars (Richter & Wood 2001; Richter et al. 2002). The non-LTE line transfer calculations
performed on detailed shock structures, resulting from
the application of our radiative cooling rates in thermodynamical
models of periodically shocked fluid elements, suggest that the
narrow but hot post-shock cooling zones, as occurring in the presented
dynamical model calculations, are sufficient to explain the
observed Fe II emission line fluxes.
There occur, however, also several new features in the models which are
caused by the introduction of the non-LTE state functions and have not
been reported so far. These effects are generally more pronounced outside
of the dust formation zone, where the densities (and hence the radiative
cooling rates) are smaller.
- The varying molecular weight
plays an important role for
the structure of the photosphere and the pressure-dominated regions
close to the star, in particular concerning the hydrostatic start
structure. In comparison to a mono-atomic gas, the refined
thermal equation of state usually results in a steeper hydrostatic
density gradient.
- The inclusion of the binding energies of H2-molecules in
the caloric equation of state has a significant influence on the
thermal behaviour of the gas in the transition region
close to the star as well as
on the response of the gas to the energy dissipation caused by
propagating shock waves.
- Dissociative shock waves occur for shock velocities
(see also Richter et al. 2002). Only these shocks are
energetically capable to destroy all H2 molecules and are
characterised by high post-shock temperatures, typically 8000 K to
11 000 K and extended post-shock cooling zones. In contrast, weaker
shock waves produce much less pronounced temperature
peaks.
- In combination with the much smaller non-LTE radiative cooling
rates as compared to LTE considerations, the H2-reformation
significantly delays the radiative relaxation towards RE by the
liberation of chemical binding energies. This effect (the "H2 energy
buffer'') may result in extended regions at a distance of several
stellar radii away from the star that remain in non-RE for a
considerable fraction of one pulsational period. This behaviour
might be related to the physical origin of the so-called warm
molecular layers (Tsuji et al. 1997).
- The formation of molecules in the radiative relaxation zone
behind a dissociative shock wave leads to an acceleration of the
cooling process. Thus, a two-step cooling is typical where the
initially fast cooling by permitted atomic lines down to
6000 K is followed by a second phase of intense
molecular cooling below 3000 K, accompanied by a second
phase of post-shock compression. In between, the gas mainly cools
by forbidden metal emission lines, or adiabatically.
- The re-increase of the radiative cooling rates with decreasing
gas temperature due to molecule formation causes a radiative instability
of the post-shock cooling gas at small densities.
This instability may lead to a spatial coexistence
of cool molecule-rich and warm molecule-poor regions in the radiative
relaxation zone behind dissociative shock waves,
possibly related to the internal clumpiness of the
detached shells of TT Cyg as observed by (Olofsson et al. 2000).
Another remarkable point is that in our models, the H2 formation
and the dust formation are closely related due to energetic
constraints (the H2 energy buffer). A dynamic treatment of the
process of H2 formation by three-body gas phase reactions and
surface reactions on dust grains would, therefore, be highly
desirable.
Acknowledgements
We want to thank Jan Martin Winters and Axel Fleischer for providing us with
the C HILD-CODE, thus making this work possible. Furthermore we want to
thank Thorsten Arndt for many valuable advices.
This work has been supported by the DFG, Sonderforschungsbereich 555, Komplexe Nichtlineare Prozesse, part project B8. The numerical tables of
the non-LTE state functions have been computed on the T3E parallel computer
at the Konrad-Zuse-Zentrum für Informationstechnik Berlin, project
bvpt17.
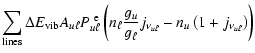
Appendix A: Non-LTE treatment of molecules
The contribution of ro-vibrational line transitions of molecules to
the net radiative heating rate
is calculated by means of an
approximate non-LTE description of their ro-vibrational states.
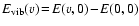
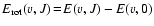
The level energies are assumed to be given by E(v,J) where v and J
are appropriate sets of quantum numbers describing the vibrational and
rotational state of the molecule, the structure of which may vary with
the type of the molecule.
As in Paper I, we introduce two yet unknown excitation temperatures
 for each molecule by assuming
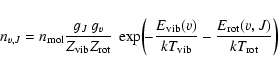 |
(A.1) |
 is the total particle density of the molecule and
nv,J the particle density in the state (v,J).
is the total particle density of the molecule and
nv,J the particle density in the state (v,J).
 is the vibrational excitation
energy in the rotational ground state and
is the vibrational excitation
energy in the rotational ground state and
 the rotational excitation
energy.
the rotational excitation
energy.
 and
gJ,gv are the vibrational
and rotational partition functions and the statistical weights,
respectively.
and
gJ,gv are the vibrational
and rotational partition functions and the statistical weights,
respectively.
The drawback of the methods developed in Paper I was that the calculations
were restricted to simple types of molecules (diatomic or linear) and
simple types of transitions (pure rotational and fundamental mode
vibrational). Furthermore,
 and
and
 were calculated
independently, which is physically not correct, because the
ro-vibrational line transitions affect both. In this appendix, we aim
at a more general formulation of the problem where we can account for
arbitrary types of molecules and can handle pure rotational
and ro-vibrational transitions of various type (also overtone
transitions and combination bands) simultaneously.
were calculated
independently, which is physically not correct, because the
ro-vibrational line transitions affect both. In this appendix, we aim
at a more general formulation of the problem where we can account for
arbitrary types of molecules and can handle pure rotational
and ro-vibrational transitions of various type (also overtone
transitions and combination bands) simultaneously.
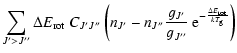
The unknown excitation temperatures
are determined
by considering the gains and losses of vibrational and rotational
excitation energies of the molecule as caused by radiative and collisional
transitions. For the radiative transitions (r.h.s. of
Fig. A.1), the energy of each absorbed or emitted photon
is split into
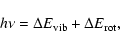 |
(A.2) |
where the energy differences are
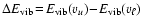 and
and
 .
Introducing lower
and upper sets of ro-vibrational quantum numbers as
u=(vu,Ju) and
.
Introducing lower
and upper sets of ro-vibrational quantum numbers as
u=(vu,Ju) and
 for each line transition, the net radiative
energy transfer rates to the vibrational and rotational excitation are
given by
for each line transition, the net radiative
energy transfer rates to the vibrational and rotational excitation are
given by
with the Einstein-coefficient  ,
the escape probability
,
the escape probability
 and a dimensionless form of the continuous background
intensity
and a dimensionless form of the continuous background
intensity
 as introduced
in Paper I.
as introduced
in Paper I.
For the collisional processes (l.h.s. of Fig. A.1), the
same splitting of energy of general type
 could be carried out, too. However, the cross sections for such
general collision rates is usually not available. Instead we consider
collisions which only change the rotational or the vibrational
state of the molecule. The respective collisional energy transfer
rates are calculated as
could be carried out, too. However, the cross sections for such
general collision rates is usually not available. Instead we consider
collisions which only change the rotational or the vibrational
state of the molecule. The respective collisional energy transfer
rates are calculated as
where now
 and
and
 .
nv is the total occupational number of the molecule in
the vibrational state v (sum over rotational sub-states) and nJ the total occupational number of the molecule in the
rotational state J (disregarding vibrational excitation here).
.
nv is the total occupational number of the molecule in
the vibrational state v (sum over rotational sub-states) and nJ the total occupational number of the molecule in the
rotational state J (disregarding vibrational excitation here).
![\begin{figure}
\par\includegraphics[width=7cm,clip]{H4073F15.PS}
\end{figure}](/articles/aa/full/2003/22/aah4073/Timg232.gif) |
Figure A.1:
Energy fluxes between the internal energy of the gas
contained in its translational degrees of freedom,
a molecule subdivided into internal vibrational and rotational
excitation energies, and the radiation field. |
Table A.1:
Fit coefficients for ro-vibrational energy levels and
Einstein coefficients for polar diatomic molecules.
In statistical equilibrium, the occupational numbers of all
(v,J)-states have relaxed toward a steady state. Consequently, the
energies contained in the molecule in form of rotational and
vibrational excitation are constant, i.e.
 |
(A.7) |
The steady state condition (A.7) provides two non-linear coupled
algebraic equations for the two unknowns
and
,
which can be
solved by standard iterative numerical methods. Finally, the total
contribution of the molecule to the net radiative heating rate of the gas is
given by
 |
(A.8) |
 can be optionally calculated from the l.h.s.
or the r.h.s. of Eq. (A.8), a property which can be used to
check the quality of the solution. According to Eq. (A.8),
the ro-vibrational states of molecules act only as a transmitter,
transferring radiative energy into thermal kinetic energy (radiative heating) or vice versa (radiative cooling) in statistical
equilibrium.
can be optionally calculated from the l.h.s.
or the r.h.s. of Eq. (A.8), a property which can be used to
check the quality of the solution. According to Eq. (A.8),
the ro-vibrational states of molecules act only as a transmitter,
transferring radiative energy into thermal kinetic energy (radiative heating) or vice versa (radiative cooling) in statistical
equilibrium.
Detailed level energies and transition probabilities for H2O, HCN,
C2H2, N2, CO2, H2S, SO2, OH and OCS have been
deduced from the H ITRAN-database (Rothman et al. 1987) as summarised in Table A.2. The
radiative data for H2 are taken from Turner et al. (1977). The vibrational deexcitation rates due to
collisions with H, He and H2 to the vibrational ground state
 are generally calculated by means of the analytical
formula of Millikan & White (1964) (see Eq. (41) in
Paper I), except for CO (Neufeld & Hollenbach 1994)
and for H2 (Lepp & Shull 1983). In case of the
molecules listed in Table A.2, we only take into account
these collision rates by considering the fundamental frequencies of
the molecules. In all other cases (simple diatomic molecules), also
the collisional deexcitation rates to excited vibrational levels
are generally calculated by means of the analytical
formula of Millikan & White (1964) (see Eq. (41) in
Paper I), except for CO (Neufeld & Hollenbach 1994)
and for H2 (Lepp & Shull 1983). In case of the
molecules listed in Table A.2, we only take into account
these collision rates by considering the fundamental frequencies of
the molecules. In all other cases (simple diatomic molecules), also
the collisional deexcitation rates to excited vibrational levels
 are taken into account, using "surprisal analysis''
(Elitzur 1983, see Eq. (44) in Paper I).
are taken into account, using "surprisal analysis''
(Elitzur 1983, see Eq. (44) in Paper I).
The net energy transfer rate to the rotational excitation energy due
to collisions with H, H2 and He, can be summarised as stated in
Eq. (35) of Paper I. Concerning the molecules listed in
Table A.2, the total rotational cross section  is
thereby scaled with the measured value for H2O (Hollenbach & McKee 1989)
according to the "size'' of the molecule
(estimated from the co-volume
is
thereby scaled with the measured value for H2O (Hollenbach & McKee 1989)
according to the "size'' of the molecule
(estimated from the co-volume  in the Van-der-Waals law, data
from Weast
in the Van-der-Waals law, data
from Weast
 1989)
1989)
 |
(A.9) |
For some important polar diatomic molecules, we follow a different strategy.
Detailed level energies for CO, SiO and CS and the radiative data for their
fundamental mode, 1st and 2nd overtone transitions have been
kindly provided by Jørgensen (1997, priv. comm.). From these data, we fit
![$E({v},J)~\rm [cm^{-1}]$](/articles/aa/full/2003/22/aah4073/img250.gif) and the Einstein coefficients
and the Einstein coefficients
![$A_{u\ell}~\rm [s^{-1}]$](/articles/aa/full/2003/22/aah4073/img251.gif) separately for each pand r-branch to the
separately for each pand r-branch to the  and
and
 data
(see Table A.1), using the following analytical representations
data
(see Table A.1), using the following analytical representations
 |
|
|
(A.11) |
where
 .
These analytical formulae enable us
to treat the radiative transitions more systematically, e.g. to adjust the
necessary number of transitions according to the temperature
and the
radiation field. Additionally, the pure rotational radiative transitions are
included in the way described in Paper I. Other polar diatomic molecules
(OH, CH, CN, SiS, SiC, SiN, SO, HS), which have turned out not to be very
important for the radiative heating/cooling, are still included by their
simplified energy levels and radiative data for the pure rotational
and fundamental mode ro-vibrational transitions as described in Paper I.
.
These analytical formulae enable us
to treat the radiative transitions more systematically, e.g. to adjust the
necessary number of transitions according to the temperature
and the
radiation field. Additionally, the pure rotational radiative transitions are
included in the way described in Paper I. Other polar diatomic molecules
(OH, CH, CN, SiS, SiC, SiN, SO, HS), which have turned out not to be very
important for the radiative heating/cooling, are still included by their
simplified energy levels and radiative data for the pure rotational
and fundamental mode ro-vibrational transitions as described in Paper I.
Table A.2:
Overview of the data obtained from the H
ITRAN-database for polyatomic molecules and N2, and for
H2.
The total rotational cross sections for the diatomic molecules are scaled
according to the measured value for CO (Hollenbach & McKee 1979)
 |
(A.12) |
Appendix B: List of symbols
| model parameter: |
|
(initial) luminosity of the star |
|
stellar mass |
|
(initial) effective temperature |
| P |
period of the stellar pulsation |
|
velocity amplitude of the stellar pulsation |
| C/O |
carbon-to-oxygen element ratio |
| hydro- and thermodynamic quantities: |
| t |
time since the onset the calculation |
| r |
radial position of a Langrangian mass element |
| r0 |
initial radial position at t=0 |
| u |
hydrodynamic velocity |
 |
force per unit mass via articifial viscosity |
| M(r) |
enclosed mass inside radius r |
|
ratio of radiative acceleration to gravitational
deceleration g |
|
kinetic gas temperature |
|
mass density |
|
|
total hydrogen particle density
 |
| p |
thermal gas pressure |
| V |
specific volume  |
| V0 |
initial specific volume at t=0 |
| e |
internal energy of the gas |
|
|
net radiative heating rate |
|
|
heating rate via articifial viscosity |
| radiative transfer: |
| J |
freq. integrated mean intensity
 |
| F |
frequency integrated radiative flux |
|
|
grey radiative equilibrium temperature |
 |
total (gas + dust) grey extinction coefficient |
 |
cosine of the separation angle dividing the solid angle
into domains with intensities I+(r) / I-(r) |
 |
inner boundary of the model |
| R |
outer boundary of the model |
| dust quantities: |
| f(N) |
dust size distribution function |
| Kj |
jth dust moment
 |
| N |
number of carbon atoms in a dust grain |
 |
minimum size of dust grains included in Kj |
 |
flux of particles through the lower integration boundary |
 |
characteristic net growth time scale |
| physical constants: |
| G |
gravitational constant |
| c |
speed of light |
 |
Stefan-Boltzmann constant |
-
Bowen, G. H. 1988, ApJ, 329, 299
In the text
NASA ADS
-
Elitzur, M. 1983, ApJ, 266, 609
In the text
NASA ADS
-
Fleischer, A. J. 1994, Ph.D. Thesis, Technische Universität, Berlin, Germany
In the text
-
Fleischer, A. J., Gauger, A., & Sedlmayr, E. 1992, A&A, 266, 321
In the text
NASA ADS
-
Fleischer, A. J., Gauger, A., & Sedlmayr, E. 1995, A&A, 297, 543
In the text
NASA ADS
-
Gail, H.-P., Keller, R., & Sedlmayr, E. 1984, A&A, 133, 320
In the text
NASA ADS
-
Gail, H.-P., & Sedlmayr, E. 1987a, A&A, 171, 197
In the text
NASA ADS
-
Gail, H.-P., & Sedlmayr, E. 1987b, A&A, 177, 186
In the text
NASA ADS
-
Gail, H.-P., & Sedlmayr, E. 1988, A&A, 206, 153
In the text
NASA ADS
-
Gauger, A., Gail, H.-P., & Sedlmayr, E. 1990, A&A, 235, 345
In the text
NASA ADS
-
Habing, H. 1996, A&AR, 7, 97
In the text
-
Hashimoto, O. 1995, ApJ, 442, 286
In the text
NASA ADS
-
Helling, Ch. 1999, Ph.D. Thesis, Technische Universität Berlin, Germany
In the text
-
Helling, Ch., Arndt, T., & Sedlmayr, E. 2002, in Radial and
Nonradial Pulsations as Probes of Stellar Physics, ed. C. Aerts, T. Bedding,
& C. Christensen-Dalsgaard (Michigan: Astronomical Society of the Pacific), IAU Coll., 185,
546
In the text
-
Helling, Ch., Winters, J. M., & Sedlmayr, E. 2000, A&A, 358, 651
In the text
NASA ADS
-
Höfner, S., Feuchtinger, M. U., & Dorfi, E. A. 1995, A&A, 297, 815
In the text
NASA ADS
-
Höfner, S., Gautschy-Loidl, R., Aringer, B., & Jørgensen, U. G.
2003, A&A, 399, 589
In the text
NASA ADS
-
Hollenbach, D., & McKee, F. 1979, ApJS, 41, 555
In the text
NASA ADS
-
Hollenbach, D., & McKee, F. 1989, ApJ, 342, 306
In the text
NASA ADS
-
Hummer, D. G. 1988, ApJ, 327, 477
NASA ADS
-
John, T. L. 1994, MNRAS, 266, 186
NASA ADS
-
John, T. L., & Williams, R. J. 1977, MNRAS, 181, 483
NASA ADS
-
Lepp, S., & Shull, M. 1983, ApJ, 270, 578
In the text
NASA ADS
-
Maciel, W. J. 1977, A&A, 57, 273
In the text
NASA ADS
-
Mihalas, D. 1978, Stellar Atmospheres, 2nd ed. (San Francisco: W. H. Freeman
and Company)
In the text
-
Millikan, R. C., & White, D. R. 1964, J. Chem. Phys., 39, 3209
In the text
-
Neufeld, D. A., & Hollenbach, D. J. 1994, ApJ, 428, 170
In the text
NASA ADS
-
Olofsson, H., Bergman, P., Lucas, R., et al. 2000, A&A, 353, 583
In the text
NASA ADS
-
Pijpers, F. P., & Habing, H. J. 1989, A&A, 215, 334
In the text
NASA ADS
-
Pijpers, F. P., & Hearn, A. G. 1989, A&A, 209, 198
In the text
NASA ADS
-
Puls, J., & Hummer, D. J. 1988, A&A, 191, 87
In the text
NASA ADS
-
Richter, H., & Wood, P. R. 2001, A&A, 369, 1027
In the text
NASA ADS
-
Richter, H., Wood, P. R., Woitke, P., Bolick, U., & Sedlmayr, E. 2002, A&A,
submitted
In the text
-
Richtmyer, R. D., & Morton, K. W. 1967, Difference methods for initial-value
problems, 2nd edn. (New York: John Wiley & Sons)
In the text
-
Rothman, L. S., Gamache, R. R., Goldman, A., et al. 1987, Appl. Opt., 26,
4058
In the text
NASA ADS
-
Somerville, W. B. 1964, ApJ, 139, 192
NASA ADS
-
Stilley, J. L., & Callaway, J. 1970, ApJ, 160, 245
NASA ADS
-
Tscharnuter, W. M., & Winkler, K.-H. 1979, Comp. Phys. Comm., 18, 171
In the text
NASA ADS
-
Tsuji, T., Ohnaka, K., Aoki, W., & Yamamura, I. 1997, A&A, 320, L1
In the text
NASA ADS
-
Turner, J., Kirby-Docken, K., & Dalgarno, A. 1977, ApJS, 35, 281
In the text
NASA ADS
-
Unno, W., & Kondo, M. 1976, PASJ, 28, 347
In the text
NASA ADS
-
Wachter, A. C., Schröder, K.-P., Winters, J. M., Arndt, T. U., & Sedlmayr,
E. 2002, A&A, 384, 452
In the text
NASA ADS
-
Wallerstein, G., & Knapp, G. R. 1998, ARA&A, 36, 369
In the text
NASA ADS
-
Willson, L. A. 2000, ARA&A, 38, 573
In the text
NASA ADS
-
Willson, L. A., & Bowen, G. H. 1998, in Cyclical variability in stellar winds,
ed. L. Kaper, & A. W. Fullerton (Springer), 294
In the text
-
Winters, J. M., Fleischer, A. J., Le Bertre, T., & Sedlmayr, E. 1997, A&A,
326, 305
In the text
NASA ADS
-
Winters, J. M., Le Bertre, T., Jeong, K. S., Helling, Ch., & Sedlmayr, E. 2000,
A&A, 361, 641
In the text
NASA ADS
-
Wishart, A. W. 1979, MNRAS, 187, 59p
NASA ADS
-
Woitke, P. 2002, in Modelling of Stellar Atmospheres, ed. N. E. Piskunov,
W. W. Weiss, & D. F. Gray, IAU Symp., 210, in press
In the text
-
Woitke, P., Krüger, D., & Sedlmayr, E. 1996a, A&A, 311, 927
(Paper I)
In the text
NASA ADS
-
Woitke, P., Goeres, A., & Sedlmayr, E. 1996b, A&A, 313, 217
(Paper II)
In the text
NASA ADS
-
Woitke, P., & Schirrmacher, V. 1999, in Abstracts of the 2nd Austrian ISO
Workshop. Atmospheres of M, S and C Giants, ed. J. Hron, & S. Höfner
(Institute of Astronomy, University of Vienna), 23
In the text
-
Woitke, P., & Sedlmayr, E. 1999, A&A, 347, 617
In the text
NASA ADS
-
Wood, P. R. 1979, ApJ, 227, 220
In the text
NASA ADS
Copyright ESO 2003
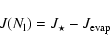
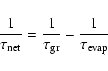
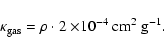
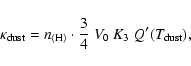
![\begin{figure}
\par\includegraphics[width=7.8cm,clip]{H4073F1.PS}
\end{figure}](/articles/aa/full/2003/22/aah4073/img105.gif)
![\begin{figure}
\par\includegraphics[width=7.8cm,clip]{H4073F2.PS}
\end{figure}](/articles/aa/full/2003/22/aah4073/img117.gif)
![\begin{figure}
\par\includegraphics[width=7.8cm,clip]{H4073F3.PS}
\end{figure}](/articles/aa/full/2003/22/aah4073/img126.gif)
![\begin{figure}
\par\includegraphics[width=8.2cm,clip]{H4073F4.PS}
\end{figure}](/articles/aa/full/2003/22/aah4073/img128.gif)
![\begin{figure}
\par\includegraphics[width=8cm,clip]{H4073F5.PS}\vspace*{3mm}
\par\includegraphics[width=7.8cm,clip]{H4073F6.PS}
\end{figure}](/articles/aa/full/2003/22/aah4073/img161.gif)
![\begin{figure}
\par\includegraphics[width=8.4cm,clip]{H4073F7.PS}
\end{figure}](/articles/aa/full/2003/22/aah4073/img171.gif)
![\begin{figure}
\par\includegraphics[width=5.8cm,clip]{H4073F8.PS}\hspace*{2mm}
\...
....PS}\hspace*{2mm}
\includegraphics[width=5.8cm,clip]{H4073F10.PS}
\end{figure}](/articles/aa/full/2003/22/aah4073/img185.gif)
![\begin{figure}
\par\includegraphics[width=5.6cm,clip]{H4073F11.PS}\hspace*{2mm}
...
....PS}\hspace*{2mm}
\includegraphics[width=5.6cm,clip]{H4073F13.PS}
\end{figure}](/articles/aa/full/2003/22/aah4073/img192.gif)
![\begin{figure}
\par\includegraphics[width=6.5cm,clip]{H4073F14.PS}
\end{figure}](/articles/aa/full/2003/22/aah4073/img203.gif)