The
![]() -test is a simple method developed by Avni & Bahcall
(1980) based on the
-test is a simple method developed by Avni & Bahcall
(1980) based on the
![]() test of Schmidt
(1968).
test of Schmidt
(1968). ![]() stands for the volume, which is enclosed by
the object, and
stands for the volume, which is enclosed by
the object, and ![]() is the accessible volume, in which the object
could have been found (e.g. due to a flux limit of a survey).
Avni & Bahcall showed that different survey areas with different flux limits in various energy
bands can be combined by the
is the accessible volume, in which the object
could have been found (e.g. due to a flux limit of a survey).
Avni & Bahcall showed that different survey areas with different flux limits in various energy
bands can be combined by the
![]() -test. In the case of no
evolution
-test. In the case of no
evolution
![]() is expected and following
Avni & Bahcall (1980) the error
is expected and following
Avni & Bahcall (1980) the error
![]() for a given
mean value
for a given
mean value
![]() based on n objects is:
based on n objects is:
 |
(4) |
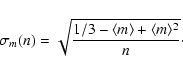
Applied to the complete sample the test yields
![]() .
This result shows that HBLs
have been less numerous and/or less luminous in the past, but the
significance is only
.
This result shows that HBLs
have been less numerous and/or less luminous in the past, but the
significance is only ![]() .
The negative evolution of X-ray
selected BL Lac objects has been reported several times before. We
also performed a K-S test in order to determine the probability of
uniform
.
The negative evolution of X-ray
selected BL Lac objects has been reported several times before. We
also performed a K-S test in order to determine the probability of
uniform
![]() distribution, which would mean no
evolution. For the whole HRX-BL Lac sample the probability of no
evolution is rather small (3.5%).
distribution, which would mean no
evolution. For the whole HRX-BL Lac sample the probability of no
evolution is rather small (3.5%).
Thanks to the large number of objects with known redshifts within the
HRX-BL Lac sample it is possible to examine dependencies of the
evolution on other parameters, like the overall spectral indices.
A division into two groups (more and less X-ray
dominated objects) according to
![]() was already made by Bade et al. (1998) for the core sample and resulted in a lower
was already made by Bade et al. (1998) for the core sample and resulted in a lower
![]() for the HBLs (
for the HBLs (
![]() )
than for the IBLs within the sample. The
)
than for the IBLs within the sample. The
![]() for IBLs was even consistent with no evolution.
Dividing the HRX-BL Lac sample accordingly we now get
for the HBLs (
for IBLs was even consistent with no evolution.
Dividing the HRX-BL Lac sample accordingly we now get
for the HBLs (
![]() )
)
![]() (N=34) and for the IBLs
(N=34) and for the IBLs
![]() (N=30). The difference between the two groups has practically vanished,
and we are thus
not able to confirm the different types of
evolution for the HBLs and the IBLs. But still there are 13
objects within the HRX-BL Lac sample without known redshift, and nearly all
of them are IBLs. Including them into the
(N=30). The difference between the two groups has practically vanished,
and we are thus
not able to confirm the different types of
evolution for the HBLs and the IBLs. But still there are 13
objects within the HRX-BL Lac sample without known redshift, and nearly all
of them are IBLs. Including them into the
![]() -test by
assigning them either the mean redshift of our sample (z=0.3)
or a high redshift (z=0.7) does
not change the mean
-test by
assigning them either the mean redshift of our sample (z=0.3)
or a high redshift (z=0.7) does
not change the mean
![]() values significantly.
The results of the different
values significantly.
The results of the different
![]() -tests are shown
in Table 6.
Assigning even higher redshifts
would increase the
-tests are shown
in Table 6.
Assigning even higher redshifts
would increase the
![]() for the IBLs, but we consider this
unlikely, as the luminosities would then become exceptionally high.
For example in 0716+714, PG 1246+586, or PG 1437+398 the X-ray luminosities would exceed values of
for the IBLs, but we consider this
unlikely, as the luminosities would then become exceptionally high.
For example in 0716+714, PG 1246+586, or PG 1437+398 the X-ray luminosities would exceed values of
![]() in the
in the
![]() range.
range.
| selection | unknown z | Na |
|
|
| set to | ||||
| all (known z) | - | 64 |
|
3.5 |
| all | 0.3 | 77 |
|
5.3 |
| all | 0.7 | 77 |
|
5.3 |
| HBLs (known z) | - | 34 |
|
24.0 |
| all HBLs | 0.3 | 36 |
|
46.1 |
| all HBLs | 0.7 | 36 |
|
46.1 |
| IBLs (known z) | - | 30 |
|
14.0 |
| all IBLs | 0.3 | 41 |
|
10.7 |
| all IBLs | 0.7 | 41 |
|
10.7 |
|
a Number of objects used for this test.
b K-S test probability that the |
| survey | selection | unknown z | Na |
|
| REX | total | 0.27 | 55 |
|
| REX | HBL | 0.27 | 22 |
|
| sedentary | total | 0.25 | 155 |
|
| DXRBS | all BL Lacs | 0.40 | 30 |
|
| DXRBS | HBL | 0.40 | 11 |
|
| DXRBS | LBL | 0.40 | 19 |
|
a Number of objects used for this test.
We conclude therefore that the HRX sample shows no difference in
evolution for HBLs and IBLs. The results presented here are in good
agreement with recent other investigations on the evolutionary
behaviour of BL Lac objects, as shown in Table 6. Except the
sedentary survey (Giommi et al. 1999) none of
the studies could confirm the highly significant negative evolution
found e.g. by Bade et al. (1998) for the HRX-BL Lac core
sample or by Wolter et al. (1994) for the EMSS BL
Lacs. The best sample to be compared with should be the REX survey,
which also uses the combination of RASS and NVSS data, although going
to lower X-ray flux limits while using only the are of the PSPC
pointed observation. The REX has also a mean redshift of z = 0.3 and
the
![]() are within one sigma when
compared to the HRX-BL Lac sample.
are within one sigma when
compared to the HRX-BL Lac sample.
The complete sample
is large enough to divide it into a high
redshift and a low redshift bin in order to examine possible
differences in their CLF. The dividing value was set to the median of
the HRX-BL Lac sample
![]() .
To derive high and low redshift
CLFs the accessible volume Va,i for the objects with z < 0.272has been restricted to z = 0.272 whenever
.
To derive high and low redshift
CLFs the accessible volume Va,i for the objects with z < 0.272has been restricted to z = 0.272 whenever
![]() .
For
the high redshift objects the accessible volume was computed from z =
0.272 up to
.
For
the high redshift objects the accessible volume was computed from z =
0.272 up to
![]() .
The resulting two cumulative luminosity
functions are shown in Fig. 6.
.
The resulting two cumulative luminosity
functions are shown in Fig. 6.
![\begin{figure}
\par\includegraphics[width=8.8cm,clip]{2548.f6}
\end{figure}](/articles/aa/full/2003/15/aa2548/img163.gif) |
Figure 6: Cumulative luminosity function of the two subsamples with z > 0.272 (circles) and z < 0.272 (open triangles). |
The left panel of Fig. 7 shows the comparison of the HRX-BL Lac complete sample X-ray luminosity function with the results from the
EMSS BL Lac sample (Wolter et al. 1994; Padovani & Giommi
1995). The expected luminosities of the HRX-BL Lacs within the
EINSTEIN IPC energy band (
![]() )
were calculated assuming a
spectral slope of
)
were calculated assuming a
spectral slope of
![]() .
Space densities are given as
number of objects per
.
Space densities are given as
number of objects per
![]() and X-ray luminosity bin following
Padovani & Giommi (1995). The data from the EMSS are consistent
with those from the HRX-BL Lac complete sample within the
and X-ray luminosity bin following
Padovani & Giommi (1995). The data from the EMSS are consistent
with those from the HRX-BL Lac complete sample within the ![]() error bars. The marginal differences can be due to systematic
errors for the calculated luminosities in the IPC band because of
differing spectral slopes, or resulting from differences in the
calibration of the IPC and the PSPC detectors.
error bars. The marginal differences can be due to systematic
errors for the calculated luminosities in the IPC band because of
differing spectral slopes, or resulting from differences in the
calibration of the IPC and the PSPC detectors.
In the right panel of Fig. 7 we compare the
differential luminosity function of the complete sample with the
corresponding function for AGNs at z<0.5. The AGN X-ray luminosity
function was taken from the ROSAC sample ("A ROSAT based Search for
AGN-Clusters'', Tesch 2000). This AGN sample was constructed
similarly as the HRX-BL Lac sample and both samples match closely in
brightnesses and redshifts. The ROSAC-AGN sample contains 182
RASS-AGNs with z < 0.5 identified in an area of
![]() in the constellation of Ursa Major. The AGN X-ray luminosities have
been corrected for the different X-ray band (
in the constellation of Ursa Major. The AGN X-ray luminosities have
been corrected for the different X-ray band (
![]() instead
instead
![]() )
using the same spectral slopes used for the ROSAC
sample.
)
using the same spectral slopes used for the ROSAC
sample.
We find that the space density of BL Lacs in the luminosity range
![]() is about 10% of the space density of
AGNs. In case that all AGNs have jets and would be classified as
BL Lacs when looking into their jet,
an jet opening angle of
is about 10% of the space density of
AGNs. In case that all AGNs have jets and would be classified as
BL Lacs when looking into their jet,
an jet opening angle of
![]() would follow. But as the
jet emission is expected to be beamed, the BL Lacs appear to be
brighter than they are. Following Urry & Shaefer (1984)
the observed luminosity is
would follow. But as the
jet emission is expected to be beamed, the BL Lacs appear to be
brighter than they are. Following Urry & Shaefer (1984)
the observed luminosity is
![]() with
with
![]() being the emitted luminosity, and
being the emitted luminosity, and
 |
(5) |
![\begin{figure}
\par\includegraphics[width=6.5cm,clip]{2548.f7}\hspace*{1cm}
\includegraphics[width=6.5cm,clip]{2548.f8}
\end{figure}](/articles/aa/full/2003/15/aa2548/img182.gif) |
Figure 7:
Left panel: The differential X-ray luminosity function of the HRX-BL Lac complete sample (circles) in comparison to EMSS BL Lacs (triangles; Padovani & Giommi 1995). The X-ray data of the HRX-BL Lac objects have been extrapolated to the EINSTEIN IPC energy band assuming a spectral slope of
|
Copyright ESO 2003