Vela X-1 was first detected by a rocket-borne experiment (Chodil et al. 1967) and subsequent observations (see, for example, Giacconi et al. 1972), suggested that the source was highly variable. Using data from the OSO-7 satellite, Ulmer et al. (1972) demonstrated evidence for intensity variations which were interpreted as eclipses with a period of around 9 days. An optical counterpart, GP Vel / HD 77581 (a B0.5 giant with mv = 6.8) was identified by Brucato & Kristian (1972) and Hiltner et al. (1972), based on its ultra-violet excess and radial velocity variations.
An X-ray pulse period of 283 s was subsequently discovered using the SAS-3 satellite (Rappaport & McClintock 1975; McClintock et al. 1976). Timing
observations of these pulses by Rappaport et al. (1976) allowed
the radial velocity semi-amplitude of the X-ray component to be measured as
![]() km s-1, and the eccentricity of the system,
km s-1, and the eccentricity of the system,
![]() .
Later work, using Hakucho and Tenma data (Deeter et al.
1987), gave a value of
.
Later work, using Hakucho and Tenma data (Deeter et al.
1987), gave a value of
![]() light seconds for the
projected semi-major axis. Using values for the orbital period P and the
eccentricity of the orbit e, the corresponding
light seconds for the
projected semi-major axis. Using values for the orbital period P and the
eccentricity of the orbit e, the corresponding ![]() value may be
calculated according to
value may be
calculated according to
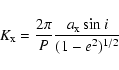 |
(9) |
The X-ray eclipse duration appears to be quite variable, and somewhat energy
dependent. For example, Forman et al. (1973) obtained a value for the
half angle of the eclipse of
![]() using the
Uhuru satellite and Charles et al. (1976) obtained a value of
using the
Uhuru satellite and Charles et al. (1976) obtained a value of
![]() using the Copernicus satellite,
whereas Watson & Griffiths (1977) quote a value of
using the Copernicus satellite,
whereas Watson & Griffiths (1977) quote a value of
![]() obtained using Ariel V data. However the
earlier two experiments were at much softer energies than Watson & Griffiths
observed, and softer X-rays are much more likely to be absorbed by
circumstellar material, thus extending the observed eclipse time.
obtained using Ariel V data. However the
earlier two experiments were at much softer energies than Watson & Griffiths
observed, and softer X-rays are much more likely to be absorbed by
circumstellar material, thus extending the observed eclipse time.
|
|
Reference |
| 37-45 | Wallerstein (1974) |
| Zuiderwijk (1974) | |
| van Paradijs et al. (1976) | |
|
|
van Paradijs et al. (1977) |
|
|
Rappaport & Joss (1983) |
| 18.0-28.2 | (95% conf. range) van Kerkwijk et al. (1995) |
|
|
Stickland et al. (1997) |
| 22 | (Correction to the above) Barziv et al. (2001) |
|
|
Barziv et al. (2001) |
|
|
this paper |
Early determinations of ![]() were made by Wallerstein (1974) and
Zuiderwijk et al. (1974), see Table 1. As regular X-ray pulsations had yet to
be discovered at this point, assumptions had to be made about the mass of the
optical component in order to estimate the mass of the compact object.
Zuiderwijk et al. (1974) obtained a value of
were made by Wallerstein (1974) and
Zuiderwijk et al. (1974), see Table 1. As regular X-ray pulsations had yet to
be discovered at this point, assumptions had to be made about the mass of the
optical component in order to estimate the mass of the compact object.
Zuiderwijk et al. (1974) obtained a value of
![]() ,
and suggested that such a large mass coupled with the lack of regular
pulsations indicated that the compact object was a black hole. The discovery
of regular X-ray pulsations provided a means of determining the masses of both
components directly, and also ruled out the possibility of the compact object
being a black hole.
,
and suggested that such a large mass coupled with the lack of regular
pulsations indicated that the compact object was a black hole. The discovery
of regular X-ray pulsations provided a means of determining the masses of both
components directly, and also ruled out the possibility of the compact object
being a black hole.
Van Paradijs et al. (1976) combined their ![]() value obtained from 26
coudé spectrograms (Table 1) with the
value obtained from 26
coudé spectrograms (Table 1) with the ![]() value of Rappaport &
McClintock (1975). Using X-ray eclipse data, they determined that
value of Rappaport &
McClintock (1975). Using X-ray eclipse data, they determined that
![]() ,
and thus arrived at a mass of
,
and thus arrived at a mass of
![]() for the
neutron star. Van Paradijs et al. (1977) subsequently refined their
for the
neutron star. Van Paradijs et al. (1977) subsequently refined their ![]() value using yet more photographic spectra (Table 1) and Rappaport & Joss
(1983) revised
value using yet more photographic spectra (Table 1) and Rappaport & Joss
(1983) revised ![]() further (Table 1) obtaining a neutron star mass
estimate of
further (Table 1) obtaining a neutron star mass
estimate of
![]() by combining data from a number
of sources, including Watson & Griffiths (1977), and Rappaport et al. (1980),
and performing a Monte Carlo analysis to estimate the
uncertainties.
by combining data from a number
of sources, including Watson & Griffiths (1977), and Rappaport et al. (1980),
and performing a Monte Carlo analysis to estimate the
uncertainties.
More recently, van Kerkwijk et al. (1995) made further optical observations of
GP Vel, and discovered strong deviations from a pure Keplerian velocity curve,
which were auto-correlated within a single night, but not from one night to
another. It was suggested that the variable gravitational force exerted by the
neutron star as it travels around its eccentric orbit excites short-lived
oscillations on the surface of the optical component which affect the measured
radial velocity. From their ![]() value (Table 1) van Kerkwijk et al.
(1995) obtained
value (Table 1) van Kerkwijk et al.
(1995) obtained
![]() .
A significantly
lower value for
.
A significantly
lower value for ![]() (Table 1) was obtained from observations using the
IUE satellite by Stickland et al. (1997). However,
Barziv et al. (2001) report that the analysis of these IUE data was
subject to an error and a correct analysis yields a value consistent with those
previously measured (Table 1) thus solving the discrepancy.
(Table 1) was obtained from observations using the
IUE satellite by Stickland et al. (1997). However,
Barziv et al. (2001) report that the analysis of these IUE data was
subject to an error and a correct analysis yields a value consistent with those
previously measured (Table 1) thus solving the discrepancy.
The most recent measurement of the optical radial velocity curve of GP Vel
(Barziv et al. 2001) made use of 183 spectra obtained over a nine month
campaign in order to try to average out the deviations reported by van Kerkwijk et al. (1995). Although they were quite successful in averaging
out these excursions, they were left with different, phase-locked deviations
in the radial velocity curve. Despite this they determined an accurate
![]() value (Table 1) and set a limit on the neutron star mass of
value (Table 1) and set a limit on the neutron star mass of
![]() .
.
Copyright ESO 2003