We have interpreted the EPIC and RGS spectra using collisional ionization equilibrium (CIE) plasma models with variable cosmic abundances. To obtain reasonable estimates taking into account the uncertainties in the atomic parameters, we have used two different software packages that contain different atomic databases. The Utrecht software SPEX (Kaastra et al. 1996) uses an updated version of the MEKAL spectral code (Mewe et al. 1985; Mewe et al. 1995a; Phillips et al. 1999) with ionization balances from Arnaud & Rothenflug (1985) and Arnaud & Raymond (1992) for Fe. The XSPEC 11.0.1aj (Arnaud 1996) software uses the APEC 1.0.1 spectral code (Smith et al. 2001) with the self-consistent ionization balance from Mazzotta et al. (1998). The RGS spectra were grouped with a minimum of 30 to 80 counts per bin (depending on the source), whereas the EPIC MOS2 data were binned with a minimum of 25 counts per bin (100 for HR 1099).
X-ray spectra have conventionally been interpreted either by measuring a number of selected lines above the continuum level and subsequently reconstructing the emission measure distribution and the abundances; or by fitting complete thermal models to the total spectrum. Each approach encounters severe limitations with our data. Extracting single line fluxes from RGS spectra is difficult in particular in the crucial but crowded region between 10-20 Å because of line blends and strongly overlapping line profiles and extended line wings. On the other hand, fits of the complete spectrum with pre-calculated thermal models are affected by numerous emission lines with poor atomic physics parameters in the codes (e.g., Audard et al. 2001b; Laming 2002; Raassen et al. 2002). We have chosen to apply a method half-way between the above two extremes that is ideally suited for RGS spectra. We selected a restricted number of individual, bright lines that are believed to be well known in the spectral codes and that cover a wide range of elements and ionization stages. Pieces of most likely line-free regions have been included for an accurate determination of the continuum level. By modeling the lines together and using the calibrated line spread function, we obtain an optimum determination of the fluxes of all overlapping lines. Since we still use a full thermal model including all catalogued lines and the continuum falling within the considered pieces of the spectrum, the method simultaneously takes care of possible ill-recognized weaker lines that may add a pseudo-continuum or that may blend with the selected line, thus altering their fluxes. Our method thus tries to maximize the information extraction from individual lines, and at the same time it approximately models additional flux contributions by weak lines in a self-consistent way.
The high signal-to-noise ratios of the spectra of our RS CVn binaries display a
well-developed continuum emission, allowing us to put constraints on the
EM from regions free of emission lines.
The RGS and EPIC MOS2 spectra were interpreted simultaneously, with the exception of
Capella (RGS only). We have introduced a free constant model to multiply
the physical model for EPIC. This factor takes
into account cross-calibration inaccuracies and especially corrects for the finite extraction
radius used to obtain the source spectra. Indeed, the EPIC responses had been
built under the assumption of an infinite extraction radius, hence
overestimating the effective area. Note that the XMM-Newton on-axis PSF
for the MOS cameras are almost energy-independent (Ehle et al. 2001);
our 50
![]() extraction regions include
extraction regions include ![]() 90% of the fractional encircled energy.
The best-fit values for the constant ranged between 0.90-0.95, except for HR 1099 (0.23-0.25)
because we removed the central part of the PSF.
To profit from the higher spectral resolution of the RGS, we have
discarded the EPIC wavelength range longward of the Mg IX He
90% of the fractional encircled energy.
The best-fit values for the constant ranged between 0.90-0.95, except for HR 1099 (0.23-0.25)
because we removed the central part of the PSF.
To profit from the higher spectral resolution of the RGS, we have
discarded the EPIC wavelength range longward of the Mg IX He![]() triplet (
triplet (
![]() Å,
Å,
![]() keV). Similarly, we eliminated the RGS wavelength range
shortward of the Mg X Ly
keV). Similarly, we eliminated the RGS wavelength range
shortward of the Mg X Ly![]() line (
line (
![]() Å,
Å,
![]() keV)
because of the small RGS effective area at high energies and the consequent
limited quality of the calibration - with the exception of Capella, for
which we included the range from 6.5 to 6.8 Å to account for the bright Si
He-like triplet. Therefore, the RGS and EPIC spectra overlap
around the Mg lines. The consistency between the two detector systems is
additionally provided by the cross calibration, and by the broad-band continuum
in both spectra.
keV)
because of the small RGS effective area at high energies and the consequent
limited quality of the calibration - with the exception of Capella, for
which we included the range from 6.5 to 6.8 Å to account for the bright Si
He-like triplet. Therefore, the RGS and EPIC spectra overlap
around the Mg lines. The consistency between the two detector systems is
additionally provided by the cross calibration, and by the broad-band continuum
in both spectra.
| Instrument | |
| RGS ............................................ | |
| RGS ............................................ | 9.50-12.00 |
| RGS ............................................ | 13.95-14.15 |
| RGS ............................................ | 15.90-16.20 |
| RGS ............................................ | 17.15-17.80 |
| RGS ............................................ | 18.30-18.75 |
| RGS ............................................ | 19.20-20.80 |
| RGS ............................................ | 21.10-21.40 |
| RGS1 .......................................... | |
| RGS2 .......................................... | 22.40-23.65 |
| RGS2 .......................................... | 24.00-24.50 |
| RGS2 .......................................... | 24.90-28.50 |
| RGS2 .......................................... | 30.10-31.10 |
| RGS2 .......................................... | 32.00-33.40 |
| RGS2 .......................................... | |
| MOS2 .......................................... | |
| MOS2 .......................................... | 6.80-7.80 |
| MOS2 .......................................... | |
| a For Capella, we included the range 6.5-6.8 Å. | |
The physical model was defined as a photoelectric absorption component
with free atomic H column density (only for RGS1 and RGS2), and a
combination
of CIE models with free temperature, EM, and abundances (C, N, O, Ne, Mg, Si, S, Ar, Ca, Fe, Ni).
In practice, a 4-T model proved adequate to fit the spectra, except for
Capella for which a 3-T model was sufficient. The absorption components
were left free to vary between RGS1 and RGS2 to account for cross-calibration
uncertainties between the two instruments at the long wavelength end. The
interstellar absorption is negligible for these nearby sources in the
wavelength range of the RGS. Note that we have included
an absorption edge model at 23.3 Å that was not yet included in the RGS
effective areas generated by XMM-Newton SAS 5.2
(see, e.g., den Herder et al. 2002)![]() .
.
For this paper, we have decided to systematically exclude RGS spectral
ranges where L-shell lines dominate (except those of Fe and Ni) because
these lines are often inaccurately described in present spectral codes
(Audard et al. 2001b). Eventually, most of the long wavelength range of the RGS spectra
was eliminated. There remain however still some relatively bright low-Z
L-shell lines in Capella's spectrum that we used to obtain the Si, S, Ar, and Ca
abundances. These lines have atomic parameter uncertainties in the range 10-50%.
The results, in particular for S, Ar, and Ca for Capella should therefore be
treated with some caution. The Si He-like triplet was also included for this star; we
caution, however, that the calibration of the effective area in this range is
less reliable.
A few Fe lines were discarded as well (e.g., Fe XVIII ![]() 16.0 Å, Fe lines
in the
9.5-12.0 Å range) as they were poorly fitted with both spectral codes.
Table 3 summarizes the spectral ranges excluded from the
fitting procedure.
16.0 Å, Fe lines
in the
9.5-12.0 Å range) as they were poorly fitted with both spectral codes.
Table 3 summarizes the spectral ranges excluded from the
fitting procedure.
|
RGS fluxed spectra are shown in Fig. 1 ordered approximately in
decreasing coronal activity (defined in this paper as the
average coronal temperature - see below). Ne X, O VIII, and Fe L-shell lines
dominate the RGS spectra. In contrast to the other RS CVn binaries in our sample, the Capella X-ray
spectrum is softer and dominated by bright Fe XVII and Fe XVIII lines as
previously observed (e.g., Brinkman et al. 2000; Canizares et al. 2000; Audard et al. 2001b; Behar et al. 2001; Mewe et al. 2001).
We provide the high-energy EPIC MOS2 spectra in Fig. 2,
except for Capella. The high quality of the spectra allows for the
determination of Mg, Si, S, Ar, Ca, and Fe or upper limits thereof.
Continuum emission is clearly detected in these bright X-ray sources, which
provides constraints for the determination of the emission measure distributions.
Although the X-ray spectra look similar (with the exception of Capella), each star
shows different strengths of line fluxes and their ratios. For example, the strong N VII Ly![]() line flux in UX Ari contrasts with that in, e.g.,
line flux in UX Ari contrasts with that in, e.g., ![]() And.
However, in the former star, no significant N VI He-like triplet
is detected, which points to an EM distribution dominated by
high temperatures. Indeed, the formation of the N VI He-like triplet is
constrained to a narrow range of (cool) temperatures (1.0-2.5 MK; e.g., Mewe et al. 1985).
In contrast, the triplet is detected in Capella's spectrum.
Note that the short wavelength range (5-10 Å) for the most active stars
HR 1099 and UX Ari show weaker lines compared to the
less active
And.
However, in the former star, no significant N VI He-like triplet
is detected, which points to an EM distribution dominated by
high temperatures. Indeed, the formation of the N VI He-like triplet is
constrained to a narrow range of (cool) temperatures (1.0-2.5 MK; e.g., Mewe et al. 1985).
In contrast, the triplet is detected in Capella's spectrum.
Note that the short wavelength range (5-10 Å) for the most active stars
HR 1099 and UX Ari show weaker lines compared to the
less active ![]() And and Capella. In this range, H-like and He-like lines of Si and Mg should dominate
together with transitions from highly ionized Fe. These elements have a
low first ionization potential, which suggests that their coronal abundances
are low. Also, the coronal temperature could be much lower than the maximum
formation temperatures of these emission lines, but this is unlikely
since the lines form at
And and Capella. In this range, H-like and He-like lines of Si and Mg should dominate
together with transitions from highly ionized Fe. These elements have a
low first ionization potential, which suggests that their coronal abundances
are low. Also, the coronal temperature could be much lower than the maximum
formation temperatures of these emission lines, but this is unlikely
since the lines form at ![]() 10 MK, close to the average temperature of
these coronae. In contrast, the 5-10 Å range in
10 MK, close to the average temperature of
these coronae. In contrast, the 5-10 Å range in
![]() And and Capella displays better developed emission lines, suggesting
higher abundances of low-FIP elements in these stellar coronae.
And and Capella displays better developed emission lines, suggesting
higher abundances of low-FIP elements in these stellar coronae.
Coronal abundances obtained from the multi-temperature fits in SPEX and XSPEC
are summarized in Table 4. As an example,
Fig. 3 shows best fits and residuals for UX Ari. We provide
reduced ![]() values, although we emphasize that current uncertainties in the instrument calibration,
in the atomic codes, and high signal-to-noise (S/N) ratios can produce
systematic errors that cannot be described by
values, although we emphasize that current uncertainties in the instrument calibration,
in the atomic codes, and high signal-to-noise (S/N) ratios can produce
systematic errors that cannot be described by ![]() .
This is especially the
case for Capella, for which its high S/N ratio produces
.
This is especially the
case for Capella, for which its high S/N ratio produces ![]() values
exceeding 4. Inspection of the fit by eye shows, however, good agreement between
the model fit and the data. The deviations are smaller than the typical uncertainties
on the atomic physics parameters (order of 10%).
Given the current uncertainties in the atomic parameters, our model description is
thus satisfactory. Statistical 90% confidence ranges are given for each
elemental abundance in Table 4. Since EM distributions are
continuous, a 4-T model only provides an approximate discrete representation.
Formal errors for T and EM are artificially underestimated, and are
therefore of little use in this context. We adopt conservative estimates of the
uncertainties for T as 10% of their values, whereas EM uncertainties
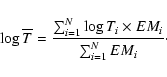
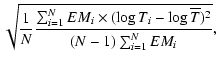
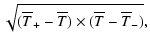
are estimated to 0.1 dex. To characterize the global temperature average of the
stellar corona, we hereafter assign an "average'' coronal temperature to
each star (given in Table 4), obtained from the sum of
logarithmic temperatures weighted by their EM,
values
exceeding 4. Inspection of the fit by eye shows, however, good agreement between
the model fit and the data. The deviations are smaller than the typical uncertainties
on the atomic physics parameters (order of 10%).
Given the current uncertainties in the atomic parameters, our model description is
thus satisfactory. Statistical 90% confidence ranges are given for each
elemental abundance in Table 4. Since EM distributions are
continuous, a 4-T model only provides an approximate discrete representation.
Formal errors for T and EM are artificially underestimated, and are
therefore of little use in this context. We adopt conservative estimates of the
uncertainties for T as 10% of their values, whereas EM uncertainties
are estimated to 0.1 dex. To characterize the global temperature average of the
stellar corona, we hereafter assign an "average'' coronal temperature to
each star (given in Table 4), obtained from the sum of
logarithmic temperatures weighted by their EM,
| |
= | (4) | |
| = | (5) |
![\begin{figure}
\par\includegraphics[width=16.1cm,clip]{MS3099f3a.eps}\\ [8.5mm]
\includegraphics[width=16.1cm,clip]{MS3099f3b.eps} \end{figure}](/articles/aa/full/2003/06/aa3099/img35.gif) |
Figure 3:
EPIC MOS2 (blue), RGS1 (red), and RGS2 (green) data of UX Ari with the 4-T best fits overlaid (thick black) for XSPEC/APEC (upper panel) and SPEX/MEKAL
(lower panel). Error bars are plotted for MOS only, for clarity.
Contributions to the |
Copyright ESO 2003
![\begin{figure}
\par\includegraphics[width=16.4cm,clip]{MS3099f1.eps} \end{figure}](/articles/aa/full/2003/06/aa3099/img21.gif)
![\begin{figure}
\par\resizebox{\hsize}{!}{%
\includegraphics[width=17cm]{MS3099f2.eps}} \end{figure}](/articles/aa/full/2003/06/aa3099/img24.gif)