Stellar activity in NGC 2264 has been studied most recently by Flaccomio et al. (2000)
through 6 different ROSAT HRI observations covering, in two different
pointings, a large fraction of the star forming cloud.
One hundred sixty nine
distinct sources
were detected,
![]() of which are estimated to be associated with members
of the association. One of the main problem at the time of this work was the
lack of good optical characterization of the members, so that, for example,
lacking individual measurements, extinction toward sources had to be assumed
uniform and placement of counterparts in the HR diagram was performed solely
from optical photometric data, an error-prone procedure for PMS stars. Moreover
the distinction between CTTS and WTTS was not well established, as indications
on the NIR excesses were not available and H
of which are estimated to be associated with members
of the association. One of the main problem at the time of this work was the
lack of good optical characterization of the members, so that, for example,
lacking individual measurements, extinction toward sources had to be assumed
uniform and placement of counterparts in the HR diagram was performed solely
from optical photometric data, an error-prone procedure for PMS stars. Moreover
the distinction between CTTS and WTTS was not well established, as indications
on the NIR excesses were not available and H
![]() measurements were in most
cases qualitative and non-uniform. Since that work new improved optical data
have been recently published by Rebull et al. (2002). We therefore updated the
previous analysis according to the general principles stated in the
introduction.
measurements were in most
cases qualitative and non-uniform. Since that work new improved optical data
have been recently published by Rebull et al. (2002). We therefore updated the
previous analysis according to the general principles stated in the
introduction.
We adopted optical data from Tables 1 and 3 of Rebull et al. (2002). Out of the full
list of 687 photometrically selected candidate members (i.e. the in cloud,
in locus population defined by Rebull et al. 2002) we selected the 202 stars for
which reliable spectral types and extinction (AV) estimates (through R and
I photometry + spectral types) were available. This latter is a subset of
the full spectroscopic sample studied by Rebull et al. (2002), initially selected
primarily from a list of I-band variable stars, with the addition of previously
known candidate members based on their X-ray or H
![]() emission or on their
proper motion. Our reference sample is therefore the intersection (logical and) of the photometrically selected member sample and of the spectroscopic
sample. While the former is arguably free from selection biases in favor of
faint CTTS, the degree of representativeness of the latter in this respect is
less clear: H
emission or on their
proper motion. Our reference sample is therefore the intersection (logical and) of the photometrically selected member sample and of the spectroscopic
sample. While the former is arguably free from selection biases in favor of
faint CTTS, the degree of representativeness of the latter in this respect is
less clear: H
![]() is however only a secondary selection criterion and
I-band variability (periodic in >50% of the stars), although maybe more
frequent in CTTS, does not obviously favor the inclusion of optically faint
stars. Moreover the disk (CTTS) fractions Rebull et al. (2002) derive for the
spectroscopic and the photometric sample (cf. their Table 6) are remarkably
similar, suggesting that the former is not strongly biased toward CTTS.
is however only a secondary selection criterion and
I-band variability (periodic in >50% of the stars), although maybe more
frequent in CTTS, does not obviously favor the inclusion of optically faint
stars. Moreover the disk (CTTS) fractions Rebull et al. (2002) derive for the
spectroscopic and the photometric sample (cf. their Table 6) are remarkably
similar, suggesting that the former is not strongly biased toward CTTS.
Contamination of our reference sample from field stars may on the other hand be
non negligible: according to preliminary proper motion data Rebull et al. (2002)
report that
![]() of their photometric candidates are actually
non-members. The spectroscopic sample, selected on the basis of PMS stellar
characteristics, is expected to be less contaminated, although an estimate
based on proper motion data is not provided. We recall (cf. Sect. 1) that field star contamination is expected to artificially
lower the activity levels of WTTS.
of their photometric candidates are actually
non-members. The spectroscopic sample, selected on the basis of PMS stellar
characteristics, is expected to be less contaminated, although an estimate
based on proper motion data is not provided. We recall (cf. Sect. 1) that field star contamination is expected to artificially
lower the activity levels of WTTS.
We place stars in our reference sample in the HR diagram. Effective
temperatures and bolometric corrections are estimated from spectral types and
Kenyon & Hartmann (1995) conversions![]() . We
then evaluate bolometric luminosities from I band magnitudes. Out of the 202
spectrally characterized candidate members, 193 fall within the Siess et al. (2000)
evolutionary model grid and have therefore been assigned a mass and an age.
. We
then evaluate bolometric luminosities from I band magnitudes. Out of the 202
spectrally characterized candidate members, 193 fall within the Siess et al. (2000)
evolutionary model grid and have therefore been assigned a mass and an age.
The reference sample used for our following analysis comprises the 178 stars, out of these 193 candidate members characterized in terms of mass and age, that fall in the field of view of the X-ray observations described by Flaccomio et al. (2000).
We matched the photometric catalog of Rebull et al. (2002), out of which our reference
member list is drawn, with the list of 169 X-ray sources published by
Flaccomio et al. (2000). The identifications were carried out as described in
Flaccomio et al. (2000), i.e. assuming as identification radii the the off-axis dependent
X-ray source position error summed in quadrature to 1
![]() ,
i.e. a
conservative estimate of the optical position error. Before performing the
final identification we first registered the coordinate systems of the optical
and X-ray lists by comparing the positions of 125 uniquely identified pairs
(RA
,
i.e. a
conservative estimate of the optical position error. Before performing the
final identification we first registered the coordinate systems of the optical
and X-ray lists by comparing the positions of 125 uniquely identified pairs
(RA
![]() ,
Dec
,
Dec
![]() ).
Sixty seven
stars in our reference sample were identified with an X-ray source, 56 of which
uniquely, while the the remaining 11 fell in the identification circle of an
X-ray source along with other objects in the photometric catalog. To each of
the 67 candidate members with X-ray counterparts we then assigned a Maximum
Likelihood (ML) X-ray count rate: these are values computed by Flaccomio et al. (2000) in
order to define a mean source brightness among 6 different observations.
Due to
source variability, five of these mean values are actually upper limits. The
count rates of the 11 ambiguous identifications were also treated as upper
limits and upper limits, computed as in Flaccomio et al. (2000), were also assigned to
111 X-ray undetected candidate members lying within the FOV of the HRI
observations.
).
Sixty seven
stars in our reference sample were identified with an X-ray source, 56 of which
uniquely, while the the remaining 11 fell in the identification circle of an
X-ray source along with other objects in the photometric catalog. To each of
the 67 candidate members with X-ray counterparts we then assigned a Maximum
Likelihood (ML) X-ray count rate: these are values computed by Flaccomio et al. (2000) in
order to define a mean source brightness among 6 different observations.
Due to
source variability, five of these mean values are actually upper limits. The
count rates of the 11 ambiguous identifications were also treated as upper
limits and upper limits, computed as in Flaccomio et al. (2000), were also assigned to
111 X-ray undetected candidate members lying within the FOV of the HRI
observations.
Finally we converted count-rates, measured and upper limits, to X-ray
luminosities in the 0.1-4.0 keV band![]() .
We assumed a thermal emission spectrum with kT=2.16 keV, close to recent
estimates for PMS stars (e.g. Flaccomio et al. 2002b; Imanishi et al. 2001; Getman et al. 2002). The hydrogen column
density was assumed proportional to the optical extinction measured
individually for each star:
.
We assumed a thermal emission spectrum with kT=2.16 keV, close to recent
estimates for PMS stars (e.g. Flaccomio et al. 2002b; Imanishi et al. 2001; Getman et al. 2002). The hydrogen column
density was assumed proportional to the optical extinction measured
individually for each star:
![]() .
The distance was assumed
to be 760 pc like in Flaccomio et al. (2000). Figure 4 compares the
.
The distance was assumed
to be 760 pc like in Flaccomio et al. (2000). Figure 4 compares the
![]() derived by Flaccomio et al. (2000) to those derived here from the same count-rates.
Our new estimates are
derived by Flaccomio et al. (2000) to those derived here from the same count-rates.
Our new estimates are
![]() dex higher respect to the old ones, with the
main differences due to the assumed kT (2.16 vs. 0.75 keV) and the increased
absorption (mean
dex higher respect to the old ones, with the
main differences due to the assumed kT (2.16 vs. 0.75 keV) and the increased
absorption (mean
![]() vs. a constant
AV=0.19) and a small
difference,
vs. a constant
AV=0.19) and a small
difference, ![]() 0.1 dex, due to the different spectral band in which
0.1 dex, due to the different spectral band in which
![]() is computed.
is computed.
![\begin{figure}
\par {\includegraphics[width=8cm,clip]{H3790F4.eps} }
\end{figure}](/articles/aa/full/2003/02/aah3790/img35.gif) |
Figure 4:
Comparison of X-ray luminosities computed by Flaccomio et al.
(2000) for NGC 2264 stars (see text) and those recomputed from
the same data in this work. No distinction is made here between detections
and upper limits. The solid line indicates the locus of equal values; the
dotted lines indicate the relation |
Figure 5 shows the scatter plots between ![]() and
stellar mass and
and
stellar mass and
![]() and mass, for the accreting and non-accreting
stars. Similarly to what seen in other SFRs,
and mass, for the accreting and non-accreting
stars. Similarly to what seen in other SFRs, ![]() is seen to correlate with
stellar mass, although the relation appears somewhat fuzzier in this case
respect to, e.g., the ONC or the Chamaeleon I cases (see below). A systematic
difference between the two classes is not readily apparent. However, given the
large number of upper limits a more quantitative analysis is needed. Figure
6 shows XLFs and
is seen to correlate with
stellar mass, although the relation appears somewhat fuzzier in this case
respect to, e.g., the ONC or the Chamaeleon I cases (see below). A systematic
difference between the two classes is not readily apparent. However, given the
large number of upper limits a more quantitative analysis is needed. Figure
6 shows XLFs and
![]() distributions for the two
H
distributions for the two
H
![]() separated stellar classes, in two different mass ranges, marked in
Fig. 5 by vertical lines, and for the whole sample. In
all cases the distributions of accreting stars appear to lie below those for
non-accreting ones. Statistical test (in the ASURV package) confirm such
differences with varying degree of confidence (results of the tests are given
in the figure, along with the number of detection and upper limits that enter
in the distributions; the same information is repeated in the first part of
Table 1, where the results of other tests described below
are also reported). Particularly significant is the difference in
separated stellar classes, in two different mass ranges, marked in
Fig. 5 by vertical lines, and for the whole sample. In
all cases the distributions of accreting stars appear to lie below those for
non-accreting ones. Statistical test (in the ASURV package) confirm such
differences with varying degree of confidence (results of the tests are given
in the figure, along with the number of detection and upper limits that enter
in the distributions; the same information is repeated in the first part of
Table 1, where the results of other tests described below
are also reported). Particularly significant is the difference in ![]() for the
whole sample (
for the
whole sample (
![]() ). Such a difference might however result from a
larger fraction of low mass, and low
). Such a difference might however result from a
larger fraction of low mass, and low ![]() ,
accreting stars (see Fig. 5). In the two narrower mass ranges, the result is
however retrieved, with greater than
,
accreting stars (see Fig. 5). In the two narrower mass ranges, the result is
however retrieved, with greater than ![]() confidence in the
confidence in the
![]() mass range. The difference is also observed in
mass range. The difference is also observed in
![]() .
Note that, as pointed out above, our reference sample may be significantly
contaminated by field stars, and this would tend to depress the non-accreting
stars distributions, thus lowering the significance of the result. If we repeat
the same analysis including only stars confirmed as members by their IR excess
(
.
Note that, as pointed out above, our reference sample may be significantly
contaminated by field stars, and this would tend to depress the non-accreting
stars distributions, thus lowering the significance of the result. If we repeat
the same analysis including only stars confirmed as members by their IR excess
(
![]() or
or
![]() ), H
), H
![]() emission (EW > 5)
and X-ray detection, we indeed find even more significant differences.
Particularly interesting are the differences in
emission (EW > 5)
and X-ray detection, we indeed find even more significant differences.
Particularly interesting are the differences in
![]() ,
because they are
less likely to be influenced by selection effects, a concern for this latter
restricted sample. Table 1 reports the results of these
tests.
,
because they are
less likely to be influenced by selection effects, a concern for this latter
restricted sample. Table 1 reports the results of these
tests.
Table 1 also reports the results of the comparisons between
the stars with and without near IR excess, for the same mass ranges and the two
stellar samples described above. The same results is retrieved: stars showing
a
![]() excess, indicating the presence of a disk, have lower activity
levels respect to the complementary sample.
excess, indicating the presence of a disk, have lower activity
levels respect to the complementary sample.
| Mass |
|
|
|
|
|
|
|
|
||||||
| 0.5-1.0 | 5 | 16 | 18 | 14 | 3.0/3.4 | 2.5/2.8 |
| 1.0-2.0 | 5 | 14 | 13 | 10 | 1.4/1.9 | 1.1/2.1 |
| All | 18 | 79 | 33 | 44 | >3.9 | 1.5/2.1 |
|
|
||||||
| 0.5-1.0 | 5 | 16 | 18 | 2 | >3.9 | 3.2/>3.9 |
| 1.0-2.0 | 5 | 14 | 13 | 1 | 2.1/2.7 | 1.9/ 3.1 |
| All | 18 | 79 | 33 | 7 | >3.9 | 3.3/>3.9 |
|
|
||||||
| 0.5-1.0 | 1 | 9 | 18 | 20 | 1.3/1.8 | 2.2/3.2 |
| 1.0-2.0 | 1 | 10 | 14 | 11 | 1.9/2.2 | 2.1/2.5 |
| All | 4 | 30 | 40 | 71 | 2.2/2.4 | 2.6/3.2 |
|
|
||||||
| 0.5-1.0 | 1 | 9 | 18 | 9 | 1.8/2.3 | 2.6/ 3.5 |
| 1.0-2.0 | 1 | 10 | 14 | 2 | 2.4/2.8 | 2.9/ 3.4 |
| All | 4 | 30 | 40 | 44 | 2.8/ 3.0 | 3.4/>3.9 |
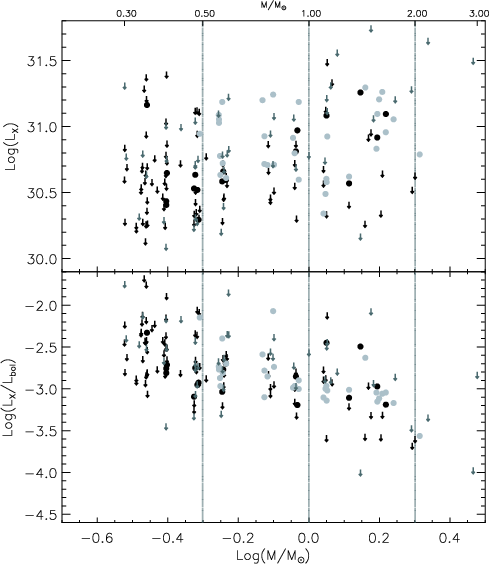 |
Figure 5:
|
![\begin{figure}
\par\includegraphics[width=12.7cm,clip]{H3790F6.eps}
\end{figure}](/articles/aa/full/2003/02/aah3790/img55.gif) |
Figure 6:
Distributions of |
Copyright ESO 2003