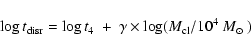
The data in Fig. 10 and the detailed study of this
distribution by Boutloukos & Lamers (2002) show that the clusters
in the inner spiral arms of M 51
disrupt on a time scale of about tens of Myrs.
In fact, these authors derived the dependence of the disruption time on
the initial mass of the clusters in the inner spiral arms of M 51 as
Figure 11
shows the resulting mass distribution of clusters with an age less
or equal to 10 Myr for two samples of clusters.
The first sample contains all 354 clusters younger than 10 Myr.
The second sample contains 168 clusters in the same age range
but with a mass determination of
![]() .
Both samples show the same characteristics:
a steep increase in number between
.
Both samples show the same characteristics:
a steep increase in number between
![]() and a slow
decrease to higher masses. The steep increase is due to the detection
limit or the disruption of the low mass clusters. The slow decrease
reflects the cluster initial mass function (CIMF).
The decrease indicates that the clusters are formed with an CIMF
that has a negative slope of
and a slow
decrease to higher masses. The steep increase is due to the detection
limit or the disruption of the low mass clusters. The slow decrease
reflects the cluster initial mass function (CIMF).
The decrease indicates that the clusters are formed with an CIMF
that has a negative slope of
![]() ,
as expected.
,
as expected.
If the CIMF can be written as a power law of the type
| Sample | Nr |
|
|
| All | 149 | 3.49 | 2.12 |
|
|
66 | 3.48 | 2.04 |
|
|
82 | 3.46 | 2.16 |
![\begin{figure}
\par\includegraphics[width=8.8cm,clip]{h3780f12.ps}\end{figure}](/articles/aa/full/2003/02/aah3780/img180.gif) |
Figure 12:
The cumulative mass distribution of 149 clusters with an
age less than 10 Myrs and an inital mass of
|
The predicted cumulative distribution with the derived values of
![]() and
and
![]() is shown in Fig. 12 (full line).
The figure shows a slight underabundance of clusters in the range of
is shown in Fig. 12 (full line).
The figure shows a slight underabundance of clusters in the range of
![]() and a slight overabundance in the range of
and a slight overabundance in the range of
![]() .
In fact, for the mass range of
.
In fact, for the mass range of
![]() a fit with
a fit with
![]() ,
shown by dashed lines, fits the
distribution excellently.
We conclude that the CIMF of clusters younger than 10 Myr
has a slope of
,
shown by dashed lines, fits the
distribution excellently.
We conclude that the CIMF of clusters younger than 10 Myr
has a slope of
![]() in the mass range of
in the mass range of
![]() and a slope of
and a slope of
![]() in the range of
in the range of
![]() .
.
The derived exponent of the cluster IMF is
very similar to the value of
![]() of young
clusters in the Antennae galaxies, as found by
Zhang & Fall (1999). It shows that the IMF of clusters formed
in the process of galaxy-galaxy interaction is very similar
to the one of clusters formed in the spiral arms of a galaxy,
long after the interaction.
This mass distribution is also similar to that of
giant molecular clouds (e.g. McKee 1999; Myers 1999). This may support
the suggestion that the mass distribution of the clusters is
determined by the mass distribution of the clouds from which they originate.
of young
clusters in the Antennae galaxies, as found by
Zhang & Fall (1999). It shows that the IMF of clusters formed
in the process of galaxy-galaxy interaction is very similar
to the one of clusters formed in the spiral arms of a galaxy,
long after the interaction.
This mass distribution is also similar to that of
giant molecular clouds (e.g. McKee 1999; Myers 1999). This may support
the suggestion that the mass distribution of the clusters is
determined by the mass distribution of the clouds from which they originate.
Copyright ESO 2003
![\begin{figure}
\includegraphics[width=8.8cm,clip]{h3780f11.ps}\end{figure}](/articles/aa/full/2003/02/aah3780/img162.gif)