To compare the results for dust abundance and dust composition in the CSM of SN 1987A with expectations for the CSM prior to the supernova event, account must be taken of the grain destruction processes due to the supernova and its remnant.
Before quantitatively discussing grain evaporation (Sect. 4.1) and grain sputtering
(Sect. 4.2) we briefly
demonstrate that the grains are dynamically coupled to the gas due to the betatron effect.
For example the potential of a graphite grain with
![]() at a temperature of
at a temperature of
![]() is more than 30 Volt (Draine & Salpeter 1979a).
The larmor radius of the grain is given by
is more than 30 Volt (Draine & Salpeter 1979a).
The larmor radius of the grain is given by
![]() ,
where
,
where
![]() is
the mass of the grain,
is
the mass of the grain,
![]() the relative velocity of the grain to the gas (initially
the relative velocity of the grain to the gas (initially
![]() ),
),
![]() the grain charge and B the magnetic field.
For B we adopt the value for equipartion between magnetic field
and relativistic particles (Longair 1997), calculated from an extrapolation
of the synchrotron emission after 1200 days (Gaensler et al. 1997).
Assuming the radio emission to arise
from the same volume as the X-ray emission (see Appendix A),
this yields
the grain charge and B the magnetic field.
For B we adopt the value for equipartion between magnetic field
and relativistic particles (Longair 1997), calculated from an extrapolation
of the synchrotron emission after 1200 days (Gaensler et al. 1997).
Assuming the radio emission to arise
from the same volume as the X-ray emission (see Appendix A),
this yields
![]() T,
in agreement with the value found by Ball & Kirk (1992).
Taking the shock velocity to be
T,
in agreement with the value found by Ball & Kirk (1992).
Taking the shock velocity to be
![]() ,
as derived from radio observations
(Gaensler et al. 1997), the larmor radius
,
as derived from radio observations
(Gaensler et al. 1997), the larmor radius ![]() is then of the order of
is then of the order of
![]() ,
which is less then
,
which is less then ![]() 10-4of the diameter of the radio emission region.
By comparison, the distance of the outer blast wave to the
contact discontinuity increases with
10-4of the diameter of the radio emission region.
By comparison, the distance of the outer blast wave to the
contact discontinuity increases with ![]()
![]() (Chevalier 1982). Thus, the grains comoved with the
gas after roughly one month.
(Chevalier 1982). Thus, the grains comoved with the
gas after roughly one month.
To discuss the mass loss due to evaporation and sputtering we assumed, as in our earlier
examination of the IR emission,
that the grains in the CSM at the time of the supernova explosion
had a grain size distribution with k=3.5.
Again we choose as minimum grain size
![]() Å.
Å.
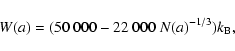
The evaporation of grains in the neighbourhood of a supernova in general has already been the subject of earlier examinations (e.g. Draine & Salpeter 1979b; Draine 1981; Pearce & Mayes 1986) and also has been discussed for silicate grains for the SN 1987A (Emmering & Chevalier 1989; Timmermann & Larson 1993). All considered the effect of evaporation for single grain sizes only. Here we are interested in the mass loss of grains with a certain size distribution in the shocked plasma behind the outer shock front. We use more recent theoretical results for the spectrum, duration and luminosity of the UV flash (Ensman & Burrows 1992). Apart from silicate we also consider iron and graphite grains.
As a reasonable assumption, we only consider the evaporation of grains during this UV-flash, when the grains reached their highest temperatures. For the luminosity, temperature, and duration of the UV-flash we take the theoretical results of the model 500full1 from Ensman & Burrows (1992). For our calculation, the spectrum is taken to be a simple black body spectrum with the given colour temperature from Ensman & Burrows normalised to the luminosity.
To simplify the
derivation of the mass loss of grains during the UV-flash,
we neglect the effect of stochastic heating
and assume that all grains are at their equilibrium temperatures.
The evaporation of atoms from the surface of a grain with temperature ![]() leads to a
reduction in radius, that can be described by
leads to a
reduction in radius, that can be described by
 |
(4) |
The total reduction
![]() of a grain with an initial radius a during the UV-flash
after a time t is found by integrating Eq. (3). If the final radius
of a grain with an initial radius a during the UV-flash
after a time t is found by integrating Eq. (3). If the final radius
![]() is smaller than 3 Å, the grain is assumed to have evaporated. The final grain size distribution
of non evaporated grains assumed to have an initial size distribution
is smaller than 3 Å, the grain is assumed to have evaporated. The final grain size distribution
of non evaporated grains assumed to have an initial size distribution
![]() with constant A given by:
with constant A given by:
| = | |||
| = |  |
(5) |
How much silicate, iron and graphite dust might have survived the UV-flash in a certain distance
to the supernova is shown in Fig. 6 for three different maximum grain sizes
(0.25, 0.1 and
![]() ).
It can be seen that silicate grains evaporate out to larger distances from
the supernova than graphite grains. This is partly due to the higher bounding energy of graphite grains
but mainly caused by the much higher temperatures the silicate grains attain in comparison with graphite grains.
This is the opposite of the situation for collisionally heated dust in the CSM.
).
It can be seen that silicate grains evaporate out to larger distances from
the supernova than graphite grains. This is partly due to the higher bounding energy of graphite grains
but mainly caused by the much higher temperatures the silicate grains attain in comparison with graphite grains.
This is the opposite of the situation for collisionally heated dust in the CSM.
![\begin{figure}
\par\includegraphics[width=8.8cm,clip]{ms2642f9.eps}
\end{figure}](/articles/aa/full/2002/43/aa2642/img170.gif) |
Figure 6:
Survived grain mass of graphite,
silicate and iron grains after the UV-flash versus distance r from the supernova.
It is assumed, that the
grain size distribution before the supernova outburst had
k=3.5.
|
The grains most probably responsible for the measured infrared fluxes originated from
between the original inner boundary of the HII-region and the position
of the blast wave 4000 days after outburst.
The mass loss of iron and silicate
grains in this region is comparable and significant even for the largest considered
grain size of
![]() .
This changes at larger distances from the supernova,
where evaporation of predominantly small iron grains becomes much stronger.
For graphite grains evaporation is unimportant for the whole HII-region.
.
This changes at larger distances from the supernova,
where evaporation of predominantly small iron grains becomes much stronger.
For graphite grains evaporation is unimportant for the whole HII-region.
The radially integrated evaporated dust masses of silicate, graphite and iron grains corresponding to the shown curves is given in Table 3. In the integration it is assumed that the shock surface area is proportional to the square of the distance r of the blast wave to the position of the supernova. The differences in the derived values for the two models are due to the different shock velocities, that give slightly different positions of the inner boundary and the outer shock.
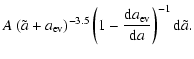
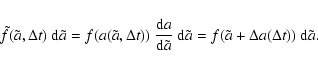
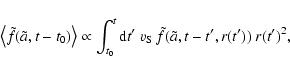
Behind the blast wave grains undergo sputtering. This is thought to be one of the most important destruction processes in fast moving shocks (see e.g. Dwek et al. 1996). Sputtering time scales appropriate for a plasma with the abundances of the shocked CSM of SN 1987A are given in Appendix B.
The final grain size distribution after a time ![]() of an initial grain
size distribution
of an initial grain
size distribution
![]() due to sputtering in a hot plasma is given by:
due to sputtering in a hot plasma is given by:
 |
(6) |
 |
(7) |
The derived mass losses for the considered dust compositions and the three different
maximum grain sizes are tabulated in Table 3. For comparison, we derived
the sputtered dust mass with and without previous evaporation.
|
|
|
|
|||||
|
|
0.25 | 0.10 | 0.06 | 0.25 | 0.10 | 0.06 | |
|
|
sil. | 27.7% | 41.1% | 50.3% | 44.0% | 61.7% | 71.9% |
|
|
sil. | 49.4% | 80.4% | 98.3% | 48.7% | 79.2% | 98.9% |
|
|
iron | 27.2% | 40.4% | 49.5% | 40.9% | 58.1% | 68.4% |
|
|
iron | 48.0% | 78.6% | 99.8% | 47.7% | 78.1% | 100.% |
|
|
sil. | 53.1% | 82.4% | 98.4% | 58.4% | 85.1% | 99.1% |
|
|
iron | 51.8% | 81.0% | 99.8% | 56.4% | 83.6% | 100% |
|
|
gra.c | 11.3% | 17.3% | 22.0% | 19.1% | 29.0% | 36.3% |
Copyright ESO 2002
![\begin{displaymath}\frac{{\rm d}a[\mu{{\rm m}}]}{{\rm d}t[{\rm s}]}\sim \frac{1}{3}~10^{11}
{\rm e}^{-W(a)/k_{{\rm B}}T_{\rm d}(a)},
\end{displaymath}](/articles/aa/full/2002/43/aa2642/img154.gif)
![\begin{figure}
\par\includegraphics[width=7cm,clip]{ms2642f7.eps}\hspace*{4mm}\includegraphics[width=7cm,clip]{ms2642f8.eps}
\end{figure}](/articles/aa/full/2002/43/aa2642/img160.gif)