We have shown here that the power spectrum
of high latitude fields at 60 and 100 ![]() m is characterized by a
break at small scales (near 0.02 arcmin-1).
As indicated by Gautier et al. (1992), the power spectrum of the dust emission
is usually well described by a power law proportional to
m is characterized by a
break at small scales (near 0.02 arcmin-1).
As indicated by Gautier et al. (1992), the power spectrum of the dust emission
is usually well described by a power law proportional to
![]() .
A more detailed study of the statistical properties of the
interstellar cirrus HI 21 cm emission has been carried out by Miville-Deschênes (1999).
In this analysis it is shown that
there are limited variations of the spectral index of the power law
from field to field but, what is most important for the present work,
the power spectrum of cirrus emission for scales smaller
than
.
A more detailed study of the statistical properties of the
interstellar cirrus HI 21 cm emission has been carried out by Miville-Deschênes (1999).
In this analysis it is shown that
there are limited variations of the spectral index of the power law
from field to field but, what is most important for the present work,
the power spectrum of cirrus emission for scales smaller
than
![]() is always characterized by a single power law
with no break. Therefore, it is unlikely that the power excess
observed here at small scales is of interstellar origin.
is always characterized by a single power law
with no break. Therefore, it is unlikely that the power excess
observed here at small scales is of interstellar origin.
We could also wonder if this break is of instrumental origin. It was shown by Wheelock et al. (1993) that the response of the IRAS detectors are affected by memory effects. This produces variations of the detector response as a function of scale. This effect is more important at small scales (under a few tens of arcminutes) but Wheelock et al. (1993) have shown that the amplitude of the fluctuations at these scales were underestimated. This effect will thus produce a drop of the power spectrum at small scale and cannot explain the power excess observed here.
On the other hand, instrumental noise could produce such an excess in the power spectrum. But, as the IRAS ISSA maps result from redundant individual observations, we were able to estimate the contribution of the noise to the power spectrum. We are aware that our estimate of the noise rely on the fact that the individual HCONs are independant. This is not perfectly true as, in the construction of the HCONs, an offset was added to each scan to minimize the difference between different observations of the same position. Therefore the noise level estimated by subtracting HCONs may be underestimated at the scale of a scan, which is a few degrees. But at this angular scale the signal is completely dominated by the cirrus emission, even in the low brightness regions selected for our analysis. At the scale of a few arcminutes where the CIB is detected, the noise contribution to the power spectrum has been removed accurately.
![\begin{figure}
\par\includegraphics[width=18cm,clip]{H3453F5.ps}
\end{figure}](/articles/aa/full/2002/39/aah3453/img51.gif) |
Figure 4:
Redshift distribution of the sources
making the CIB and the fluctuations at 60, 100 and 170 |
In fact it appears that most of the power excess can be attributed to the
numerous extra-galactic point sources that are present in such a low
cirrus emission field. When the strong (
![]() Jy) point sources are removed from the
ISSA maps, we recover a power spectrum typical of cirrus emission
at low spatial frequencies but with
still a power excess at small scales (k > 0.02 arcmin-1) that can be attributed
to the unresolved cosmic infrared background.
Moreover, the residue has homogeneous properties over the sky,
consistent with CIB.
Jy) point sources are removed from the
ISSA maps, we recover a power spectrum typical of cirrus emission
at low spatial frequencies but with
still a power excess at small scales (k > 0.02 arcmin-1) that can be attributed
to the unresolved cosmic infrared background.
Moreover, the residue has homogeneous properties over the sky,
consistent with CIB.
Knox et al. (2001) computed the expected power spectrum of the CIB at several
frequencies (
![]() GHz), exploiting the far-IR volume emissivity derived from the
count models of Guiderdoni et al. (1998) and assuming a bias b=3, constant with
redshift. They concluded that the clustering-induced fluctuations
can match those of the CMB at
GHz), exploiting the far-IR volume emissivity derived from the
count models of Guiderdoni et al. (1998) and assuming a bias b=3, constant with
redshift. They concluded that the clustering-induced fluctuations
can match those of the CMB at
![]() .
They also predict a shape of the CIB power spectrum peaking
around scales of 1-3 degrees. This broad maximum, if present, is at the limit of our frequency range
where the noise is becoming large,
making the detection of the clustering very difficult.
The power spectra of the CIB at 60 and 100
.
They also predict a shape of the CIB power spectrum peaking
around scales of 1-3 degrees. This broad maximum, if present, is at the limit of our frequency range
where the noise is becoming large,
making the detection of the clustering very difficult.
The power spectra of the CIB at 60 and 100 ![]() m are compatible with a
Poissonian distribution with levels
m are compatible with a
Poissonian distribution with levels ![]()
![]() Jy2/sr and
Jy2/sr and
![]()
![]() Jy2/sr respectively.
Jy2/sr respectively.
The CIB rms fluctuations in the IRAS maps
corresponding to the white noise power spectra are:
 |
(7) |
This is illustrated more quantitatively in Fig. 4
on the panels showing the redshift distribution of sources
contributing to the CIB intensity and the fluctuations (Lagache et al. 2002).
It is clear from these figures that the z-distribution of the fluctuations
is bimodal, with one contribution at redshift lower than 0.25
and the other one centered at redshift around 1.
For all sources the ratio of nearby to moderate-redshift
source contribution to the fluctuations is equal to
3.8, 1.8 and 1.3 at 60, 100, 170 ![]() m
respectively, illustrating that fluctuations at larger wavelengths
are dominated by more distant sources.
When the brightest sources are removed the ratio
of nearby to moderate-redshift
contribution becomes equal to 1.7, 1 and 0.74
at 60, 100, 170
m
respectively, illustrating that fluctuations at larger wavelengths
are dominated by more distant sources.
When the brightest sources are removed the ratio
of nearby to moderate-redshift
contribution becomes equal to 1.7, 1 and 0.74
at 60, 100, 170 ![]() m. In this case, at 100
m. In this case, at 100 ![]() m
the contribution to the fluctuations
of nearby and moderate-redshift sources
is the same, becoming lower at higher wavelength.
At 60
m
the contribution to the fluctuations
of nearby and moderate-redshift sources
is the same, becoming lower at higher wavelength.
At 60 ![]() m, the fluctuations are still dominated by
the nearby objects.
m, the fluctuations are still dominated by
the nearby objects.
For the three wavelengths, the CIB is mainly due to sources
at redshift around 1. A detailed analysis of
the CIB fluctuations at 100 and 170 ![]() m (which is beyond the scope of this paper)
will give information on the distribution of sources at
m (which is beyond the scope of this paper)
will give information on the distribution of sources at ![]() making
the bulk of the CIB.
This is particularly true at 170
making
the bulk of the CIB.
This is particularly true at 170 ![]() m
where sources with flux lower than 4
m
where sources with flux lower than 4
![]() mJy
can be removed (Dole et al. 2001), leading fluctuations highly
dominated by the moderate-z sources.
mJy
can be removed (Dole et al. 2001), leading fluctuations highly
dominated by the moderate-z sources.
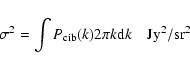
We can compute the ratio of CIB fluctuations to intensity
(
![]() )
at 100
)
at 100 ![]() m and compare it with the previous determination at 170
m and compare it with the previous determination at 170 ![]() m.
To compute R100 and R170, we use:
m.
To compute R100 and R170, we use:
This work suggests that the high latitude IRAS maps, in the lowest cirrus regions,
cannot be used as a tracer of the interstellar extinction structure as proposed
by (Schlegel et al. 1998). In fact it should be noted that it is only above
an intensity of order of 10 MJy/sr at 100 ![]() m that the CIB fluctuations
are lower than the cirrus contribution at the smallest scales (
m that the CIB fluctuations
are lower than the cirrus contribution at the smallest scales (
![]() arcmin-1).
arcmin-1).
Present and future CMB observations, above 100 GHz, with high sensitivity bolometers
need to remove foreground contributions (cirrus and CIB fluctuations). The CIB spectrum
being significantly "colder'' than the cirrus spectrum (
![]() ;
;
![]() ), the relative contribution
of the CIB will increase with wavelength. It is thus expected that at 1 mm
the range in l space dominated by the CIB will be much more extended than sees at
100
), the relative contribution
of the CIB will increase with wavelength. It is thus expected that at 1 mm
the range in l space dominated by the CIB will be much more extended than sees at
100 ![]() m. This question will be dealt in a forthcoming paper.
m. This question will be dealt in a forthcoming paper.
Acknowledgements
The Fond FCAR du Québec provided funds to support this research project.
Copyright ESO 2002