The method adopted for
![]() determination is the computation of
the first zero of Fourier transform (FT) of line profiles
(Carroll 1933; Ramella et al. 1989). For further description of the method applied
to our sample, see Paper I.
The different observed spectral range induces some changes,
which are detailed below.
determination is the computation of
the first zero of Fourier transform (FT) of line profiles
(Carroll 1933; Ramella et al. 1989). For further description of the method applied
to our sample, see Paper I.
The different observed spectral range induces some changes,
which are detailed below.
The normalization of the spectra was performed using MIDAS: the continuum has been determined
visually, passing through noise fluctuations. The procedure is much
like the normalization carried out in Paper I, except for a different spectral window.
For the ranges ![]() and
and ![]() ,
the influence of the
Balmer lines is important, and their wings act as non negligible
contributions to the difference between true and pseudo-continuum, over
the major part of the spectral domain, as shown in Paper I.
On the other hand, the
,
the influence of the
Balmer lines is important, and their wings act as non negligible
contributions to the difference between true and pseudo-continuum, over
the major part of the spectral domain, as shown in Paper I.
On the other hand, the ![]() range is farther from H
range is farther from H![]() .
In order to quantify the alteration of continuum due to Balmer lines
wings and blends of spectral lines, a grid of synthetic spectra of
different effective temperatures (10 000, 9200, 8500 and 7500 K) and
different rotational broadenings, computed from Kurucz' model
atmosphere (Kurucz 1993), is used to calculate the differences between
the true continuum and the pseudo-continuum. The pseudo-continuum is
represented as the highest points in the spectra. The differences
are listed in Table 1, for different spectral 20 Å
wide sub-ranges. This table is a continuation of the similar one in
Paper I, considering the spectral range 4200-4500 Å.
.
In order to quantify the alteration of continuum due to Balmer lines
wings and blends of spectral lines, a grid of synthetic spectra of
different effective temperatures (10 000, 9200, 8500 and 7500 K) and
different rotational broadenings, computed from Kurucz' model
atmosphere (Kurucz 1993), is used to calculate the differences between
the true continuum and the pseudo-continuum. The pseudo-continuum is
represented as the highest points in the spectra. The differences
are listed in Table 1, for different spectral 20 Å
wide sub-ranges. This table is a continuation of the similar one in
Paper I, considering the spectral range 4200-4500 Å.
|
|
central wavelength (Å) | |||||
| (K,
|
4510 | 4530 | 4550 | 4570 | 4590 | |
| Data for wavelengths shorter than 4500 Å | ||||||
| are given in Table 1 of Paper I | ||||||
| 10 000, | 10 | 0.0005 | 0.0003 | 0.0002 | 0.0000 | 0.0000 |
| 10 000, | 50 | 0.0008 | 0.0003 | 0.0003 | 0.0002 | 0.0003 |
| 10 000, | 100 | 0.0011 | 0.0005 | 0.0016 | 0.0005 | 0.0013 |
9200, |
10 | 0.0010 | 0.0006 | 0.0006 | 0.0006 | 0.0006 |
| 9200, | 50 | 0.0017 | 0.0008 | 0.0010 | 0.0012 | 0.0012 |
| 9200, | 100 | 0.0023 | 0.0012 | 0.0027 | 0.0012 | 0.0051 |
8500, |
10 | 0.0017 | 0.0012 | 0.0010 | 0.0010 | 0.0010 |
| 8500, | 50 | 0.0030 | 0.0020 | 0.0022 | 0.0025 | 0.0020 |
| 8500, | 100 | 0.0042 | 0.0027 | 0.0062 | 0.0030 | 0.0093 |
7500, |
10 | 0.0005 | 0.0005 | 0.0005 | 0.0005 | 0.0005 |
| 7500, | 50 | 0.0032 | 0.0023 | 0.0036 | 0.0045 | 0.0032 |
| 7500, | 100 | 0.0059 | 0.0050 | 0.0149 | 0.0059 | 0.0181 |
Put end to end, the spectra acquired with AURÉLIE cover a spectral
range of almost 500 Å. It includes that observed with ECHELEC in
Paper I. The choice of the lines for the determination of the
![]() in Paper I is thus still valid here. Moreover, in addition to this
selection, redder lines were adopted in order to benefit from the
larger spectral coverage.
in Paper I is thus still valid here. Moreover, in addition to this
selection, redder lines were adopted in order to benefit from the
larger spectral coverage.
The complete list of the 23 lines that are candidate for
![]() determination is given in Table 2.
determination is given in Table 2.
| range | wavelength | element | range |
| 4215.519 | Sr II | ||
| 4219.360 | Fe I | ||
| 4226.728 | Ca I | ||
| 4227.426 | Fe I | ||
| 4235.936 | Fe I | ||
| 4242.364 | Cr II | ||
| 4261.913 | Cr II | ||
| 4404.750 | Fe I | ||
| 4415.122 | Fe I | ||
| 4466.551 | Fe I | ||
| 4468.507 | Ti II | ||
| 4481 .126 .325 | Mg II |
||
| 4488.331 | Ti II | ||
| 4489.183 | Fe II | ||
| 4491.405 | Fe II | ||
| 4501.273 | Ti II | ||
| 4508.288 | Fe II | ||
| 4515.339 | Fe II | ||
| 4520.224 | Fe II | ||
| 4522.634 | Fe II | ||
| 4563.761 | Ti II | ||
| 4571.968 | Ti II | ||
| 4576.340 | Fe II |
![]() Wavelength of both components are indicated for the magnesium doublet line.
Wavelength of both components are indicated for the magnesium doublet line.
In order to quantify effects of blends in the selected lines for later
spectral types, we use the skewness of synthetic line profiles, as in
Paper I. The same grid of synthetic spectra computed using Kurucz'
model (Kurucz 1993), is used. Skewness is defined as
![]() ,
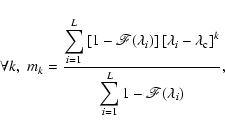
where mk is moment of kth order equal to
,
where mk is moment of kth order equal to
|
|
|
||||
| line | (
|
10 000 | 9200 | 8500 | 7500 |
| Data for wavelengths shorter than 4500 Å | |||||
| are given in Table 3 of Paper I | |||||
| Ti II 4501 | 10 | -0.05 | -0.06 | -0.07 | -0.12 |
| 50 | -0.02 | -0.03 | -0.04 | -0.04 | |
| 100 | -0.03 | -0.04 | -0.05 | -0.07 | |
| Fe II 4508 | 10 | 0.01 | 0.01 | 0.01 | 0.02 |
| 50 | -0.00 | -0.00 | -0.00 | -0.00 | |
| 100 | -0.01 | -0.02 | -0.03 | -0.05 | |
| Fe II 4515 | 10 | 0.00 | -0.00 | -0.01 | -0.06 |
| 50 | 0.02 | 0.02 | 0.01 | -0.04 | |
| 100 | 0.01 | 0.01 | 0.02 | 0.03 | |
| Fe II 4520 | 10 | 0.01 | 0.01 | 0.01 | -0.01 |
| 50 | 0.00 | 0.00 | -0.00 | -0.01 | |
| 100 | -0.17 | -0.19 | -0.23 | -0.30 | |
| Fe II 4523 | 10 | -0.06 | -0.06 | -0.06 | -0.05 |
| 50 | -0.01 | -0.01 | -0.01 | 0.01 | |
| 100 | -0.12 | -0.09 | -0.01 | 0.08 | |
| Ti II 4564 | 10 | 0.04 | 0.04 | 0.05 | 0.06 |
| 50 | 0.01 | 0.02 | 0.04 | 0.06 | |
| 100 | 0.03 | 0.04 | 0.08 | 0.16 | |
| Ti II 4572 | 10 | -0.00 | -0.00 | -0.01 | -0.02 |
| 50 | 0.01 | 0.00 | -0.01 | -0.09 | |
| 100 | 0.01 | 0.01 | -0.00 | -0.04 | |
| Fe II 4576 | 10 | 0.01 | 0.01 | 0.02 | 0.05 |
| 50 | 0.00 | 0.00 | 0.01 | 0.01 | |
| 100 | 0.01 | 0.02 | 0.04 | 0.07 | |
![\begin{figure}
\includegraphics[width=8.8cm,clip]{MS2413f4} \end{figure}](/articles/aa/full/2002/39/aa2413/img46.gif) |
Figure 4: Simulation of the doublet width behavior: FWHM of the sum of two Gaussian lines (separated with 0.2 Å) as a function of the FWHM of the components. |
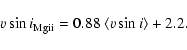
The comparison between the rotational velocity derived from the weak
lines and the one derived from the magnesium doublet was already
approached in Paper I. It is here of an increased importance since the
Mg II line is not present in all spectra (i.e. ![]() and
and ![]() spectral ranges). Figure 3 shows
this comparison between
spectral ranges). Figure 3 shows
this comparison between
![]() and
and
![]() using AURÉLIE data. The deviation from the
one-to-one relation (solid line) in the low velocity part of the diagram
is due to the intrinsic width of the doublet. This deviation is
simulated by representing the Mg II doublet as the sum of two
identical Gaussians separated by 0.2 Å. The full-width at half
maximum (FWHM) of the simulated doublet line is plotted in
Fig. 4 versus the FWHM of its single-lined components.
The relation clearly deviates from the one-to-one relation for single
line FWHM lower than 0.6 Å. Using the rule of thumb from Slettebak et al. (1975, hereafter SCBWP):
using AURÉLIE data. The deviation from the
one-to-one relation (solid line) in the low velocity part of the diagram
is due to the intrinsic width of the doublet. This deviation is
simulated by representing the Mg II doublet as the sum of two
identical Gaussians separated by 0.2 Å. The full-width at half
maximum (FWHM) of the simulated doublet line is plotted in
Fig. 4 versus the FWHM of its single-lined components.
The relation clearly deviates from the one-to-one relation for single
line FWHM lower than 0.6 Å. Using the rule of thumb from Slettebak et al. (1975, hereafter SCBWP):
![]() ,
this value corresponds to
,
this value corresponds to
![]()
![]() .
This limit coincides with what is observed in
Fig. 3. For higher velocities
(
.
This limit coincides with what is observed in
Fig. 3. For higher velocities
(
![]()
![]() ),
),
![]() becomes
larger than
becomes
larger than
![]() .
A linear regression
gives:
.
A linear regression
gives:
The number of measurable lines among the 23 listed in
Table 2 varies from one spectrum to another according
to the wavelength window, the rotational broadening and the
signal-to-noise ratio. The number of measured lines ranges from 1 to 17 lines. The
![]() range offers a large number of candidate lines.
Figure 5 shows the variation of this number with
range offers a large number of candidate lines.
Figure 5 shows the variation of this number with
![]() (solid line).
Rotational broadening starts to make the number of lines decrease
beyond about 70
(solid line).
Rotational broadening starts to make the number of lines decrease
beyond about 70
![]() .
Nevertheless additional lines in the spectral
domain redder than 4500 Å makes the number of lines larger than in the
domain collected with ECHELEC (Paper I; dotted line). Whereas with
ECHELEC the number of lines decreases with
.
Nevertheless additional lines in the spectral
domain redder than 4500 Å makes the number of lines larger than in the
domain collected with ECHELEC (Paper I; dotted line). Whereas with
ECHELEC the number of lines decreases with
![]() from 30
from 30
![]() to
reach only one line (i.e. the Mg II doublet) at 100
to
reach only one line (i.e. the Mg II doublet) at 100
![]() ,
the number
of lines with AURÉLIE is much sizeable: seven at 70
,
the number
of lines with AURÉLIE is much sizeable: seven at 70
![]() ,
still
four at 100
,
still
four at 100
![]() and more than two even beyond 150
and more than two even beyond 150
![]() .
.
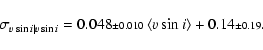
In Fig. 6, the differences between the individual
![]() values from each measured line in each spectrum and the
associated mean value for the spectrum are plotted as a function of
values from each measured line in each spectrum and the
associated mean value for the spectrum are plotted as a function of
![]() .
In the same way the error associated with the
.
In the same way the error associated with the
![]() has been estimated
in Paper I, a robust estimate of the standard deviation is computed
for each bin of 70 points. The resulting points (open grey circles in
Fig. 6) are adjusted with a linear least squares fit
(dot-dashed line). It gives:
has been estimated
in Paper I, a robust estimate of the standard deviation is computed
for each bin of 70 points. The resulting points (open grey circles in
Fig. 6) are adjusted with a linear least squares fit
(dot-dashed line). It gives:
The slope is lower with AURÉLIE data than with ECHELEC
spectra (Paper I):
![]() % against
% against
![]() %. This trend can be explained by the average number of lines for the computation of
the mean
%. This trend can be explained by the average number of lines for the computation of
the mean
![]() .
In the velocity range from 15 to 180
.
In the velocity range from 15 to 180
![]() ,
the number
of measured lines (Fig. 5) is on average 2.4 times larger with AURÉLIE than
with ECHELEC, which could lower the measured dispersion by a factor of
,
the number
of measured lines (Fig. 5) is on average 2.4 times larger with AURÉLIE than
with ECHELEC, which could lower the measured dispersion by a factor of
![]() .
.
As shown in Fig. 1, the distribution of spectral types is mainly
concentrated towards late-B and early-A stars, so that a variation of
the precision as a function of the spectral type would not be very
significant.
On the other hand, as the observed spectral domain is not always the
same, this could introduce an effect due to the different sets of
selected lines, their quantity and their quality in terms of
![]() determination. For each of the three spectral domains, the residuals,
normalized by
determination. For each of the three spectral domains, the residuals,
normalized by
![]() (Eq. (3)), are centered
around 0 with a dispersion of about 1 taking into account their error
bars, as shown in Table 4. This suggests that no effect due
to the measurement in one given spectral range is produced on the
derived
(Eq. (3)), are centered
around 0 with a dispersion of about 1 taking into account their error
bars, as shown in Table 4. This suggests that no effect due
to the measurement in one given spectral range is produced on the
derived
![]() .
.
| Spectral range |
|
|
|
|
|
|
|
|
|
|
|
|
|
Copyright ESO 2002
![\begin{figure}
\includegraphics[width=8.8cm,clip]{MS2413f3} \end{figure}](/articles/aa/full/2002/39/aa2413/img45.gif)
![\begin{figure}
\includegraphics[width=8.8cm,clip]{MS2413f5} \end{figure}](/articles/aa/full/2002/39/aa2413/img50.gif)
![\begin{figure}
\includegraphics[width=8.8cm,clip]{MS2413f6} \end{figure}](/articles/aa/full/2002/39/aa2413/img53.gif)