The method we use to study regularity of the distribution of clusters was proposed by Dr. J. Pelt and was first applied to the cluster distribution by O. Toomet (1997).
As hints of regularity are seen in the
correlation function and in the power spectrum,
the first idea would be to use these statistics,
but in their full three-dimensional form.
For a general homogeneous density field
the correlation function
![]() is
a function of a spatial displacement vector
is
a function of a spatial displacement vector ![]() and the power spectrum
and the power spectrum
![]() depends on
the three-dimensional wave vector
depends on
the three-dimensional wave vector ![]() .
The advantage of these statistics is that they
describe directly the periodicity in the data.
The disadvantages are larger, however. Firstly,
these statistics are extremely noisy for real
data samples, because we need much more individual
amplitudes to populate a three-dimensional region
than a line segment, as we have accustomed to do
for isotropic
.
The advantage of these statistics is that they
describe directly the periodicity in the data.
The disadvantages are larger, however. Firstly,
these statistics are extremely noisy for real
data samples, because we need much more individual
amplitudes to populate a three-dimensional region
than a line segment, as we have accustomed to do
for isotropic ![]() and P(k). Secondly,
even simple real space patterns give rise to a number
of interconnected amplitudes in the
and P(k). Secondly,
even simple real space patterns give rise to a number
of interconnected amplitudes in the ![]() and
and ![]() space;
they practically transform one 3-D distribution to
another that has to be analyzed again.
So, it will be easier (and more transparent)
to study the spatial distribution directly.
space;
they practically transform one 3-D distribution to
another that has to be analyzed again.
So, it will be easier (and more transparent)
to study the spatial distribution directly.
For this purpose we shall use similar methods as are employed to find periods in observed time series, say, the brightness of a variable star in different moments. The most intuitive method is to use a trial period to fold the series into a "phase diagram'', and to find the value of a statistic describing the reliability of that trial period. An illustration of that is shown in Fig. 1.
The data in the phase diagram (middle and right panels of Fig. 1) are usually binned, and mainly two methods are used to find the best period. The first one, called "phase dispersion minimization'' (PDM), proposed by Stellingwerf (1978), does that by minimizing the sum of variances of data in individual phase bins (finding the narrowest light curve). Another method, called "epoch folding'' (Leahy et al. 1983), maximizes the variance of the means of the phase bins (looking for a maximum amplitude of the light curve). Though surprising at the first glance, these two methods are were shown to be equivalent by Schwarzenberg-Czerny (1989) and Davies (1990).
Phase diagrams already have been applied to the study of regularity in the galaxy distribution. Dekel et al. (1992) used phase diagrams to estimate the confidence levels of the regular signal, which was found in the pencil-beam surveys by Broadhurst et al. (1990), They selected as their statistics the maximum phase amplitudes and the asymmetry of the phase distribution. These statistics are more noisy and their sampling distributions can be found only by simulations. In the contrary, the PDM and epoch folding, which are based on analysis of variance, allow to derive exact sampling distributions.
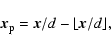
If we search for a cubic regularity, we have to fold our cluster distribution into a phase cube, as shown in Fig. 2. However, we cannot use directly the methods described above, as we do not observe densities at certain points in space, but discrete objects. However, we could, in principle, calculate a density for any point. As suggested by Dr. J. Pelt, the closest analog to the analysis of variance in our case will be a search for the maximum of the total variance of density in the phase cube. By the way, in the case of time series this variance (the total variance of data) is fixed and does not depend on the trial period.
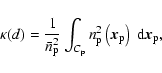
So, the statistic we shall use to estimate the cubic regularity
of the point distribution can be written as
This statistic is also invariant with respect to translations in data space - the phases of the regular signal will change, but not its amplitude distribution. This is strictly true, however, only if we can neglect edge effects, i.e. if we were able to cut the data cube from an infinite volume.
For simple distributions this statistic can be found analytically. If we have a constant density data cube of a fixed size, the regularity signal will come from edge effects, since the partial cells will create a nonuniform phase cube density distribution. It is a bit tedious to count the different contributions, but it can be done. We give the formula in the Appendix (it is useful for checking the program, should the reader want to write one) and illustrate the result in Fig. 3. Such a figure, the dependence of a statistic on a trial period, is called a periodogram; in our case the regularity periodogram. The regularity according to the definition above is shown by a solid line; the lower dashed line shows a slightly modified statistic where the points that are nearby in real space are ignored when calculating densities. We shall argue below that the latter version works better.
![\begin{figure}
\par\includegraphics[width=8.8cm,clip]{h1676f03.eps}\end{figure}](/articles/aa/full/2002/37/aah1676/img38.gif) |
Figure 3: The regularity periodogram for a constant density cube of size D (d is the test cube size, the period). The solid line is for the full density statistic, the dashed line - for the version without local correlations (see Sect. 2.4). |
As we see, for a constant density cube
the regularity ![]() is unity for the periods where there are
no edge effects (the data cube size is an integer multiple
of the period). As the period grows, the number of
foldings decreases and the relative strength of
edge effects increases. A regularity amplitude
of 1.1 is already fairly large.
is unity for the periods where there are
no edge effects (the data cube size is an integer multiple
of the period). As the period grows, the number of
foldings decreases and the relative strength of
edge effects increases. A regularity amplitude
of 1.1 is already fairly large.
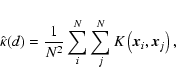
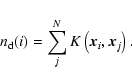
In order to get an estimator for the regularity ![]() we have to be able to calculate the density of points
in the phase cube. Noting that the integral in the
statistic can be written as
we have to be able to calculate the density of points
in the phase cube. Noting that the integral in the
statistic can be written as

As the phase distribution is periodic by definition,
any kernel we use has also to take into account that periodicity,
when calculating densities for points near the boundaries of the
phase cube.
In practice we do this by creating a padding for the phase
cube that extends from
![]() to
to
![]() ,
and letting the index j in Eq. (3) to run
over the padded phase cube. This speeds up calculations
considerably, since we have to create this padding once for every
trial period, without that the periodicity conditions should
have been checked for every point i in Eq. (4).
The program to calculate the periodogram is written
in C and it can be obtained by anonymous ftp
from ftp.aai.ee:/pub/saar/regularity.tar.gz.
,
and letting the index j in Eq. (3) to run
over the padded phase cube. This speeds up calculations
considerably, since we have to create this padding once for every
trial period, without that the periodicity conditions should
have been checked for every point i in Eq. (4).
The program to calculate the periodogram is written
in C and it can be obtained by anonymous ftp
from ftp.aai.ee:/pub/saar/regularity.tar.gz.
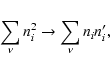
The probability distribution for the estimator (3) is easy to derive for Poisson-distributed data. As we use the regularity periodogram to search for small regular signals, this case will serve as a good point of reference.
Although we calculate the phase cube density by means of a
kernel estimator, this is statistically equivalent to binning
the phase cube into ![]() bins, where
bins, where
![]() .
In this binning approximation we can write
.
In this binning approximation we can write
In practice, the occupation numbers Ni should be at least
a few tens,
to ensure proper estimates of the phase cube density.
Thus, we can approximate the Poisson distribution of intensity
![]() by the Gaussian one with the mean and
variance
by the Gaussian one with the mean and
variance ![]() .
.
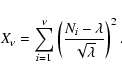
Let us now define a sum
Expanding the sum in (5) and using the expression
for ![]() ,
we get
,
we get
 |
(6) |
![\begin{eqnarray*}{E}[\hat{\kappa}]=\frac{1}{N}{E}[X_\nu]+1=1+\frac{\nu}{N}
\end{eqnarray*}](/articles/aa/full/2002/37/aah1676/img65.gif)
![\begin{eqnarray*}E[\hat{\kappa}]=\frac{1}{N}E\left[X_\nu\right]+1-\frac{\nu}{N}=1.
\end{eqnarray*}](/articles/aa/full/2002/37/aah1676/img67.gif)
Now we are able
to estimate the sensitivity of the estimator.
Let us suppose that there is a small cubic signal,
consisting of ![]() additional points each in
additional points each in ![]() bins. Expanding the sum of squares of bin population
numbers for this case and taking into account the
change in the normalization factor, we can write for the estimator
bins. Expanding the sum of squares of bin population
numbers for this case and taking into account the
change in the normalization factor, we can write for the estimator
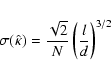
Thus we are able to detect a signal, if
As an example, we take a typical application to galaxy
clusters with
![]() ,
,
![]() ,
and
choose
,
and
choose ![]() .
If we suppose that the number
of signal bins is around 10, then a cubic signal with a
total number of
.
If we suppose that the number
of signal bins is around 10, then a cubic signal with a
total number of ![]() clusters should be detectable already.
If we know the amplitude of a periodogram
and can estimate the filling factor of the structure,
then we can use this formula also to estimate the
number of points in the cubic arrangement.
clusters should be detectable already.
If we know the amplitude of a periodogram
and can estimate the filling factor of the structure,
then we can use this formula also to estimate the
number of points in the cubic arrangement.
An illustration of the sensitivity
of the regularity statistic is shown in Fig. 4,
where a tiny regular signal of a total of 80 points is
mixed into a Poisson sample of 4000 points (S/N=0.02).
These points are distributed near a grid with a spacing
of 100, while the total size of the cube is 700.
We show also the range spanned by the regularity periodograms
of 100 pure Poisson realizations of the data. We see that such
a small signal is readily extracted from data, there is a
peak with confidence higher than 99% at the period of
100. The filling factor of the cubic structure
![]() is rather small for this arrangement,
of course. A clear period will also generate both
harmonics and sub-harmonics of smaller amplitude.
The d=50 harmonic is well seen in the Figure, while
sub-harmonics are hidden by edge effects.
is rather small for this arrangement,
of course. A clear period will also generate both
harmonics and sub-harmonics of smaller amplitude.
The d=50 harmonic is well seen in the Figure, while
sub-harmonics are hidden by edge effects.
We also show a slice of the data cube in this figure. Note that the regular signal can not be traced there by eye.
There are two possible strategies to determine
the size of the bin (the width of the density kernel).
The first is to keep this width
![]() constant in data space.
In that case the effective number of bins
constant in data space.
In that case the effective number of bins
![]() (d is the period) and
(d is the period) and
Another strategy is to
keep the phase resolution constant for all periods
(the same number of bins, ![]() ). In this case
we get similar smoothing for all periods, i.e. the mean number of points per bin
). In this case
we get similar smoothing for all periods, i.e. the mean number of points per bin ![]() remains the same.
As
remains the same.
As
![]() ,
the rms error can be written as
,
the rms error can be written as

We have used both strategies, starting with that of the constant kernel width in data space, but we realized later that the second strategy is much better.
The error analysis above was made for Poisson data samples. In real applications, our samples have substantial short-range correlations. This will increase both the amplitude and the variance of the estimate, and the clustered nature of the data could generate false regularity signals.
In order to demonstrate this we generated a segment Cox process with
the same correlation properties as our cluster sample. The use
of segment Cox processes in correlation analysis has been advocated
by Pons-Bordería et al. (1999).
A segment Cox process places random segments of length l in
space and then generates Poisson-distributed points
along these segments.
An important property of a segment Cox process is that
while its long-range distribution is strictly
homogeneous (![]() ,
if
,
if ![]() ), its
short-range correlation function
), its
short-range correlation function
![]() is similar to the correlations we find in
observations.
is similar to the correlations we find in
observations.
We describe segment Cox processes and discuss how to specify the
parameters of the process in the appendix.
Here we list
those for our sample: the size of the cube is 700,
the segment length l=60, the
density of segments
![]() (the
mean number of segments for the sample cube is 566),
the line density of points
(the
mean number of segments for the sample cube is 566),
the line density of points
![]() (the mean
number of points per segment is 7). The total number of
points in the sample is 2057. As this is only an
example, we use dimensionless units here, but if we would
multiply these by 1 h-1 Mpc, all these sizes would be
comparable to those of cluster samples.
(the mean
number of points per segment is 7). The total number of
points in the sample is 2057. As this is only an
example, we use dimensionless units here, but if we would
multiply these by 1 h-1 Mpc, all these sizes would be
comparable to those of cluster samples.
We show the correlation function of our simulated segment Cox sample and
plot a slice of the sample cube in Fig. 5.
The spatial distribution of points looks slightly
peculiar (like a segment Cox process should), but
the correlation function that we show is close to that
of rich clusters of galaxies. We plot the function
![]() there as an example.
there as an example.
Now that we have our simulated Cox sample we can calculate its regularity periodogram. In order to avoid edge effects we choose the periods this time by dividing the size of the data cube by successive integers, so that all cells fit exactly in the cube. This would not be a good recipe for observations, as we loose a lot of interesting periods this way, but here we know that there are no real periods in the data.
We show this periodogram in Fig. 6 with a dashed line. As expected, the estimate is biased, exceeding the expected value of unity for all periods, and the bias grows with period. The latter effect is also easy to understand, as for larger periods the number of stacked cells is smaller and the influence of clusters in individual cells is larger.
We could try to correct for this effect, determining the short-range correlation in advance, and comparing our periodograms with those built for Cox samples. This is not easy, however; while one can usually construct a segment Cox process that describes the two-point correlations of a sample, Cox samples often look rather different from observational ones. Hence one could never be sure if the comparison is a fair one.
Fortunately, there is an easier way to handle this, and again it is a trick known to the periodicity community. As Dr. J. Pelt suggested, we could modify our estimator, discarding any local contributions to the phase cube density. In other words, when calculating the sum in formula (4), we do not count these data points that lie in the same real space cell (of size d) as the point i itself.
![\begin{figure}
\par\includegraphics[width=8.8cm,clip]{h1676f06.eps}\end{figure}](/articles/aa/full/2002/37/aah1676/img95.gif) |
Figure 6: Regularity histograms for a segment Cox process simulating short-range correlations. The dotted line shows the periodogram as defined above by formula (3), the solid line - for the estimator that discards local correlations. |
This effectively eliminates local correlations and leaves only long-range correlations we are interested in. We show this periodogram as the solid line in Fig. 6. This line wiggles nicely around the expected value in the range predicted by the estimate of the variance, and it does not "feel'' short-range correlations at all.
We have used this estimator in all the rest of
the paper. We have to note that in this case the normalization
is strictly correct for very short periods only.
The sum in the estimator (3) has to be
changed to
![\begin{eqnarray*}E[\hat{\kappa}]=1-(d/L)^3=f(d/L).
\end{eqnarray*}](/articles/aa/full/2002/37/aah1676/img98.gif)
The regularity periodogram for this estimator for a constant density cube can also be found analytically; the formula is given in the appendix and demonstrated in Fig. 3.
It is good, of course, that our estimator is sensitive to extremely small cubic signals. However, the same sensitivity makes it also prone for edge effects as we see in Fig. 4; incomplete boundary cells may hide the signal we are seeking for.
Thus, first of all we have to account for edge effects very carefully. The case illustrated in Fig. 4 is a little extreme, as the incomplete cells form a clean cubic signal, but it shows clearly the possible amplitude of edge effects. One possibility would be to use a minus-estimator, discarding all those cells that intersect the boundary of the sample. This is a mathematically elegant possibility. However, it is of little use in practice, since boundaries of real samples are usually so complex that we would have to discard most of the data.
To show the effect of selection, we generated a spherical sample of the same linear dimensions, with a diameter of 700 and the same number of points, 2000. The density of this sample falls linearly with the radius, going to zero at the boundary of the sphere. This mimics observational samples rather well. Ten periodograms for this sample are shown in Fig. 7. The main effect is a radical change in the shape of the periodogram. Secondly, the boundary-generated oscillations are gone, as the boundaries are fuzzy. And thirdly, the scatter of the curves remains constant. This is expected, as both the total number of points (2000) and the number of points per density bin (30) are the same.
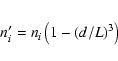
Selection effects could be accounted for by
introducing weights for data points that are inversely
proportional to the normalized density of the sample
(the selection function) at that point ![]() ,
defining:
,
defining:
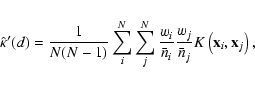
An easier approach is to build reference
samples using the selection
functions determined for data samples, and
to account for edge effects
by comparing the real sample and a reference sample
with the same geometry, using a reduced regularity
periodogram k:
The reference periodogram will take account of both the edge and selection effects. Interestingly, the reduced estimator (10) might be the only one used in astronomy that actually gains from selection effects - the fact that the density of data points gets smaller at the sample boundaries helps to reduce significantly the amplitude of edge effects.
Apart from the spurious signal the boundaries create, they have another effect - they destroy the translational invariance of the statistic. This can be most easily seen when folding a one-dimensional analog of a data cube, a constant density line segment. This means that we should create our reference samples very carefully, as any small shift in the shape between the reference sample and the observed sample would give a spurious signal. Fortunately, fuzzy boundaries of observed samples, due to selection effects, practically eliminate this problem.
We have tested this by shifting the reference samples generated to use with the observed galaxy cluster samples. The geometry of these samples is rather complicated and slight shifts between the observed and simulated shapes could easily happen. The test showed that shifts up to 20 h-1 Mpc in every coordinate direction (the samples consist of two cones with characteristic sizes of 350 h-1 Mpc) practically do not change regularity periodograms.
The regularity statistic is a typical universal frequentist statistic that can be applied to all point configurations. If we were using the Bayesian approach, we also should have specified a statistical model. However, this universality has also a drawback - without a statistical model we do not know if there exist non-cubic arrangements which also will produce a cubic signal. Thus, in order to understand the proposed statistic, we have to test it on various spatial arrangements.
The first class of arrangements we use are the Voronoi models of large-scale structure, introduced by van de Weygaert & Icke (1989) and van de Weygaert (1991).
These models are based on the Voronoi tessellation of space.
In a Poisson-Voronoi point process the centers of voids serve as seeds
of structure, and have a Poisson distribution, while the points
(clusters of galaxies in our case) are
located at the vertices of the structure formed by the expanding voids.
Although the model starts from a Poisson distribution,
it is well clustered and has a power-law correlation
function
![]() ,
close to that of the galaxy clusters.
This amazing fact was discovered by van de Weygaert & Icke (1989)
and verified exactly by Heinrich et al. (1998).
In this model clusters of galaxies form
superclusters, which together with voids form a cellular
supercluster-void network, similar to that observed.
The only free parameter of the model is
the mean density of void centers that determines the mean
diameter of voids.
,
close to that of the galaxy clusters.
This amazing fact was discovered by van de Weygaert & Icke (1989)
and verified exactly by Heinrich et al. (1998).
In this model clusters of galaxies form
superclusters, which together with voids form a cellular
supercluster-void network, similar to that observed.
The only free parameter of the model is
the mean density of void centers that determines the mean
diameter of voids.
We used a program by R. van de Weygaert to generate the cluster sample. The size of the simulation box was 700 h-1 Mpc; the number of seeds was 431, chosen to obtain a mean diameter of voids 115 h-1 Mpc in accordance with the distribution of Abell clusters (Paper I). We generated ten realizations of the model; the number of clusters in the samples varied between 2884 and 2948 (for details see Einasto et al. 1997c, hereafter Paper III).
To characterize the regularity of a model we calculated the
reduced regularity periodograms k(d) and the correlation
functions ![]() of clusters. The results for ten realizations are
shown in Fig. 8.
The correlation function has a deep
minimum around 80 h-1 Mpc and a secondary maximum at 140 h-1 Mpc; on larger
scales it flattens out to a mean value around zero. The geometric
interpretation of this behaviour was discussed in Paper III: the
minimum corresponds to the mean distance between superclusters and
surrounding voids; the secondary maximum can be
identified with the mean distance between
superclusters across voids. In a Voronoi model the mean size of voids
is well fixed, thus the presence of a secondary maximum is expected.
On still larger scales the behavior of the correlation function
depends on the regularity of the distribution of rich superclusters.
In a Voronoi model void centers as well as rich
superclusters are randomly distributed, thus we expect no correlation
on very large scales. As we see from Fig. 8,
on very large scales
the correlation function is indeed close to zero which corresponds to
a Poisson distribution. In contrast to the correlation function the
features in the regularity periodograms k(d)have a rather low amplitude (there are suspicious signals
at 190 h-1 Mpc and 220 h-1 Mpc), but overall the periodograms are
featureless, resembling the regularity periodograms of
pure Poisson samples. Although the Voronoi model is cellular,
the cells are not cubic or regular.
of clusters. The results for ten realizations are
shown in Fig. 8.
The correlation function has a deep
minimum around 80 h-1 Mpc and a secondary maximum at 140 h-1 Mpc; on larger
scales it flattens out to a mean value around zero. The geometric
interpretation of this behaviour was discussed in Paper III: the
minimum corresponds to the mean distance between superclusters and
surrounding voids; the secondary maximum can be
identified with the mean distance between
superclusters across voids. In a Voronoi model the mean size of voids
is well fixed, thus the presence of a secondary maximum is expected.
On still larger scales the behavior of the correlation function
depends on the regularity of the distribution of rich superclusters.
In a Voronoi model void centers as well as rich
superclusters are randomly distributed, thus we expect no correlation
on very large scales. As we see from Fig. 8,
on very large scales
the correlation function is indeed close to zero which corresponds to
a Poisson distribution. In contrast to the correlation function the
features in the regularity periodograms k(d)have a rather low amplitude (there are suspicious signals
at 190 h-1 Mpc and 220 h-1 Mpc), but overall the periodograms are
featureless, resembling the regularity periodograms of
pure Poisson samples. Although the Voronoi model is cellular,
the cells are not cubic or regular.
![\begin{figure}
\par\includegraphics[width=8.8cm,clip]{h1676f08.eps}\par\includegraphics[width=8.8cm,clip]{h1676f09.eps}\end{figure}](/articles/aa/full/2002/37/aah1676/img108.gif) |
Figure 8: Regularity periodograms (upper panel) and correlation functions (lower panel) for ten realizations of Voronoi models. |
![\begin{figure}
\par\includegraphics[width=8.8cm,clip]{h1676f10.eps}\par\includegraphics[width=8.8cm,clip]{h1676f11.eps}\end{figure}](/articles/aa/full/2002/37/aah1676/img109.gif) |
Figure 9: Regularity periodograms (upper panel) and correlation functions (lower panel) for ten realizations of quasi-regular line models. |
Next we shall choose a quasi-regular model distribution.
We use mixed
models, i.e. samples with two populations of clusters.
The clusters of one population are randomly distributed, while
in the second population they are located in superclusters which form a
regular rectangular network with a period of 130 h-1 Mpc.
In our model superclusters are randomly located
along rods which form a regular rectangular network with a
period of 130 h-1 Mpc.
The positions of the rods have been randomly
shifted with the rms deviation of ![]() h-1 Mpc (for details see Paper III).
h-1 Mpc (for details see Paper III).
The box size was taken as 690 h-1 Mpc, the period was set to 115 h-1 Mpc, the number of randomly located poor superclusters was chosen to be 3000, and the minimal number of rich superclusters on rods was 4. We generated ten realizations of the model; the total number of clusters varies between 9218 and 9519, and the total number of clusters in quasi-regular population in rods varied between 3328 and 4216. The regularity periodograms and the correlation functions are shown in Fig. 9. The correlation functions are oscillating with a period of 115 h-1 Mpc; the amplitude of oscillations decreases very slowly with distance r. The regularity periodograms have two well-pronounced maxima at d=115 h-1 Mpc and d=230 h-1 Mpc. The scatter of the regularity periodograms is very small.
Obviously, the method is sensitive to the direction of the axes of the
trial cubes.
The orientation of a cube can be described by three Euler angles,
so there is a considerable amount of freedom here. If the
trial cubes are rotated ![]() along one axis of the cubic alignment,
there will be a mixture of
cubic signals - one with the previous period from the
direction perpendicular to that face, and another with the
period of
along one axis of the cubic alignment,
there will be a mixture of
cubic signals - one with the previous period from the
direction perpendicular to that face, and another with the
period of ![]() times larger. If the trial cubes are
oriented along the long diagonals, from a vertex to the
opposing vertex of the original cube, the cubic network
will be cubic again with a single period of
times larger. If the trial cubes are
oriented along the long diagonals, from a vertex to the
opposing vertex of the original cube, the cubic network
will be cubic again with a single period of ![]() times the original one.
For other orientations the signal will be weak or absent.
This property is illustrated in Fig. 10.
The reason for this behaviour is clear: the value of k(d) depends on
the number of clusters which coincide in the stacked cell. If clusters
located in superclusters of different original cells lie in the
stacked cell in different locations (which happens when
orientations differ considerably), then k(d)cannot exceed by much the expected value of unity for random
samples.
times the original one.
For other orientations the signal will be weak or absent.
This property is illustrated in Fig. 10.
The reason for this behaviour is clear: the value of k(d) depends on
the number of clusters which coincide in the stacked cell. If clusters
located in superclusters of different original cells lie in the
stacked cell in different locations (which happens when
orientations differ considerably), then k(d)cannot exceed by much the expected value of unity for random
samples.
![\begin{figure}
\par\includegraphics[width=8.8cm,clip]{h1676f12.eps}\end{figure}](/articles/aa/full/2002/37/aah1676/img113.gif) |
Figure 10:
Angular sensitivity of regularity
periodograms (for a quasi-regular model).
The solid, dashed and dot-dashed lines are
for trial cubes oriented at
|
We have compared the regularity periodograms and correlation functions
also for several cluster samples found in numerical simulations of
the large-scale structure of the Universe.
We used four models analyzed by E99. These models
were calculated using a PM code with 1283 particles and a 2563 mesh in a cube of size 720 h-1 Mpc. The models include the standard CDM model
with the density of matter
![]() (model CDM61),
and a LCDM model with the vacuum
energy term,
(model CDM61),
and a LCDM model with the vacuum
energy term,
![]() and
and
![]() (model CDM62).
To obtain a model
which better represents the observed power spectrum (see E99) we
used two initial power-law spectra with the indices n=1 on large scales,
n=-1.5 on small scales, and a sharp transition on a scale of
k=0.05 h Mpc-1 (models DPS6 and DPS3, the latter
with 2563 particles).
The last model we used (DPP6) has an additional high-amplitude
peak in the power spectrum near the maximum.
In most of the models clusters of
galaxies were selected using the friends-of-friends algorithm.
Only in the high-resolution model DPS3, computed by
Gramann & Suhhonenko (1999),
maxima of the smoothed density field were used for cluster
identification.
(model CDM62).
To obtain a model
which better represents the observed power spectrum (see E99) we
used two initial power-law spectra with the indices n=1 on large scales,
n=-1.5 on small scales, and a sharp transition on a scale of
k=0.05 h Mpc-1 (models DPS6 and DPS3, the latter
with 2563 particles).
The last model we used (DPP6) has an additional high-amplitude
peak in the power spectrum near the maximum.
In most of the models clusters of
galaxies were selected using the friends-of-friends algorithm.
Only in the high-resolution model DPS3, computed by
Gramann & Suhhonenko (1999),
maxima of the smoothed density field were used for cluster
identification.
![\begin{figure}
\par\includegraphics[width=8.8cm,clip]{h1676f13.eps}\par\includegraphics[width=8.8cm,clip]{h1676f14.eps}\end{figure}](/articles/aa/full/2002/37/aah1676/img118.gif) |
Figure 11: Regularity periodograms (upper panel) and correlation functions (lower panel) for simulated CDM and double-power-law models. |
Regularity periodograms and correlation functions for simulated cluster samples are shown in Fig. 11. These functions have been calculated for the whole cluster sample in the simulation box. The correlation functions of these model samples oscillate slightly, except for the model DPP6 with a high peak in the power spectrum that causes high-amplitude oscillations. The regularity periodograms of all models are practically featureless, even that for the model DPP6; small peaks and valleys are due to shot noise. This is understandable, as the initial density fluctuations are, by definition, isotropic and cannot develop into a cubic structure.
Thus, application of the regularity statistic to these three different, but typical classes of spatial arrangement of objects in cosmology, shows that it well detects the cubic signal, if it is present, and does not "feel'' other regularities.
Copyright ESO 2002
![\begin{figure}
\par\includegraphics[width=8.8cm,clip]{h1676f02.eps}\end{figure}](/articles/aa/full/2002/37/aah1676/img27.gif)
![\begin{figure}
\par\includegraphics[width=17cm,clip]{h1676f04.eps}\end{figure}](/articles/aa/full/2002/37/aah1676/img57.gif)
![\begin{displaymath}\mbox{Var}[\hat{\kappa}]=\frac{1}{N^2}\mbox{Var}[X_\nu]=\frac{2\nu}{N^2}\cdot
\end{displaymath}](/articles/aa/full/2002/37/aah1676/img66.gif)


![\begin{figure}
\par\includegraphics[width=8.8cm,clip]{h1676f05.eps}\end{figure}](/articles/aa/full/2002/37/aah1676/img94.gif)

![\begin{figure}
\par\includegraphics[width=8.8cm,clip]{h1676f07.eps}\end{figure}](/articles/aa/full/2002/37/aah1676/img105.gif)