 |
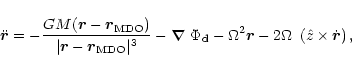
Figure 1: Derivation of the nuclear disk, and its (smooth) gravitational potential. a) Observed sky brightness distribution, from Lauer et al. (1998); the dotted curve has magnitude 14.3, and successive isocontours differ by 0.25 mag. b) Brightness profiles along the P1-P2 line: observed (dotted curve), the Sérsic bulge (dashed-dotted curve), and the bulge-subtracted nuclear disk (solid curve). c) Brightness distribution of the disk, viewed face-on; the isocontours follow the same convention as in a). Isocontours of the disk-potential are displayed in d); the units are such that the deep minimum near P1 has depth equal to unity, and successive isocontours mark increments of 0.05. In c) and d), "X'' marks the location of the center of mass. |
Figure 1a shows the nucleus of M 31, plotted from the V-band, HST observations of Lauer et al. (1998). The UV cluster and the MDO are
at
the origin. P2 is near the MDO, with sky coordinates (
![]() ), and P1 is located at (
), and P1 is located at (
![]() ).
The bulge was assumed to be spherical, with a Sérsic
brightness profile (Sérsic 1968; Kormendy & Bender 1999) - see Fig. 1b. The center
of
mass (COM) of the bulge, disk, and MDO was required to coincide
with
the bulge center; this common location was determined, by an
iterative method, at (
).
The bulge was assumed to be spherical, with a Sérsic
brightness profile (Sérsic 1968; Kormendy & Bender 1999) - see Fig. 1b. The center
of
mass (COM) of the bulge, disk, and MDO was required to coincide
with
the bulge center; this common location was determined, by an
iterative method, at (
![]() ), in agreement
with
Kormendy & Bender (1999). With one notable exception, (Bacon et al. 2001), all
investigations have assumed that the nuclear disk is coplanar with
the much larger galactic disk of M 31. We obtained very poor results
with this assumption. Therefore, we resolved to determine
the inclination and orientation of the nuclear disk, based on the
photometry, similar to Bacon et al. (2001). The disk light covered an
approximately elliptical region, with a ragged edge. The plane in
which the best-fit ellipse (to the edge) deprojected to a circle
was defined to be the disk plane; its inclination (i), and PA of
the line of nodes, were
), in agreement
with
Kormendy & Bender (1999). With one notable exception, (Bacon et al. 2001), all
investigations have assumed that the nuclear disk is coplanar with
the much larger galactic disk of M 31. We obtained very poor results
with this assumption. Therefore, we resolved to determine
the inclination and orientation of the nuclear disk, based on the
photometry, similar to Bacon et al. (2001). The disk light covered an
approximately elliptical region, with a ragged edge. The plane in
which the best-fit ellipse (to the edge) deprojected to a circle
was defined to be the disk plane; its inclination (i), and PA of
the line of nodes, were
![]() ,
and
,
and ![]()
![]() ,
respectively. The face-on view of the disk, shown
in
Fig. 1c, has mass
,
respectively. The face-on view of the disk, shown
in
Fig. 1c, has mass ![]()
![]() .
.
To minimize edge-effects, the self-gravitational potential
was evaluated in the disk plane, at 104 grid points within a
central square, of side equal to
![]() .
However, the
Newtonian
.
However, the
Newtonian
![]() contributions from the
entire disk of Fig. 1c, which has diameter
contributions from the
entire disk of Fig. 1c, which has diameter ![]()
![]() ,
was used. The grid values were fit to a 20-th order polynomial
function of the Cartesian coordinates,
,
was used. The grid values were fit to a 20-th order polynomial
function of the Cartesian coordinates,
![]() ,
a contour
plot of
which is displayed in Fig. 1d. The polynomial form smoothed the
potential, facilitated coding of the integrator, and checking of
the
integrated orbits in the nearly Keplerian limit (Sridhar & Touma 1999).
Figures 1c
and 1d can be imagined as either snapshots of a rotating
configuration,
or as steady images in a frame rotating with some angular speed
,
a contour
plot of
which is displayed in Fig. 1d. The polynomial form smoothed the
potential, facilitated coding of the integrator, and checking of
the
integrated orbits in the nearly Keplerian limit (Sridhar & Touma 1999).
Figures 1c
and 1d can be imagined as either snapshots of a rotating
configuration,
or as steady images in a frame rotating with some angular speed
![]() ,
about an axis normal to the disk plane, and passing through the
COM.
The forces on a test star include the gravitational attractions of
the
MDO and disk, as well as centrifugal and Coriolis forces. The
contribution of the bulge was ignored, because it is so much
smaller than
the other forces.
,
about an axis normal to the disk plane, and passing through the
COM.
The forces on a test star include the gravitational attractions of
the
MDO and disk, as well as centrifugal and Coriolis forces. The
contribution of the bulge was ignored, because it is so much
smaller than
the other forces.
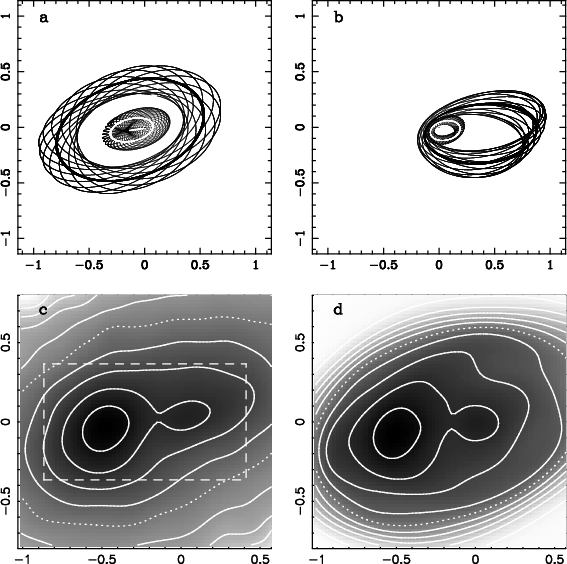 |
Figure 2:
Orbits in the rotating frame and photometric fits.
The axes in all panels are sky positions. a) and b) show prograde
and retrograde loop orbits, respectively, as seen on the sky, for
|
Orbits were computed in the rotating frame by numerically
integrating
the equations of motion,
For each value of energy, loops of two or three different
"thicknesses'' (i.e. deviations from the parent loop) were
computed.
Each orbit was sampled, and populated with "stars'', spaced apart
uniformly in time. All stars in an orbit are accorded the same
(unknown) mass; this is not a restriction, because in a
collisionless system, the relevant physical quantities are the mass
per orbit. The numbers of "stars'' in an orbit was chosen
proportional to the inverse square of the energy (approximately,
square of the "semi-major axis'') of the parent loop; thus 25stars sufficed for an orbit with
![]() ,
whereas an orbit
with
,
whereas an orbit
with
![]() was sampled by more than 10 000 stars.
Altogether, the positions and velocities of
was sampled by more than 10 000 stars.
Altogether, the positions and velocities of ![]() 237 000 stars,
populating 50 prograde orbits and 20 retrograde orbits, were
recorded.
237 000 stars,
populating 50 prograde orbits and 20 retrograde orbits, were
recorded.
Orbit masses were determined by iteratively imposing on the model,
consistency with the bulge-subtracted sky brightness of a region
covered by the orbits; the dashed box of Fig. 2c encloses this
region. The box was divided into 112 equal square cells, each of
side
![]() ;
each cell was small enough to give good
resolution, and large enough (16 pixels) to keep pixel noise levels
low. The "observed'' mass per cell,
;
each cell was small enough to give good
resolution, and large enough (16 pixels) to keep pixel noise levels
low. The "observed'' mass per cell, ![]() (for
(for
![]() ),
was obtained from the observed light, by multiplication with
),
was obtained from the observed light, by multiplication with
![]() ;
these numbers composed our basic data. We defined
mi (for
;
these numbers composed our basic data. We defined
mi (for
![]() )
as the mass of orbit i, that also lies
within the box; the total mass in the orbit exceeds mi. We
normalized
)
as the mass of orbit i, that also lies
within the box; the total mass in the orbit exceeds mi. We
normalized
![]() ,
to unit mass in the box. A linear relationship,
,
to unit mass in the box. A linear relationship,
![]() ,
exists between the "observed
masses''
,
exists between the "observed
masses'' ![]() ,
and the unknown masses mi. The positive
kernel,
K(j|i), is known from the orbit library. It has the property,
,
and the unknown masses mi. The positive
kernel,
K(j|i), is known from the orbit library. It has the property,
![]() ,
for all
,
for all
![]() .
An
initial
guess,
.
An
initial
guess,
![]() ,
was iterated by the RL algorithm
(Richardson 1972; Lucy 1974). The problem being overdetermined, about 5000iterations ensured good convergence to some
,
was iterated by the RL algorithm
(Richardson 1972; Lucy 1974). The problem being overdetermined, about 5000iterations ensured good convergence to some
![]() .
Velocities were then transformed to the inertial frame. Rescaling
of
.
Velocities were then transformed to the inertial frame. Rescaling
of
![]() to physical values, and including the
portions of orbits outside the box, provided a numerical
distribution
function. The entire process, beginning from the selection of an
orbit-library, was repeated for several values of
to physical values, and including the
portions of orbits outside the box, provided a numerical
distribution
function. The entire process, beginning from the selection of an
orbit-library, was repeated for several values of ![]() ,
between
5 and
,
between
5 and
![]() .
For any chosen value of
.
For any chosen value of ![]() ,
the final
set of orbit masses,
,
the final
set of orbit masses,
![]() ,
corresponds to a prediction for the cell
masses,
,
corresponds to a prediction for the cell
masses,
![]() ,
which
should be compared with the data,
,
which
should be compared with the data, ![]() .
For models with
.
For models with
![]() ,
the root-mean-squared deviation
in mass per cell are,
,
the root-mean-squared deviation
in mass per cell are,
![]() ;
other values of
;
other values of
![]() resulted in very poor models.
resulted in very poor models.
Copyright ESO 2002