It has been shown previously that the lognormal distribution can
adequately describe the properties of GRBs (Quilligan et al. 1999). The
lognormal distribution is generated by statistical processes
whose results depend on a product of probabilities arising from a
combination of events (Aitchison & Brown 1957). A positive random
variable X is said to be lognormally distributed if ![]() is
normally distributed with mean
is
normally distributed with mean ![]() and variance
and variance ![]() .
The
probability density function is:
.
The
probability density function is:
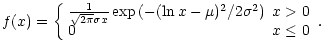 |
(1) |
The distribution of the FWHM of the pulses from 319 GRBs and the
best lognormal fit are given in Fig. 6a. Figure 6b shows the same
data plotted as a cumulative percent on logarithmic probability
paper such that a lognormal distribution yields a straight line.
All pulses have
![]() and
and
![]() .
The distribution is very broad with a maximum at 0.7 s and half widths at 0.14 s and 3.5 s. The value of the reduced
.
The distribution is very broad with a maximum at 0.7 s and half widths at 0.14 s and 3.5 s. The value of the reduced
![]() is 0.3 showing the data is well fit by the lognormal
distribution. In obtaining
is 0.3 showing the data is well fit by the lognormal
distribution. In obtaining ![]() ,
the part of the fit below
0.1 s was not included because of the distortion caused by the
limited time resolution that is apparent in Fig. 6b. The value
of the reduced
,
the part of the fit below
0.1 s was not included because of the distortion caused by the
limited time resolution that is apparent in Fig. 6b. The value
of the reduced ![]() for the best lognormal fit as a
function of
for the best lognormal fit as a
function of
![]() and
and
![]() are given
in Figs. 6c an 6d. The fits are acceptable over most of the
range with the largest departures occurring at the lowest values
of
are given
in Figs. 6c an 6d. The fits are acceptable over most of the
range with the largest departures occurring at the lowest values
of
![]() and
and
![]() because of the
serious effects of pulse pile up. The lognormal distribution is
a better fit when the effects of the overlapping pulses are
reduced. The parameters of the best lognormal fit for
because of the
serious effects of pulse pile up. The lognormal distribution is
a better fit when the effects of the overlapping pulses are
reduced. The parameters of the best lognormal fit for
![]() and
and
![]() are given in
Table 2.
are given in
Table 2.
| Property | Width
( | |||
| FWHM | -0.36 | 1.37 | 0.3 | 0.14-3.5 |
| Rise time | -0.44 | 1.59 | 1.3 | 0.1-4.2 |
| Fall time | -0.07 | 1.59 | 1.5 | 0.14-6.1 |
| Pulse Amp. | 9.0 | 1.12 | 0.3 | 2.2
|
| Area | 11.9 | 1.2 | 1.1 | 35
|
| Time Int.a | 0.21 | 1.03 | - | 0.37-4.14 |
| Peak Energyb | 5.6 | 0.58 | - | 137-535 |
The distribution of the rise times of the pulses and the best
lognormal fit are given in Fig. 7a. Figure 7b shows the same data
plotted as a cumulative percent and the large count in the first
bin is due to the 64 ms resolution of BATSE. The parameters of
the best lognormal fit to the broad distribution are listed in
Table 2. The value of the reduced
![]() show the data
is compatible with the lognormal distribution.
show the data
is compatible with the lognormal distribution.
![\begin{figure}
\par\psfrag{xlab}[b]{\small$t_{\rm f}$\space (sec)}
\psfrag{ylab}[b]{\small Frequency}
\includegraphics[width=8.8cm,clip]{h3056f11.eps}\end{figure}](/articles/aa/full/2002/14/aah3056/img61.gif) |
Figure 8:
The distribution of the fall times of the pulses with
|
The distribution of the fall times of the pulses and the best lognormal fit are given in Fig. 8. The parameters of the best lognormal fit to the data are given in Table 2. The fall times are also compatible with the lognormal distribution and have a wider range with a slightly larger mean than the rise times.
The distributions of the amplitudes and areas of the pulses with
![]() and
and
![]() from
250 GRBs, summed over two detectors, and the best lognormal fits
are given in Figs. 9 and 10. The distributions are very broad
and the values of the best lognormal fits to the data are listed
in Table 2. The lognormal distribution is compatible with the
pulse areas and the amplitudes.
from
250 GRBs, summed over two detectors, and the best lognormal fits
are given in Figs. 9 and 10. The distributions are very broad
and the values of the best lognormal fits to the data are listed
in Table 2. The lognormal distribution is compatible with the
pulse areas and the amplitudes.
The distribution of the time intervals
between the pulses is given in Fig. 11. The peak in the
distribution occurred at about 1.0 s and was truncated at short
time intervals by the 64 ms resolution of the data (Fig. 11a). A
minimum time interval of 128 ms is required because two maxima
must be separated by at least one time bin. There could be a
large additional excess of pulses with separations below the 128 ms resolution of the data that were not resolved. Other studies
using different statistical methods from those employed here
(Panaitescu et al. 1999; Lee et al. 2000a,b; Spada et al. 2000) have also noted a
deficit of time intervals below one second. A parent lognormal
distribution of time intervals with parameters similar to the
observed distribution was simulated and the time intervals
between the pulses recorded with an accuracy of 64 ms. The
resulting distribution is given in Fig. 11a and the values of
![]() and
and ![]() for the parent distribution are given in
Table 2. The measured distribution of time intervals in GRBs is
consistent with the parent lognormal distribution provided a small
(5%) excess of time intervals longer than 15 s is not
included. This excess is clearly visible in Fig. 11a. The time
intervals greater than 15 s are plotted in Fig. 11b. The data is
well fit by a power law of slope -1.2.
for the parent distribution are given in
Table 2. The measured distribution of time intervals in GRBs is
consistent with the parent lognormal distribution provided a small
(5%) excess of time intervals longer than 15 s is not
included. This excess is clearly visible in Fig. 11a. The time
intervals greater than 15 s are plotted in Fig. 11b. The data is
well fit by a power law of slope -1.2.
The values of the peak energy,
![]() ,
of a large sample of GRBs are given by Preece et al. (2000).
There is an overlap of 77 GRBs with our sample, and the
distribution of the values of
,
of a large sample of GRBs are given by Preece et al. (2000).
There is an overlap of 77 GRBs with our sample, and the
distribution of the values of
![]() for each section of
these bursts are given in Fig. 12. The distribution was well fit
by a lognormal distribution with a small tail noticeable at low
values of
for each section of
these bursts are given in Fig. 12. The distribution was well fit
by a lognormal distribution with a small tail noticeable at low
values of
![]() .
The values of
.
The values of ![]() and
and ![]() are
given in Table 2. The distribution of
are
given in Table 2. The distribution of
![]() is
noticeably narrower than that of the pulse parameters and spans a
range of about 4 in width.
is
noticeably narrower than that of the pulse parameters and spans a
range of about 4 in width.
![\begin{figure}
\par\includegraphics[angle=-90,width=13.5cm,clip]{h3056f16.eps}\end{figure}](/articles/aa/full/2002/14/aah3056/img65.gif) |
Figure 12: The distribution of the peak energies and the best lognormal fit to the data (dashed line). |
The major result of this part of the analysis is that the
distributions of the rise times, fall times, FWHM, pulse
amplitudes, pulse areas and the time intervals between the pulses
are all very similar. The frequency distributions are very broad
and cover about three orders of magnitude and all are compatible
with the lognormal distribution. Li & Fenimore (1996) also showed
that the pulse fluences and the time intervals between pulses are
lognormally distributed for individual bursts in a small sample
of bursts with more than 20 pulses. They also scaled the bursts
to the same ![]() and
and ![]() and showed that the summation of
all the peak fluences and time intervals looked lognormal,
although no significance level was given for the result. No
normalisation of pulse properties was applied to the GRBs in this
analysis, because only the brightest 319 bursts which had the
best signal to noise ratio were analysed. From the data available
for those bursts with known redshifts (Atteia et al. 1999), there
does not appear to be any dependable standard by which to scale
the bursts because of the broad range of intrinsic luminosities
and their comparatively small range of distances. Therefore, to
avoid introducing further biases, and to use all of the pulse
information available, the data were analysed without scaling.
However, as a test of this process, the data were also scaled and
the same analysis performed on the scaled data, and no
significant differences were found between the two data sets.
and showed that the summation of
all the peak fluences and time intervals looked lognormal,
although no significance level was given for the result. No
normalisation of pulse properties was applied to the GRBs in this
analysis, because only the brightest 319 bursts which had the
best signal to noise ratio were analysed. From the data available
for those bursts with known redshifts (Atteia et al. 1999), there
does not appear to be any dependable standard by which to scale
the bursts because of the broad range of intrinsic luminosities
and their comparatively small range of distances. Therefore, to
avoid introducing further biases, and to use all of the pulse
information available, the data were analysed without scaling.
However, as a test of this process, the data were also scaled and
the same analysis performed on the scaled data, and no
significant differences were found between the two data sets.
It is important to determine how N relates to the other parameters
of the GRB. In Fig. 13 N is plotted versus burst duration
(T90), total fluence and the median value of
![]() .
Spearman rank order correlation coefficients
.
Spearman rank order correlation coefficients ![]() and
associated probabilities were obtained for the quantities in
Fig. 13. The values are listed in Table 3 which also includes an
additional range of burst parameters. The parameter
and
associated probabilities were obtained for the quantities in
Fig. 13. The values are listed in Table 3 which also includes an
additional range of burst parameters. The parameter
![]() is the maximum value of the peak amplitude in that burst. The high
values of
is the maximum value of the peak amplitude in that burst. The high
values of ![]() show a strong correlation between N and the total
fluence, T90 and
show a strong correlation between N and the total
fluence, T90 and
![]() .
.
![\begin{figure}
\par\includegraphics[width=17cm,clip]{3056f13.eps}\par\end{figure}](/articles/aa/full/2002/14/aah3056/img67.gif) |
Figure 13: The number of pulses in a GRB as a function of a) T90 b) total fluence and c) the median value of the peak energy of the GRB. Quantisation occurs in the figures for low values of N. |
| Properties | Probability | |
| N vs. T90 | 0.45 |
|
| N vs. Total Fluence | 0.58 |
|
| N vs. C
|
0.27 |
|
| N vs. Hardness Ratio | 0.29 |
|
| N vs. E
|
0.49 |
|
| T90 vs. Total Fluence | 0.52 |
|
| T90 vs. C
|
-0.08 | 0.16 |
| T90 vs. Hardness Ratio | 0.11 | 0.05 |
| Total Fluence vs. C
|
0.48 |
|
| Total Fluence vs. Hardness Ratio (HR) | 0.56 |
|
|
|
0.25 |
|
| Properties | Probability | |
| Rise Time vs. Fall Time | 0.64 | <10-48 |
| Rise Time vs. FWHM | 0.65 | <10-48 |
| Rise Time vs. Pulse Area | 0.34 |
|
| Rise Time vs. Pulse Amplitude | -0.27 |
|
| Fall Time vs. FWHM | 0.70 | < 10-48 |
| Fall Time vs Pulse Area | 0.42 | <10-48 |
| Fall Time vs. Pulse Amplitude | -0.22 |
|
| FWHM vs. Pulse Area | 0.44 | <10-48 |
| FWHM vs. Pulse Amplitude | -0.27 |
|
| Pulse Area vs. Pulse Amplitude | 0.63 | <10-48 |
| FWHM vs. Time Interval | 0.58 | 10-48 |
The values of ![]() are not always uniformly distributed within
each burst category. T90 versus fluence is much better
correlated for category N than either O or P. N versus
are not always uniformly distributed within
each burst category. T90 versus fluence is much better
correlated for category N than either O or P. N versus
![]() and N versus HR are better correlated for category P than
either N or O.
and N versus HR are better correlated for category P than
either N or O.
The Spearman rank order correlation coefficients and probabilities
were evaluated for isolated pulses with the range of pulse
parameters given in Table 4. The pulse parameters are strongly
correlated with each other. The pulse amplitude is negatively
correlated with the pulse rise and fall times and FWHM. In
general the correlations are stronger for categories M and N than
either O or P. The only significant exception to this trend is
the pulse amplitude versus area which also has the highest values
of ![]() for categories O and P.
for categories O and P.
| Number of | Total | ||
| Intervals | Number | Probability | |
| 1 | 2751 | 0.42/0.56 | <10-48 |
| 2 | 2499 | 0.34/0.48 | <10-48 |
| 5 | 1929 | 0.24/0.37 |
|
| 10 | 1395 | 0.20/0.29 |
|
| 15 | 890 | 0.16/0.25 |
|
| 20 | 634 | 0.10/0.23 |
|
| 25 | 459 | 0.08/0.22 |
|
| 30 | 322 | 0.03/014 |
|
| Number of | Total | ||
| Amplitudes | Number | Probability | |
| 1 | 3039 | 0.72/0.57 | <10-48 |
| 3 | 2499 | 0.55/0.32 | <10-48 |
| 5 | 2098 | 0.52/0.24 | <
|
| 7 | 1777 | 0.48/0.15 | <
|
| 9 | 1510 | 0.43/0.08 | <
|
| 10 | 1395 | 0.44/0.08 | <
|
Spearman rank order correlation coefficients and probabilities
were evaluated for the time intervals between pulses (![]() )
with
)
with
![]() .
The results are presented in Table 5 for two cases (1) the time intervals were not normalised and (2)
the time intervals were normalised to T90. There is a good
correlation between the time intervals in both cases that
declines slowly with increase in the number of time intervals.
The largest values of
.
The results are presented in Table 5 for two cases (1) the time intervals were not normalised and (2)
the time intervals were normalised to T90. There is a good
correlation between the time intervals in both cases that
declines slowly with increase in the number of time intervals.
The largest values of ![]() occured in category N.
occured in category N.
The Spearman correlation coefficients were also evaluated between
pulse amplitudes and the results are given in Table 6 for two
cases (1) the amplitudes were not normalised and (2) normalised
to the largest amplitude pulse in the burst. The normalised
pulse amplitudes are less strongly correlated over many pulses
than the time intervals. These results were obtained for all
pulses with
![]() and without satisfying any
selection based on pulse isolation. The role of pulse pile-up has
yet to be investigated.
and without satisfying any
selection based on pulse isolation. The role of pulse pile-up has
yet to be investigated.
![\begin{figure}
\par\includegraphics[width=8.4cm,clip]{h3056f20.eps} \end{figure}](/articles/aa/full/2002/14/aah3056/img94.gif) |
Figure 14: The median values of a) rise time, b) fall time, c) FWHM and d) the time intervals between pulses versus the number of pulses. |
It was noticed early in this analysis that pulse properties
depended strongly on N (Quilligan et al. 2000). The median value
of the isolated pulse timing parameters were determined for all
GRBs with the same value of N. The median values of the rise
time, fall time, FWHM and time interval between pulses are plotted
versus N in Fig. 14 (a-d). The largest value usually occurred for
N = 1 or 2 and subsequently declined significantly as Nincreased. There are some values that are well removed from the
general trend but they usually have a small number of pulses. The
median values of the area and amplitude for isolated pulses are
given in Figs. 15a,b. The trend is quite different from Fig. 14. The amplitude is reasonably constant up to ![]() with a clear increase for higher values of N. There is a similar
but weaker trend for the pulse area which has the largest value
at N = 1.
with a clear increase for higher values of N. There is a similar
but weaker trend for the pulse area which has the largest value
at N = 1.
The properties of the four categories of GRBs are summarised in
Table 7. The median values of the pulse timing parameters all
decrease by at least a factor of four from category M to P. In
contrast the median values of T90, total fluence, hardness
ratio and maximum pulse amplitude all increase significantly. The
median variability, is defined as the number of pulses ![]() 5
5 ![]() divided by the time the emission is
divided by the time the emission is ![]() 5
5 ![]() ,
also increases from category M to P.
,
also increases from category M to P.
| GRB Category | M | N | O | P |
| Number of Pulses per GRB | 1-2 | 3-12 | 13-24 | 25+ |
| Number of GRBs | 67 | 162 | 56 | 34 |
| Total number of pulses | 103 | 981 | 933 | 1341 |
| Number of isolated pulses at 50% level | 83 | 522 | 476 | 494 |
| Median T90 (s) | 18.1 | 20.4 | 45.7 | 58.7 |
| Median Total Fluence (ergs/cm2) | 8.8
|
1.7
|
4.2
|
|
| Median hardness ratio (Chan
|
3.4 | 4.1 | 6.5 | 8.3 |
| Median
|
4.7 | 6.1 | 9.3 | 12.6 |
| Median Variability | 0.09 | 0.29 | 0.39 | 0.53 |
| Median Rise Time (s) | 1.7 | 0.8 | 0.64 | 0.45 |
| Median Fall Time (s) | 5.2 | 1.5 | 1.0 | 0.7 |
| Median FWHM (s) | 1.8 | 0.7 | 0.64 | 0.45 |
| Median Time Interval (s) | 4.8 | 1.9 | 1.5 | 1.0 |
| Number of GRBs | 55 | 130 | 38 | 27 |
| Total number of pulses | 87 | 778 | 648 | 1081 |
| Number of isolated pulses at 50% level | 70 | 416 | 319 | 404 |
| Median Pulse Amplitude (Iso. pulses) (counts) | 13
|
7.3
|
7.3
|
9.5
|
| Median Area (counts) | 560
|
180
|
140
|
140
|
| GRB Category | N | O | P |
| Number of Pulses per GRB | 3-12 | 13-24 | 25+ |
| Total Number of Pulses (1st/2nd half) | 404/415 | 384/493 | 679/628 |
| Total Number of Isolated Pulses (50%) (1st/2nd half) | 193/220 | 182/261 | 203/271 |
| Total Number of Isolated Pulses (75%) (1st/2nd half) | 79/126 | 77/101 | 71/83 |
| Median Rise Time (1st/2nd half) | 1.02/0.70 | 0.77/0.58 | 0.51/0.45 |
| K-S Statistic/Probability | 0.13/5% | 0.12/9% | 0.11/11% |
| Median Fall Time (1st/2nd half) | 1.09/1.89 | 0.90/1.22 | 0.70/0.70 |
| K-S Statistic/Probability | 0.20/.02% | 0.15/2% | 0.11/10% |
| Median Asymmetry Ratio (1st/2nd half) | 1.0/0.4 | 0.75/0.49 | 0.75/0.54 |
| K-S Statistic/Probability | 0.27/
|
.17/0.3% | 0.14/1.5% |
| Median FWHM (1st/2nd half) | 0.77/0.67 | 0.64/0.64 | 0.51/0.45 |
| K-S Statistic/Probability | 0.08/55% | 0.08/52% | 0.11/11% |
| Median Time Interval (1st/2nd half) | 1.60/2.10 | 1.41/1.54 | 1.02/1.02 |
| K-S Statistic/Probability | 0.13/2% | 0.06/35% | 0.05/30% |
| Median Pulse Amplitude (
|
6.2/5.4 | 7.3/6.8 | 18.1/11.2 |
| K-S Statistic/Probability | 0.09/41% | 0.08/52% | 0.09/25% |
| Median Area (
|
151/127 | 133/118 | 152/130 |
| K-S Statistic/Probability | 0.08/50% | 0.07/59% | 0.14/2% |
To study the evolution of the time profile as the GRB progresses, each GRB was divided into two, to include the pulses that occur before and after the strongest pulse in the burst. Only GRBs with more than two pulses are included, resulting in a reduced total sample of 252. The first half (pre-main pulse) of the GRB was compared with the second half (post-main pulse). The bursts are also sub-divided into three categories. A summary of the properties of the GRBs used is given in Table 8.
The first half/second half analysis was performed on the three timing parameters of the pulses, time intervals between the pulses, amplitude, area and the pulse asymmetry ratio which is defined as the ratio of the pulse rise time to the pulse fall time. The median values of the distributions in the three categories in the first half and second half analysis are given in Table 8 along with the results of the Kolmogorov-Smirnov (KS) tests. The KS probability is a measure of whether the two distributions (first/second half) are drawn from the same parent distribution.
The first result is that the median values of the timing parameters of the pulses and the time intervals between the pulses all decrease by an average of 1.8, from the category N to P including the first half and second half of the GRBs. In the case of the rise times, the median values of the distributions decrease from 1.02 to 0.51 in the first half and 0.70 to 0.45 in the second half. The trend in the median value of the pulse amplitude is in the opposite direction with larger pulses in category P than either O or N.
In the first/second half analysis there is a trend in the three categories for the median rise time to be slower in the first half of the burst (1.02 versus 0.70 for category N). The difference could be caused by an additional clearing out effect at the start of the GRB. There is also a clear indication at the 0.02% level that the pulse fall time is faster in the first half than the second for category N (1.09 versus 1.89 for category N) and this effect weakens for categories O and P. The median values of the pulse asymmetry ratio also show the most significant differences for category N where the median values are 1.0 and 0.4 for the first and second halves. The KS test gives good agreement between the first half and second half for the FWHM, time intervals between pulses, the pulse amplitudes and areas. The median values of the pulse amplitude and areas are however larger in the first half than the second half for the three categories of GRBs.
Copyright ESO 2002
![\begin{figure}
\par\includegraphics[width=7.6cm,clip]{h3056f8.eps} \end{figure}](/articles/aa/full/2002/14/aah3056/img55.gif)
![\begin{figure}
\par\psfrag{xlab}[b]{\small$t_{\rm r}$\space (sec)}
\psfrag{ylab}...
...{\small Frequency}
\includegraphics[width=11.2cm,clip]{h3056f10.eps}\end{figure}](/articles/aa/full/2002/14/aah3056/img60.gif)
![\begin{figure}
\par\psfrag{xlab}[b]{\small Pulse Amplitudes (counts)}
\psfrag{y...
...{\small Frequency}
\includegraphics[width=8.8cm,clip]{h3056f12.eps} \end{figure}](/articles/aa/full/2002/14/aah3056/img62.gif)
![\begin{figure}
\par\psfrag{xlab}[b]{\small Pulse Areas (counts)}
\psfrag{ylab}[b]{\small Frequency}
\includegraphics[width=8.8cm,clip]{h3056f13.eps} \end{figure}](/articles/aa/full/2002/14/aah3056/img63.gif)
![\begin{figure}
\par\includegraphics[angle=-90,width=13.4cm,clip]{h3056f14.eps}\v...
...centage}
\includegraphics[angle=-90,width=13.4cm,clip]{h3056f15.eps}\end{figure}](/articles/aa/full/2002/14/aah3056/img64.gif)