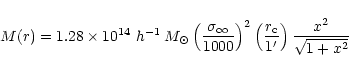
We compared our results with X-ray and virial analyses. From Fig. 4 of Lewis et al., we see that within 175 h-1 kpc (1 arcmin) radius the mass inferred from
X-ray emissivity is
![]() which is a
factor of 2 lower than the minimum estimate from our shear analysis,
which is a
factor of 2 lower than the minimum estimate from our shear analysis,
![]() (CL = 90%).
(CL = 90%).
The agreement is better on larger scales. Both estimates increase monotonically
and reach
![]() and a
lower limit of
and a
lower limit of
![]() (CL = 90%)
at
r = 350 h-1 kpc (2 arcmin). At that radius, which is the limiting
distance to which the
X-ray data are reliable, the relative discrepancy of
(CL = 90%)
at
r = 350 h-1 kpc (2 arcmin). At that radius, which is the limiting
distance to which the
X-ray data are reliable, the relative discrepancy of ![]() 20% is within the
errors. However, even if we assume that the 20% difference is real and constant
beyond
r = 350 h-1 kpc, the baryon fraction only changes from
20% is within the
errors. However, even if we assume that the 20% difference is real and constant
beyond
r = 350 h-1 kpc, the baryon fraction only changes from
![]() quoted by Lewis et al. (1999) to
quoted by Lewis et al. (1999) to
![]() .
.
We compared the mass profile inferred from the shear analysis to several model mass profiles. These model curves have been plotted on the observed mass profile in Fig. 13. We note that the tightest constraint on the profiles occur at small radii. The error bars are too large to really discriminate between the models at large radii. For this reason and others described below we have plotted several models on the data and discussed them in some detail.
One drawback is the marginal detection (
![]() )
of shear in the outermost
annulus. It may just be random fluctuation - sections of this annulus lie
outside the image or on the masks and so it contains fewer galaxies than it
otherwise would
have; indeed its error-bar is a third again as much as that of its neighbour.
On the other hand, this is perhaps an indication that the mass extends out
beyond the edge of the field. If so, we will have a radius dependence to the
mass underestimation (
)
of shear in the outermost
annulus. It may just be random fluctuation - sections of this annulus lie
outside the image or on the masks and so it contains fewer galaxies than it
otherwise would
have; indeed its error-bar is a third again as much as that of its neighbour.
On the other hand, this is perhaps an indication that the mass extends out
beyond the edge of the field. If so, we will have a radius dependence to the
mass underestimation (
![]() )
which is not expected to be significant at
small radii but could be considerable at the outer points. However, we note
that our models, which are basically constrained by the inner points, are not
very different from the observed profile at large radii. So unless profiles in
the real Universe are very different from those plotted in Fig. 13 the total mass (including the "missed'' fraction) should
lie within the upper limits of the present error-bars.
The second problem is the presence of the background cluster
described previously in the depletion analysis. Clearly, its (unknown)
contribution to the projected mass density, at
)
which is not expected to be significant at
small radii but could be considerable at the outer points. However, we note
that our models, which are basically constrained by the inner points, are not
very different from the observed profile at large radii. So unless profiles in
the real Universe are very different from those plotted in Fig. 13 the total mass (including the "missed'' fraction) should
lie within the upper limits of the present error-bars.
The second problem is the presence of the background cluster
described previously in the depletion analysis. Clearly, its (unknown)
contribution to the projected mass density, at ![]() 1 arcmin from the mass
centroid, has to be subtracted before fitting a model profile.
1 arcmin from the mass
centroid, has to be subtracted before fitting a model profile.
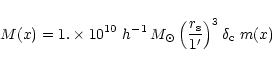
In the upper two panels of Fig. 13 we have plotted
Pseudo-isothermal sphere (PIS) models on the observed profile. For
![]() the PIS profile is given by:
the PIS profile is given by:
 |
(15) |
Carlberg et al. (1996) measured
![]() kms-1
and our estimate, though somewhat smaller, is consistent with theirs. Their
velocity dispersions (of MS 1008-1224 and other clusters) were in general
considerably less than previous estimates. The agreement between our value and
theirs suggests that their algorithm and prescriptions were reliable.
kms-1
and our estimate, though somewhat smaller, is consistent with theirs. Their
velocity dispersions (of MS 1008-1224 and other clusters) were in general
considerably less than previous estimates. The agreement between our value and
theirs suggests that their algorithm and prescriptions were reliable.
The universal profile (NFW) has been plotted on the observed profile in the
bottom panel of Fig. 13. The NFW profile may be expressed for
this cluster as:
 |
(16) |
Figure 17 shows the radial luminosity profile of cluster galaxies
selected from the Colour-Magnitude plot.
![\begin{figure}
\par\includegraphics[width=6.8cm,clip]{ms1776f17.eps}
\end{figure}](/articles/aa/full/2002/12/aa1776/img188.gif) |
Figure 17:
Top panel: radial distribution of the total I-band
luminosity of MS 1008-1224 galaxies located on the cluster sequence on the
Colour-Magnitude plot. The solid line is the best fit straight line (see Sect. 5). Bottom panel: the observed Mass-to-Light ratio profile of MS 1008-1224
determined from weak-lensing mass and I-band luminosity (note: the M/L value
scales with the Hubble factor h). The curves are model mass profiles divided
by the linear fit to the observed luminosity profile : the solid line represents
the NFW model plotted in bottom panel of Fig. 13 while the dotted
lines represent the PIS models in the middle panel of 13 (lower
core radius values make for flatter curves at small radii).
The vertical bars represent |
The light profile is remarkably linear. Hoesktra et al. (1998) found similar
results for Cl1358+62. The best fit to the profile gave a slope of
![]() arcmin and a y-intercept of
arcmin and a y-intercept of
![]() (CL = 90%) which is
consistent with zero.
(CL = 90%) which is
consistent with zero.
The radial profile of the mass-to-light ratio, M/L, is also shown in Fig. 17. At
r = 350 h-1 kpc (2 arcmin) from the cluster center,
![]() .
Extrapolating the outermost data points provides a
value of
.
Extrapolating the outermost data points provides a
value of
![]() at
r = 700 h-1 kpc (4 arcmin). This
value must be scaled to a value appropriate for the r-band used in Carlberg et al. We find that our equivalent estimate of
at
r = 700 h-1 kpc (4 arcmin). This
value must be scaled to a value appropriate for the r-band used in Carlberg et al. We find that our equivalent estimate of
![]() is in
good agreement with the value of (
is in
good agreement with the value of (
![]() from the CNOC analysis
(all errors
from the CNOC analysis
(all errors ![]() ).
).
There is not much additional information (beyond that provided by the mass
profile) to be had by fitting model profiles to this quantity. However, this
plot brings out in a more obvious way the points we made when discussing the
mass profile. The NFW model provides a better fit to the M/L profile than the
PIS models because for a linear luminosity profile the M/L for the NFW model
has the functional form
![]() which has a maximum at some
intermediate point. The strong constraint exercised by the innermost data point
on the allowed core-radius values (PIS models : 40-110 h-1 kpc) and the
excess of mass on intermediate scales (for both NFW and PIS models) are also
seen more clearly.
which has a maximum at some
intermediate point. The strong constraint exercised by the innermost data point
on the allowed core-radius values (PIS models : 40-110 h-1 kpc) and the
excess of mass on intermediate scales (for both NFW and PIS models) are also
seen more clearly.
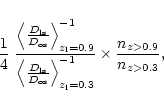
The origin of this excess at 1 arcmin radius may be due to the second cluster at z = 0.9 which increases the gravitational amplification and shear of galaxies at z > 1 and located within 1 arcmin of the mass centroid. From the depletion point of view the most distant galaxies are deflected twice which increases the depth and the angular size of the depleted area. From the gravitational shear point of view, the increase in distortion due to the second cluster could have been mistakenly ascribed to the stronger gravitational potential of MS 1008-1224. This could explain why the mass from the weak lensing analysis, and therefore the radial distribution of the mass-to-light ratio shown in Fig. 17, increases rapidly at small radii (r < 1 arcmin) despite a linear increase of the cluster luminosity. A similar effect is also discernable in the depletion which has a very steep growth curve.
The discrepancy between X-ray and lensing mass only appears on small scales. Also with our weak-lensing mass estimate it is only a factor of 2 which is significantly lower than the factor 3.7 obtained by Wu & Fang (1997) from the analysis of strong lensing features. The decrease of the discrepancy with radius seems to be a general trend which has already been reported (Athreya et al. 1999; Lewis 1999, see Mellier 1999 and references therein). It must be noted that in most of the studies reporting a discrepancy the comparison has been done between X-ray and strong-lensing (not weak-lensing) analyses.
Some of the discrepancy observed in MS 1008-1224 can be produced by the distant
cluster behind it. However, such a projection effect, similar to those discussed
by Reblinsky & Bartelmann (1999), cannot explain the factor of 2 discrepancy
because (i) the distant cluster occupies only a small fraction of the lensed
area (1 quadrant of the ISAAC field) and (ii) only background galaxies at z >
0.9 are magnified twice. An upper limit to the magnitude of its impact on the
mass estimate is roughly the ratio
 |
(17) |
It is worth noting that apart from this distant cluster contamination by other projection effects are not visible at the center where photometric redshifts provide a good idea of the clustering along the line of sight. The ISAAC field encompasses the region where strong lensing features are visible and where the mass estimate from lensing exceeds the X-ray prediction. We find no evidence that biases like the ones proposed by Cen (1997) or Metzler (1999) are significant in the central region.
There is compelling evidence that the center of mass does not coincide with the cD galaxy:
The contours of isoluminosity and number density are clearly clumpy and extend
northward of the cD galaxy, as do the contours in our mass maps and in the
X-ray maps of Lewis et al. (1999) ![]() all pointers toward a dynamically
unstable and perhaps merging system. If so, the hot gas is unlikely to be in
equilibrium. A merging process produces shocks and gas flows between clumps,
such as those seen in Schindler & Müller's simulations (1993) or those
reported by Kneib et al. (1996) and Neumann & Böhringer (1999) in the
lensing cluster A2218.
all pointers toward a dynamically
unstable and perhaps merging system. If so, the hot gas is unlikely to be in
equilibrium. A merging process produces shocks and gas flows between clumps,
such as those seen in Schindler & Müller's simulations (1993) or those
reported by Kneib et al. (1996) and Neumann & Böhringer (1999) in the
lensing cluster A2218.
Athreya et al. (1999) reported very similar trends in Abell 370: good agreement between X-ray and weak lensing mass estimates on large scales and a factor of 2 discrepancy near the centre. A370 is clearly composed of merging clumps and they ascribed the X-ray - lensing discrepancy to an oversimplified model of the hot gas in the inner regions. We suspect a similar case in the inner regions of MS 1008-1224. This, as suggested earlier by Miralda-Escudé & Babul (1995), explains the good agreement on large scales between the weak lensing, the X-ray and also the virial mass (see Lewis et al. 1999) and the apparent contradiction between X-ray and strong lensing.
We cannot rule out the possibility that the clumps in MS 1008-1224 are close to each other only in projection. The lensing signal due to a collinear collection of condensates would mimic that of an equivalent projected mass density lens but the X-ray mass estimate would be considerably lower. This would be a more appropriate explanation if the lensing mass missed by this analysis because of the small field of view is considerable.
Copyright ESO 2002