We identify three powerful near-infrared H2 outflows which we will call "H2 jets'', as shown in Fig. 6. These are designated the H, N and Q jets. The Q H2 jet has been previously reported in the NIR by Moreira & Yun (1995). Note the proximity of optical HH objects to the H jet. Note also that there are several knots of H2 emission not directly identified with these jets (e.g. T and G Fig. 15) which may belong to further jets. Here, however, we remain conservative, requiring the presence of at least four aligned knots before we declare an H2 jet.
The 2.12 ![]() m emission line is from the 1-0 S(1) transition of
molecular hydrogen. This arises from vibrationally excited H2,
probably with a temperature in the range 1000-3000K,
excited in the remote locations by shock waves. No local source
of UV radiation to suggest fluorescent excitation is present near
the majority of H2 knots. The shocks are being driven, however,
from distant protostars through jets or accumulated gas in bullets.
m emission line is from the 1-0 S(1) transition of
molecular hydrogen. This arises from vibrationally excited H2,
probably with a temperature in the range 1000-3000K,
excited in the remote locations by shock waves. No local source
of UV radiation to suggest fluorescent excitation is present near
the majority of H2 knots. The shocks are being driven, however,
from distant protostars through jets or accumulated gas in bullets.
The H and N jets have required wide-field cameras to be
revealed. They alter our view of the evolution of the Bok
globule. These two jets are considerably longer than the
Q jet. We assume here a distance to CB34 of 1500pc
(Carpenter et al. 1995) to yield projected sizes of
1.59pc (219
![]() )
for H1-H6, 1.39pc (191
)
for H1-H6, 1.39pc (191
![]() )
N1-N8 and
1.17pc (140
)
N1-N8 and
1.17pc (140
![]() )
Q5-Q4-HH290N1. We find no evidence for further
extensions to these jets out to a scale of 5
)
Q5-Q4-HH290N1. We find no evidence for further
extensions to these jets out to a scale of 5
![]() .
Supposing a total expansion speed of 100kms-1 yields
dynamical ages of just 1.2-1.4
.
Supposing a total expansion speed of 100kms-1 yields
dynamical ages of just 1.2-1.4![]() 104yr. This would indicate
that the driving protostars are in the late Class 0 regime.
This age is misleading, however, since the outer parts of
the outflows decelerate in the Class 1 stage. Class 1 near
infrared outflows are not significantly longer than Class
0 outflows (Stanke 2000), consistent with models which
account for outflow deceleration (Smith 2000).
104yr. This would indicate
that the driving protostars are in the late Class 0 regime.
This age is misleading, however, since the outer parts of
the outflows decelerate in the Class 1 stage. Class 1 near
infrared outflows are not significantly longer than Class
0 outflows (Stanke 2000), consistent with models which
account for outflow deceleration (Smith 2000).
One of the most striking features is the high collimation
of the H2 jets. Angles subtended by individual
components, as well as the overall collimation, of the H and N jets
are less than three degrees. We define a collimation angle
which is independent of the location of the driving source.
This is: collimation angle = arctan(maximumtransverseextent/totallinearextent).
This yields collimation angles of 2.7![]() (H-flow)
and 2.3
(H-flow)
and 2.3![]() (N-flow).
Recent three dimensional simulations of
hydrodynamic molecular jets show very high collimation, with
jet material being focussed while ambient gas is swept aside
(Rosen & Smith 2001).
(N-flow).
Recent three dimensional simulations of
hydrodynamic molecular jets show very high collimation, with
jet material being focussed while ambient gas is swept aside
(Rosen & Smith 2001).
The energy of the CO J=1-0 outflow, scaled to the distance of 1500pc, is
1.8![]() 1045erg (Yun & Clemens 1994) and
the CO momentum is 26.3
1045erg (Yun & Clemens 1994) and
the CO momentum is 26.3 ![]() kms-1.
Yun & Clemens (1994) derived a mechanical
luminosity
kms-1.
Yun & Clemens (1994) derived a mechanical
luminosity
![]()
![]() and a dynamical age of
just 3.8
and a dynamical age of
just 3.8![]() 104 years for the CO. This, however,
assumed the existence of a high velocity wind rather than the
measured CO speed of
104 years for the CO. This, however,
assumed the existence of a high velocity wind rather than the
measured CO speed of ![]() 5kms-1. The latter speed, as
usually assumed to calculate CO dynamical ages, is confirmed here
in our CO J=2-1 velocity channel maps (see below). The dynamical age is
then 7.6
5kms-1. The latter speed, as
usually assumed to calculate CO dynamical ages, is confirmed here
in our CO J=2-1 velocity channel maps (see below). The dynamical age is
then 7.6![]() 105 years. The mechanical luminosity is reduced to
105 years. The mechanical luminosity is reduced to
![]()
![]() and the momentum flow rate becomes
and the momentum flow rate becomes
![]()
![]() kms-1yr-1.
This is a moderately high momentum flux, and would typically be driven from
a Class 1 protostar of bolometric luminosity 10
kms-1yr-1.
This is a moderately high momentum flux, and would typically be driven from
a Class 1 protostar of bolometric luminosity 10![]() or a Class 0
protostar of luminosity 1
or a Class 0
protostar of luminosity 1![]() (e.g. Smith 2000). The
submillimetre cores could certainly contain either object, since their
bolometric luminosities are 40
(e.g. Smith 2000). The
submillimetre cores could certainly contain either object, since their
bolometric luminosities are 40![]() (SMM1) and 20
(SMM1) and 20![]() (SMM4).
(SMM4).
The total luminosities in the H2 1-0 S(1) line are
![]()
![]() (H flow) and
(H flow) and
![]()
![]() (N flow), on
summing up the individual knot luminosities. Applying factors based
on general models,
these values convert
to total shocked H2 radiation of
(N flow), on
summing up the individual knot luminosities. Applying factors based
on general models,
these values convert
to total shocked H2 radiation of
![]()
![]() per
outflow, for typical C-type or J-type shocks (Smith 1995). We
then estimate that the total shock power from all molecular and neutral
atomic species (CO, H2O, O[I], etc.) is
per
outflow, for typical C-type or J-type shocks (Smith 1995). We
then estimate that the total shock power from all molecular and neutral
atomic species (CO, H2O, O[I], etc.) is ![]() 2-
2-
![]() per outflow (Smith 1991). We assume here that the
outflows are predominantly located on the edges of the globule where
there will be no significant infrared extinction. Thus, the mechanical
and shocked luminosities are comparable given an outflow age of
7.6
per outflow (Smith 1991). We assume here that the
outflows are predominantly located on the edges of the globule where
there will be no significant infrared extinction. Thus, the mechanical
and shocked luminosities are comparable given an outflow age of
7.6![]() 105 yr. Such a relationship is expected when an outflow
is jet-driven for long extended periods. At this age, however, we
could expect that the outflow has had time to amass a reservoir of
CO gas whereas only feeble shocked H2 gas would be detected as the
jets' power diminishes. Hence, we suggest that the present shocked
H2 is being generated from a younger outflow while previous bipolar
outflows dominate the CO emission. Such a conclusion would apply to any
region where there are multiple outflows.
105 yr. Such a relationship is expected when an outflow
is jet-driven for long extended periods. At this age, however, we
could expect that the outflow has had time to amass a reservoir of
CO gas whereas only feeble shocked H2 gas would be detected as the
jets' power diminishes. Hence, we suggest that the present shocked
H2 is being generated from a younger outflow while previous bipolar
outflows dominate the CO emission. Such a conclusion would apply to any
region where there are multiple outflows.
![\begin{figure}
\par\includegraphics[width=12cm,clip]{h2952f06.eps} \end{figure}](/articles/aa/full/2002/08/aah2952/img34.gif) |
Figure 6: Schematic map of the H, N and Q near-infrared H2 outflows in CB34. The squares are H2 knots discovered here. All other symbols are the same as in Fig. 1. |
We remark that the age estimated from the CO outflow would be sufficient for jets to penetrate out to many tens of parsecs, given a propagation speed of 40kms-1. This suggests that molecular flows reach a limiting size of 1-5 parsecs during the Class 0/1 phase, and then shrink in apparent size as the largest scale structure becomes disconnected from the source and rapidly fades. Then, during the Class 2 phase the outflows are further reduced to of order 0.1pc, as measured (Hogerheijde et al. 1998). Evidence is presented below that the observed infrared outflow is indeed of a similar size to the globule.
The new CO data displayed in Fig. 7 provide information on the cool
molecular gas which has been disturbed or swept up by the protostellar outflows.
Each map covers an interval of 1kms-1 around the inner
2![]() .
The overall structure of the high velocity lobes is very similar
to the maps presented by Yun & Clemens (1994) in the
12COJ=1-0 line. However, the south-western lobe of high
velocity gas (which is visible both in redshifted and blueshifted emission
at relatively low velocities) displays a clear bipolar morphology at higher
velocities, with a redshifted lobe extending to the south-east and a
blueshifted lobe to the north-west of the position of SMM1. This bipolar
flow seems to be fairly well collimated. Regarding the high-velocity gas
in the north-eastern part of the map, mainly red-shifted emission is detected
with this emission showing considerable substructure. Blue-shifted
emission is not or only marginally detected; better data might be useful to
further constrain the presence and distribution of high-velocity gas in the
north-eastern part of the cloud.
.
The overall structure of the high velocity lobes is very similar
to the maps presented by Yun & Clemens (1994) in the
12COJ=1-0 line. However, the south-western lobe of high
velocity gas (which is visible both in redshifted and blueshifted emission
at relatively low velocities) displays a clear bipolar morphology at higher
velocities, with a redshifted lobe extending to the south-east and a
blueshifted lobe to the north-west of the position of SMM1. This bipolar
flow seems to be fairly well collimated. Regarding the high-velocity gas
in the north-eastern part of the map, mainly red-shifted emission is detected
with this emission showing considerable substructure. Blue-shifted
emission is not or only marginally detected; better data might be useful to
further constrain the presence and distribution of high-velocity gas in the
north-eastern part of the cloud.
As opposed to aligned knots,
a true jet-type structure N6 is detected within the SMM4 core
(Fig. 15).
The compact knot located at the northern edge of N6 suggests that
the source of the N jet is located within this core. In fact, the Q and
N jets appear to cross at the position of SMM4.
We note that other knots are extended in the direction of the N6 jet, including H5 (Fig. 6). The extension of H5 towards H6 is evidence that these outer knots, aligned with the inner knots H1-H4, are indeed part of the H outflow rather than a chance conjunction. Knot H6 (Fig. 16a) is at the end of the observed H jet but does not possess a bow or arc structure. It would appear to be a structure within the supposed jet or along a cavity wall, with the jet actually extending beyond H6, out of the globule, although no further infrared structure south of the globule edge is found (see Figs. 16a, 14d and 1). Similarly, the knots extending to the north of the N jet possess no bow or cometary appearance, again suggesting that this jet has also exited from the globule.
These structures suggest an explanation for the strong asymmetry in
the jet extensions from the probable sources. If the cloud were
spheroidal with the N outflow near the rear surface, then N8 would demarcate
the location where the jet exits from the rear surface of the globule,
while N1 (Fig. 16b) would travel further through the globule to
reach and exit on the near surface. On the other hand, if the SMM1 core is
nearer to the front of the globule, then the receding southern H jet
(as suggested by the CO lobes) could exit from near the middle section of
the globule (see Fig. 1), producing a longer jet as it cuts
its way through more globule material. The forward-moving northern part of
the jet would then exit in a short length from the front of the cloud.
Hence, the asymmetries can be produced by the source locations within the
globule. Against this picture is the location of the optical knot
HH290S which is located in the receding N-flow (see Fig.6),
thus deep within the globule. The optical extinction is 5-15 mag. for
the embedded stars within the inner arcminute. HH290S is, however,
85
![]() south of the central star E (Fig.2, and lies in a
region associated with less reddened stars (Fig.2).
south of the central star E (Fig.2, and lies in a
region associated with less reddened stars (Fig.2).
Matching protostars to outflows and jets is not unique without spectroscopic information or proper motions. Furthermore, at the distance of CB34, each submillimetre source could consist of a group of protostars, as explicitly demonstrated by Huard et al. (2000).
Protostars in the SMM1 core may be responsible for both the H and Q
jets (Fig. 6). This core, of size ![]() 10
10
![]() ,
contains the IRAS source IRAS0540+2059 but was previously not associated with
near-infrared emission. It is flattened at 450
,
contains the IRAS source IRAS0540+2059 but was previously not associated with
near-infrared emission. It is flattened at 450 ![]() m with a minor
axis of 70
m with a minor
axis of 70![]() (Huard et al. 2000), almost orthogonal
to the Q-outflow of 68
(Huard et al. 2000), almost orthogonal
to the Q-outflow of 68![]() .
.
In contrast, the large-scale globule, on scales of 1-2 arcmin,
is flattened almost in the perpendicular direction to the core.
This is evident in the HCN molecule (148![]() ,
Afonso et al. 1998) and the far-infrared continuum (149
,
Afonso et al. 1998) and the far-infrared continuum (149![]() ,
Huard et al. 2000). In comparison, the orientations of
the H jet and N jet are both
,
Huard et al. 2000). In comparison, the orientations of
the H jet and N jet are both ![]() 150
150![]() .
Hence, the
major outflows are aligned with either their core or the globule
minor axis. It is also interesting to note that the parallel outflows
are also parallel to the galactic plane (152
.
Hence, the
major outflows are aligned with either their core or the globule
minor axis. It is also interesting to note that the parallel outflows
are also parallel to the galactic plane (152![]() ). In
contrast, the CO J=2-1 outflow from SMM1 has a rather badly
defined orientation of
). In
contrast, the CO J=2-1 outflow from SMM1 has a rather badly
defined orientation of ![]() 115-130
115-130![]() ,
which supports our
assertion above that the CO lobes are produced by several outflows
with a wide spread in ages while the H2 emission originates only
from the latest outflows.
,
which supports our
assertion above that the CO lobes are produced by several outflows
with a wide spread in ages while the H2 emission originates only
from the latest outflows.
The extent of the globule is found from the photometric results
(Fig.4). Analysis of our wide field reveals that the
the reddened stars (i.e. H-K> 1.0) lie predominantly within
a distance of ![]() 100
100
![]() from the globule centre,
(object E).
Slightly reddened stars (
1.0>H-K>0.7) extend out to
from the globule centre,
(object E).
Slightly reddened stars (
1.0>H-K>0.7) extend out to
![]() 200
200
![]() .
Furthermore, Fig.4 demonstrates
that the number of embedded stars (H-K>0.7)
per unit radius is roughly constant, with 18, 19, 17 and 12 objects
lying within the first four 50
.
Furthermore, Fig.4 demonstrates
that the number of embedded stars (H-K>0.7)
per unit radius is roughly constant, with 18, 19, 17 and 12 objects
lying within the first four 50
![]() radius intervals.
Hence the observed number per unit surface area is inversely proportional
to the radial distance.
This indicates that the reddened stars are internal to the globule,
not background.
radius intervals.
Hence the observed number per unit surface area is inversely proportional
to the radial distance.
This indicates that the reddened stars are internal to the globule,
not background.
The 200
![]() radius halo of stars can be generated from a
40
radius halo of stars can be generated from a
40
![]() radius core (i.e. the region containing
SMM1 and SMM4) in 4
radius core (i.e. the region containing
SMM1 and SMM4) in 4 ![]() 106yr, if stars formed at a
constant rate with an average radial expansion speed of
106yr, if stars formed at a
constant rate with an average radial expansion speed of
![]() 0.3kms-1. This speed would appear plausible,
given the relative motions observed in the core in the
H13CO+ line (Fig.8). Note that there
are fewer highly reddened stars to the south of object E,
suggesting that the star formation has shifted to the north by
a distance of 20
0.3kms-1. This speed would appear plausible,
given the relative motions observed in the core in the
H13CO+ line (Fig.8). Note that there
are fewer highly reddened stars to the south of object E,
suggesting that the star formation has shifted to the north by
a distance of 20
![]() (Fig.5). Clearly,
stars have been forming for a long time within CB34 and the
centre of activity may have shifted northwards from HH290IRS
to the vicinity of object E, while more dense gas still remains
further north.
(Fig.5). Clearly,
stars have been forming for a long time within CB34 and the
centre of activity may have shifted northwards from HH290IRS
to the vicinity of object E, while more dense gas still remains
further north.
The channel maps in H13CO+, a tracer of high density
material in dense cores, demonstrate some evidence for large-scale
rotation of 1.5kms-1 over 90
![]() (Fig.8). With this
interpretation, a mass of
(Fig.8). With this
interpretation, a mass of ![]()
![]() within a
radius of 45
within a
radius of 45
![]() is derived, where
is derived, where ![]() is the inclination of
the rotation axis to the line of sight. This is consistent with the
mass derived from CS measurements of 170
is the inclination of
the rotation axis to the line of sight. This is consistent with the
mass derived from CS measurements of 170![]() (Launhardt & Henning
1998). SMM4 is redshifted by 0.5kms-1 relative
to SMM1. SMM2 is also identified in this molecule.
(Launhardt & Henning
1998). SMM4 is redshifted by 0.5kms-1 relative
to SMM1. SMM2 is also identified in this molecule.
We also find complex internal velocity structure on the scale
of 10
![]() ,
in the
,
in the
![]() -0 line (Fig. 7).
This structure suggests that the inner 2
-0 line (Fig. 7).
This structure suggests that the inner 2
![]() of the globule
is being stirred up by many outflows. The numerous H2 knots
spread about the inner globule may thus be part of several
cavity walls. The turbulent motions of
of the globule
is being stirred up by many outflows. The numerous H2 knots
spread about the inner globule may thus be part of several
cavity walls. The turbulent motions of ![]()
![]() 1.0kms-1combined with a total globule mass of
1.0kms-1combined with a total globule mass of
![]() and radius
of
and radius
of
![]() pc (100
pc (100
![]() ), imply an energy decay rate of order
), imply an energy decay rate of order
![]() )
= 0.04
)
= 0.04![]() (Mac Low 1999).
Therefore, quantitatively, the mechanical power of the outflows is
sufficient to maintain the turbulence. The decay timescale from the
largest scales is
(Mac Low 1999).
Therefore, quantitatively, the mechanical power of the outflows is
sufficient to maintain the turbulence. The decay timescale from the
largest scales is
![]() yr.
yr.
A further feature to note is the gap in CO emission at all velocities directly between SMM1 and SMM4, with stronger blueshifted emission to the south. This suggests that star formation, which first occured near HH290IRS, was later centered in this gap, dispersing the material and compressing the surrounding cores. This has now triggered a third phase of star formation in the adjacent cores. Note also the appearance of weak blue-shifted emission at all velocities in the range -2-9 kms-1 from SMM2. This is the third most massive core in the globule, and may thus be just beginning to form a low-mass star as star formation gradually moves onwards in the north-west direction.
CB34 is not fully isolated. Its neighbour, CB33, is at a projected
distance of just 5pc and connects on to a wide ridge of material as
shown in the IRAS HIRES![]() image requested from IPAC
image requested from IPAC![]() (Fig. 9). Filamentary
structures are also present between the two globules, with clumps within
(Fig. 9). Filamentary
structures are also present between the two globules, with clumps within
![]() 2pc. For material which now forms CB34 to have become
disconnected from the ridge about 106yr ago would require a separation
speed of 2kms-1, about equal to the gravitational escape speed
from an average molecular cloud. This material would still, however, have to
condense into the Bok globule.
2pc. For material which now forms CB34 to have become
disconnected from the ridge about 106yr ago would require a separation
speed of 2kms-1, about equal to the gravitational escape speed
from an average molecular cloud. This material would still, however, have to
condense into the Bok globule.
We detect a weak halo of diffuse emission in the J, H and ![]() filters
centered on the submillimetre and far infrared cores. Fig.10
displays the diffuse halo in the H-band. Figure 11 presents the
radially-averaged halo brightness for all three bands.
The numerous locations where stars have
been subtracted hamper the extraction of radial profiles.
Furthermore, the halo consists of a large-scale diffuse
component plus numerous localised regions of scattered light
from young stars within the globule, as discussed below.
filters
centered on the submillimetre and far infrared cores. Fig.10
displays the diffuse halo in the H-band. Figure 11 presents the
radially-averaged halo brightness for all three bands.
The numerous locations where stars have
been subtracted hamper the extraction of radial profiles.
Furthermore, the halo consists of a large-scale diffuse
component plus numerous localised regions of scattered light
from young stars within the globule, as discussed below.
![\begin{figure}
\par\includegraphics[width=13.4cm,clip]{h2952f09.eps} \end{figure}](/articles/aa/full/2002/08/aah2952/img46.gif) |
Figure 9:
IRAS HIRES 100 |
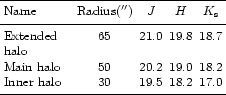
We estimate a main halo
of radius 50
![]() (0.37pc at 1500pc). An inner halo
which covers just the submillimetre cores SMM1 and SMM4 is also
defined in Table 2. An extended halo, down to
the
(0.37pc at 1500pc). An inner halo
which covers just the submillimetre cores SMM1 and SMM4 is also
defined in Table 2. An extended halo, down to
the ![]() band noise level, is of
radius of 65
band noise level, is of
radius of 65
![]() (0.48pc). The extended halo has an intensity of
(0.48pc). The extended halo has an intensity of
![]() 18.7mag/arcsec2 in the
18.7mag/arcsec2 in the ![]() band (Table 2).
This converts to 4
band (Table 2).
This converts to 4 ![]() 10-4 ergs-1cm-2sr-1.
To determine the physical process producing the halo, we generated
maps which locate the pixels which possess H-K in specific
ranges. Quite remarkably, for the range of values
(
H-K) = 0.5-0.9 mag, the halo closely silhouettes the dense far-infrared
cores mapped by Huard et al. (2000), shown here in Figs. 12
and 13.
10-4 ergs-1cm-2sr-1.
To determine the physical process producing the halo, we generated
maps which locate the pixels which possess H-K in specific
ranges. Quite remarkably, for the range of values
(
H-K) = 0.5-0.9 mag, the halo closely silhouettes the dense far-infrared
cores mapped by Huard et al. (2000), shown here in Figs. 12
and 13.
 |
The halo is not a result of incomplete sky subtraction. Firstly, the halo region was well within all the frames taken. Secondly, the halo extends far beyond the core where a number of small halos around bright stars could combine to produce weak general diffuse emission. Thirdly, the J-H and H-K colours of the diffuse halo are distinct from the embedded stars.
Magnitudes for the diffuse halo, estimated directly from contour maps in the three bands, are given in Table 2. These values are not consistent with thermal H2 emission from shocks, which predicts (H-K) = 1.5-3.4 mag (Smith 1995), far too red.
Scattering from an extended distribution of reddened stars within the globule would appear relevant to specific locations but the observed diffuse halo is generally weaker in the H band, the halo possessing H-K = 0.8-1.2 and J-H = 1.2-1.3. These values are, therefore, also not consistent with unreddened or reddened main-sequence stellar photospheres. We also expect that CB34 is shielded from the UV photons of the ambient interstellar radiation field.
Scattering of radiation from the deeply embedded infrared-excess stars
could produce the halo. These stars are redder than the halo (J-H exceeding 1.7),
which would be consistent with the stronger scattering of shorter wavelength
radiation although the extra path length of this radiation would tend to
have the opposite effect, reddening the emission. We find 23 embedded protostars
with estimated luminosities of 10 ![]() within a core radius of 65
within a core radius of 65
![]() .
In comparison, the total bolometric luminosity of the cold dust in the submillimetre cores is
.
In comparison, the total bolometric luminosity of the cold dust in the submillimetre cores is
![]() 240
240 ![]() ,
consistent with the stellar content. Therefore, given about two
magnitudes of K-band extinction, it is clear that the infrared radiation
from the protostars is largely absorbed and re-radiated by the cold dust
with an average intensity of
,
consistent with the stellar content. Therefore, given about two
magnitudes of K-band extinction, it is clear that the infrared radiation
from the protostars is largely absorbed and re-radiated by the cold dust
with an average intensity of
![]()
![]() ergs-1cm-2sr-1.
The fraction of scattered near-infrared radiation which escapes the cloud
depends on several factors, including the clumpiness and albedo. With
two magnitudes of extinction and an effective albedo of 0.25, the
halo intensity level would be
ergs-1cm-2sr-1.
The fraction of scattered near-infrared radiation which escapes the cloud
depends on several factors, including the clumpiness and albedo. With
two magnitudes of extinction and an effective albedo of 0.25, the
halo intensity level would be
![]()
![]() ergs-1cm-2sr-1. This is
an estimate for the total scattered light, and is a factor of 4 lower than the
observed K-band halo. This tentatively suggests, given the
uncertainties involved, that scattered protostellar light is a minor contribution
to the diffuse halo.
ergs-1cm-2sr-1. This is
an estimate for the total scattered light, and is a factor of 4 lower than the
observed K-band halo. This tentatively suggests, given the
uncertainties involved, that scattered protostellar light is a minor contribution
to the diffuse halo.
The H-K and J-H colours correspond to that of reddened H2
fluorescence or any other mechanism which produces a cascade down
the rotational and vibrational energy ladders of H2. The inner
halo displays more reddening, thus accounting for the anticorrelation
of low H-K with the dust maps. We have calculated the fluorescent
colours from the line fluxes measured for NGC2023 (Burton et al. 1998)
and predicted from detailed calculations (Black & van Dishoeck 1987).
These are: H-K = 0.5, J-H = 0.6 and H-K = 0.7, J-H = 0.5,
respectively. These colours are indeed consistent with stronger H-band
emission than from stellar photospheres, as found for the diffuse halo.
Fluoresence implies a halo reddening corresponding to
![]() -0.8. This is
consistent with the reddening
of the stars projected onto the diffuse halo of
-0.8. This is
consistent with the reddening
of the stars projected onto the diffuse halo of
![]()
![]() 0.5-0.9,
despite the general difference in absolute J-H values.
0.5-0.9,
despite the general difference in absolute J-H values.
We now discuss the various physical processes which could produce diffuse near-infrared H2 emission: H2-formation on grains; impact excitation of H2 by secondary electrons produced by the absorption of X-rays from embedded young objects; impact excitation of electronic states of H2 and direct impact excitation of vibrational levels in the H2 electronic ground state by secondary electrons produced by cosmic-ray ionisations; fluorescent excitation of H2 by internal UV photons emitted from embedded young stars.
Interstellar molecular hydrogen is formed on the surface of grains (Hollenbach & Salpeter 1971; Jura 1975). Duley & Williams (1993) calculated the total H2 flux for canonical cloud parameters. For their assumptions, including steady state cloud parameters, formation rate of 10-17/ns-1 and five per cent of the reformations leading to 1-0 S(1) photons, their calculation yields a 1-0 S(1) intensity of just 10-8 ergcm-3s-1, for a cloud of mean depth 0.6pc. This is far below detectable limits. Duley & Williams noted, however, that mixing between gas phases would raise the atomic density from the steady state value of n = 1cm-3 to 100cm-3, increasing the 1-0 S(1) intensity to 10-6 ergcm-3s-1. This is still well below present measurement capabilities.
Le Bourlot et al. (1995) calculated the resulting near-infrared emission spectra of H2 leaving the grains. The authors presented H and K band spectra assuming a) equipartition between translational, ro-vibrational, and vibrational degrees of freedom, b) H2 formation in the highest vibrational level, and c) H2 formation in v''=6 but at a low rotational excitation temperature of 65 K. The latter is suggested from catalysis experiments (Duley & Williams 1986). They found total K-band fluxes below 10-7 ergcm-3s-1, which confirm the above conclusion.
Molecule formation, on the other hand, would provide a full
explanation for the measured diffuse halo. In a formation
scenario, as opposed to reformation, the entire cloud halo forms
dynamically on the same time scale as molecule formation. Hence
the atomic density is high because equilibrium has not been reached.
This scenario will be explored separately (Smith et al. 2001). Here,
we note that with an atomic density of 104cm-3 in the halo, the
predicted 1-0 S(1) intensity is 10-4 ergcm-3s-1.
The integrated Ks intensity is then predicted to be
![]() 10-3 ergcm-3s-1, close to that observed.
Smith et al. (2001) demonstrate more generally that molecule and cloud
formation can both occur on time scales of 106yr, much shorter
than expected in many previous models, yet consistent with
Bok globule statistics. This is due to the revision in our ideas
of the interstellar medium away from the concept of pressure-matched
phases to that of supersonic turbulence.
10-3 ergcm-3s-1, close to that observed.
Smith et al. (2001) demonstrate more generally that molecule and cloud
formation can both occur on time scales of 106yr, much shorter
than expected in many previous models, yet consistent with
Bok globule statistics. This is due to the revision in our ideas
of the interstellar medium away from the concept of pressure-matched
phases to that of supersonic turbulence.
![\begin{figure}
\par\includegraphics[width=17cm,clip]{h2952f10.eps} \end{figure}](/articles/aa/full/2002/08/aah2952/img52.gif) |
Figure 10: Near infrared H-band image of CB34 with the Calar Alto 3.5 m and the Omega Prime camera. The three lowest contour levels, corresponding to the values in Table2, are 19.8, 19.0 and 18.2 mag/arcsec2. |
![\begin{figure}
\par\includegraphics[width=9.8cm,clip]{h2952f11.eps} \end{figure}](/articles/aa/full/2002/08/aah2952/img53.gif) |
Figure 11:
The brightness in the globule (per square arcsecond) averaged over
each 2.5
|
![\begin{figure}
\par\includegraphics[width=8.8cm,clip]{h2952f12.eps} \end{figure}](/articles/aa/full/2002/08/aah2952/img54.gif) |
Figure 12:
The 850 |
![\begin{figure}
\par\includegraphics[width=8.8cm,clip]{h2952f13.eps} \end{figure}](/articles/aa/full/2002/08/aah2952/img55.gif) |
Figure 13:
The 450 |
In a gas of low fractional ionisation, the emission from
v''=0, 1, 2
is dominated by direct impact excitation from non-thermal secondary
electrons produced by cosmic ray absorptions in dark clouds (Gredel & Dalgarno
1995). Cosmic ray ionisations are always present, and provide
in fact the main ionisation source which drives the chemistry in the dense
molecular parts. The resulting H2 emission spectrum, no matter what is
assumed for the H2 formation process, is extremely red, with most of the
emission occurring in the K-band (see e.g. Figs. 3a-d of Le Bourlot et al.
1995). Colours are dominated by values of
![]() mag,
which is in conflict with the observations presented above.
mag,
which is in conflict with the observations presented above.
Apart from penetrating cosmic rays, absorptions of X-rays in dense
molecular material resulting from young objects embedded in CB34 may
produce non-thermal, secondary electrons as well. The response of H2
to X-rays was calculated by Gredel & Dalgarno (1995) and
Tiné et al. (1997). Again, the preferential excitation of the
v''= 1,2 levels by electron impact results in high intensities of
the transitions out of these levels. Consequently, the expected
near-infrared emission from X-ray absorptions is very red, with
![]() mag. This is also in conflict with the observed
colour of the halo in CB34.
mag. This is also in conflict with the observed
colour of the halo in CB34.
The near-infrared emission spectrum expected from embedded sources of
UV photons is significantly different from that expected from X-rays.
Opposite to the direct excitation of ro-vibrational levels in all electronic
states of H2, including its ground state, UV photons populate electronic
states allowed by the selection rules of electric dipole radiation only.
The fluorescence process mainly in the Lyman and Werner bands populates
the ro-vibrational levels of the ground state which is followed by cascading.
(Black & van Dishoeck 1987). The expected color of the pure fluorescence
process is
(H-K) = 0.5-0.7 mag. UV fluorescent excitation, however, requires
the presence of massive stars. Even NGC2023, the brightest source of
fluorescent H2, powered by a B star generates a 1-0 S(1) intensity of
7 ![]() 10-5ergs-1cm-2sr-1. Here, however, we
have no such massive star.
10-5ergs-1cm-2sr-1. Here, however, we
have no such massive star.
We conclude that fast molecule formation within an interstellar medium
which is constantly evolving provides the most plausible explanation for the
diffuse halo. This scenario will be explored elsewhere (Smith et al. 2001).
Tests for the model could be based on the low H2/CO abundance, the
effects of reformation heating and the H2 cascade spectrum.
Near-infrared polarimetry would test the extent of the halo as a reflection
nebula with internal sources of illumination.
![\begin{figure}
\par\includegraphics[width=12cm]{h2952f18.eps} \end{figure}](/articles/aa/full/2002/08/aah2952/img58.gif) |
Figure 15: The central part of CB 34 as described in Fig. 1. |
![\begin{figure}
\par\includegraphics[width=8cm,clip]{h2952f19.eps}\hspace*{3mm}
\includegraphics[width=8cm,clip]{h2952f20.eps} \end{figure}](/articles/aa/full/2002/08/aah2952/img59.gif) |
Figure 16: Close-up views of the H2 objects in the continuum-subtracted 1-0 S(1) filter. a) Details of H5 and H6 knots; b) details of N1, N2 and N3 knots. |
How did the globule form? If the diffuse halo is identified with hydrogen molecules, they form on the same time scale of 106yr as the globule age. This favours a model in which the cloud has formed by cooling and collapse of an atomic cloud. This cloud would have originally been, perhaps, a few parsecs in size and 10-100 cm-3 in density. Cloud formation is, however, a continuous process and the interpretation of the halo in terms of molecule formation suggests that the cloud is still growing in mass.
The original warm atomic cloud may have been associated with the
end of a ridge of gas seen in the IRAS 100 ![]() m map.
An alternative is that the cloud was torn off from a distant
molecular cloud at the edge of the Gemini OB1 association. This
would, however, imply an age of at least 107 yr which does not agree
with other estimates. We thus conclude that CB34 has formed,
along with CB33, near the end of a dust ridge.
Triggering by compression may have instigated the collapse and shortened
the molecule formation time scale. A triggering agent is, however, not
evident and slow spontaneous formation, followed by the present
rapid evolution, cannot be excluded.
m map.
An alternative is that the cloud was torn off from a distant
molecular cloud at the edge of the Gemini OB1 association. This
would, however, imply an age of at least 107 yr which does not agree
with other estimates. We thus conclude that CB34 has formed,
along with CB33, near the end of a dust ridge.
Triggering by compression may have instigated the collapse and shortened
the molecule formation time scale. A triggering agent is, however, not
evident and slow spontaneous formation, followed by the present
rapid evolution, cannot be excluded.
How has the globule evolved? One possibility is that a roundish
globule has undergone an inside-out collapse. This formed a
central flattened core about 106yr ago. Collapse
proceeded fast 40
![]() south of this core, between SMM1 and SMM4,
and these protostars evacuated a central cavity in the flattened core.
Turbulent motions, driven by the outflows, of 1-2 kms-1led to members of the young group expanding to their present
locations, up to 1pc from the original core. The protostellar
winds have driven into the annulus, forming a core SMM1 on
the front side and a core SMM4 towards the rear. This has led to
predominantly red-shifted and blue-shifted molecular H13CO+
lines, respectively, with accelerated material further away from
the initial core. This may also explain the main CO bipolar outflow,
which appears to be aligned along the cores rather than along the
H2 flows (Fig. 7), with only a weaker blue lobe extending
along the N outflow. The second phase of star formation begun about
5
south of this core, between SMM1 and SMM4,
and these protostars evacuated a central cavity in the flattened core.
Turbulent motions, driven by the outflows, of 1-2 kms-1led to members of the young group expanding to their present
locations, up to 1pc from the original core. The protostellar
winds have driven into the annulus, forming a core SMM1 on
the front side and a core SMM4 towards the rear. This has led to
predominantly red-shifted and blue-shifted molecular H13CO+
lines, respectively, with accelerated material further away from
the initial core. This may also explain the main CO bipolar outflow,
which appears to be aligned along the cores rather than along the
H2 flows (Fig. 7), with only a weaker blue lobe extending
along the N outflow. The second phase of star formation begun about
5![]() 105yr ago, within the two cores which have (in this
scenario) a common rotation axis, which is ultimately responsible
for generating parallel jets.
105yr ago, within the two cores which have (in this
scenario) a common rotation axis, which is ultimately responsible
for generating parallel jets.
Copyright ESO 2002
![\begin{figure}
\par\includegraphics[angle=-90,width=15.5cm,clip]{h2952f07.ps} \end{figure}](/articles/aa/full/2002/08/aah2952/img36.gif)
![\begin{figure}
\includegraphics[angle=-90,width=8.8cm,clip]{h2952f08.eps} \end{figure}](/articles/aa/full/2002/08/aah2952/img37.gif)
![\begin{figure}
\par\mbox{
\subfigure[]{\includegraphics[width=8.2cm]{h2952f14.e...
...
\subfigure[]{\includegraphics[width=8.2cm]{h2952f17.eps} }\quad
}
\end{figure}](/articles/aa/full/2002/08/aah2952/img57.gif)