The primary goal of the ELODIE spectrograph was to measure high-accuracy radial velocities, and the data reduction pipeline was optimized for that purpose. The on-line reduction is achieved by the software INTER-TACOS (INTERpreter for the Treatment, the Analysis and the COrrelation of Spectra) developed by D. Queloz and L. Weber at Geneva Observatory (BQ96). During this reduction, the background is removed using a two dimensional polynomial fit that has a typical error of about 5%, with a peak in the middle of the orders (cf. Fig. 11 of BQ96). We tried to improve this fit by increasing the polynomial order. However, we encountered an internal dimensional limitation that prevented us from using a high enough order to correct the middle peak. Therefore, we decided to use IRAF (Image Reduction and Analysis Facility, Tody, 1993 ). Another point motivating our choice was the wide availability of IRAF.
The reduction itself was done with IRAF, and more precisely with the imred.ccdred and imred.echelle package. Its main stages are the following:
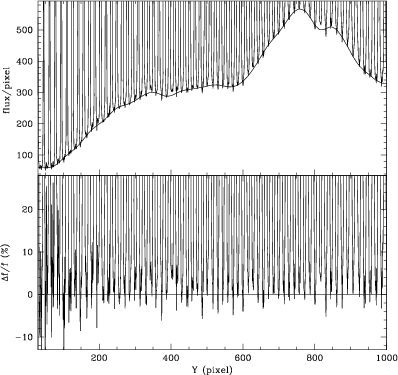
The main weakness of the online procedure resides in the background subtraction. Although a typical error in the background measurement of 5% can be tolerated for accurate radial velocity measurements (BQ96), it is important to achieve a better adjustment in order to use the spectra for abundance measurements. The scattered light is estimated, smoothed and subtracted in the following way. Interorder pixels are fit with a one dimensional function in the direction perpendicular to the dispersion. This fitting uses an iterative algorithm to further reject high values and thus fits the minima between the spectra. The fitted function is a combination of 30 spline functions (see Fig. 1 Top). Because each fit (each column) is done independently, the scattered light thus determined will then be smoothed by again fitting a one dimensional function (30 spline functions in the dispersion direction). The final scattered light surface is then subtracted from the input image. The reason for using two one-dimensional fits as opposed to a surface fit is that the shape of the scattered light is generally not easily modeled by a simple two dimensional function. The typical error in the background measurement is about 2%. This is shown in Fig. 1, which should be compared with Fig. 11 of BQ96.
It is to be noted that the blue orders are not very well corrected. However, this is a deliberate choice. We cannot simultaneously adjust the first orders without using more than 35 cubic spline functions. But with that number, the fitting function is too sensitive to the order. Moreove, since the signal to noise ratio (S/N) is lower in the bluest orders (see Fig. 10 of BQ96), these are not optimal for abundance determination. In these orders, it is very difficult to adjust the continuum because of the calcium and Balmer lines. Therefore, we decided not to use the first orders and the problem of the background subtraction in them was left unresolved.
During the observing run every night, we did many offsets, darks and flat-fields. Instead of using only the last exposure for the offset, dark and flat-field correction, as is the case in the online reduction, we chose to combine the exposures in order to remove pixels hit by cosmic rays, and obtain a mean offset, dark and flat-field. Then we corrected each pixel of the object image with the corresponding one of the offset and dark.
Then we used the average flat-field (while the standard TACOS reduction only uses the last one) to determine the shape of the orders and this shape was used as reference for the extraction of the object image. We took care to adjust the resizing parameter with the lowest possible parameters in order to get almost all the flux. Finally, we set the aperture limit at 0.005 time the level of the peak. This lead to the extraction of 99.9% of the flux spread over the order.
As explained in the paper BQ96, the flat-field spectrum correction method (i.e. flat-field correction after extraction of the spectrum) is satisfactory with such a stable instrument as ELODIE. This method is also applied in our reduction (in any case, it is not really possible to get a true flat-field image with ELODIE).
The wavelength calibration is carried out using the thorium spectrum. The
spectra are extracted without correction of the scattered light and without
the flat-field division. A two dimensional Chebyshev polynomial is used to
constrain the global wavelength position with the degree 7 for both
directions. The typical rms between the fit and the location of the
lines is always below 0.001 Å for the wavelength
calibration of the whole spectrum. The fit is just a formal one.
We did not attempt to model the optical behaviour of the
spectrograph. We used the thar.dat file from IRAF to identify the
lines. This file contain the line list of a Thorium-Argon spectral
Atlas done by Willmarth and collaborators available at
http://www.noao.edu/kpno/specatlas/thar/ thar.html which used
identification from Palmer and Engleman (1983, the same as
BQ96) for Th and
from Norlén (1976) for Ar. Looking carefully at the flux
ratio in Fig. 5, bottom, a number of the
larger discrepancies appear to be due to minute wavelength
differences between both spectra. A difference of
![]() might already
explain such a signature in the ratio panel.
Figure 14 of BQ96 shows that the accuracy differs from one order to
the other.
Figure 5 displays more than two orders, and differences appear
only in the left and right parts, which correspond to
different orders than
the central part. As accuracies are different, it is
possible that small shifts exist between orders.
might already
explain such a signature in the ratio panel.
Figure 14 of BQ96 shows that the accuracy differs from one order to
the other.
Figure 5 displays more than two orders, and differences appear
only in the left and right parts, which correspond to
different orders than
the central part. As accuracies are different, it is
possible that small shifts exist between orders.
| |
Figure 2: 19th, 20th and 21th orders of Vega before merging. |
The next important task is to merge the orders to obtain a one dimensional spectrum covering the whole wavelength domain. At that point, we encountered a problem with the data. The extracted orders are not flat enough to be merged using the average or median value of the order as coefficient (see Fig. 2).
Merging by considering only one average value per order
results in a spectrum with
steps (imagine Fig. 2 with a vertical line connecting the
middle of the overlapping region, and smooth that transition region
over 10 pixels).
![\begin{figure}
\par\includegraphics[width=16.6cm]{1986f3.eps}
\end{figure}](/articles/aa/full/2002/07/aa1986/img18.gif) |
Figure 3: The whole spectrum of Vega. |
We decided to compute our own program to paste the orders. There is an overlapping region until the 64th order. However the overlapping region is large enough to estimate the ratio only until the 50th order. (Note that the orders are numbered from 1 to 67 and the "true'' number in not used as in BQ96). Therefore, we used two different merging methods, one using the overlapping region for the orders 1 to 50, and another using the first and last 200 points of the order (each order is rebinned with a step of 0.03 Å before the merging). With both methods, we computed a ratio allowing to scale the orders, starting from the middle order which is used as reference.
In the first method, we computed the average of the ratios of the
overlapping points
and the rms scatter. Then, we did a loop taking into account only the
ratios between the average
![]() until no
points were deleted or the number of points become
until no
points were deleted or the number of points become ![]() 50. This
method was very efficient, and worked in almost every case.
50. This
method was very efficient, and worked in almost every case.
The second method was not quite as efficient but we rarely had to
correct its results manually. We decided to use the
first and last 200 points of the orders, compute the average value of
these points and the rms scatter, then recompute the average but
deleting the points that were not between the average
![]() until no
points were deleted or the number of points became
until no
points were deleted or the number of points became ![]() 50 and
finally compute the ratio of the averages of the end of an order and
the beggining of the following order.
50 and
finally compute the ratio of the averages of the end of an order and
the beggining of the following order.
Finally, starting from the middle order, the orders are scaled by multiplicative adjustments. In the overlapping regions, no attempt was made to make a weighted average: in view of the blaze function, it was decided to retain the flux of the first order for 3/4 of the overlapping region and the flux of the following order for the remaining 1/4. Both methods are compatible and it is possible to merge all orders in a single pass; Fig. 3 shows the results for Vega.
| |
Figure 4:
Plot of the 31th order of Vega around H |
The final step is normalization to the continuum level. A simple
look at Fig. 3 shows that it is no easy task, especially
around the Balmer lines H![]() and H
and H![]() and the Caii K
line. We decided to use the function continuum of IRAF. However,
it is very hard to normalize the whole spectrum in a row. One could argue
that, if the normalization was done before merging, that operation would
become much easier. However, some orders are not normalizable,
especially those
containing the Balmer lines (see Fig. 4).
and the Caii K
line. We decided to use the function continuum of IRAF. However,
it is very hard to normalize the whole spectrum in a row. One could argue
that, if the normalization was done before merging, that operation would
become much easier. However, some orders are not normalizable,
especially those
containing the Balmer lines (see Fig. 4).
We chose to split the whole spectrum into 6 parts, and normalize each part separately (besides analyzing the whole spectrum at once would require too much data processing). The task continuum has many parameters and the result is very dependent on them. However, once a good set of parameter is defined, it can be used for a lot of different spectra. Moreover, IRAF allows to modify the parameters interactively in case of unexpected behaviour.
Although IRAF works well automatically, it is important to check all the spectra visually. Unfortunately, despite all different numerical tests, the eyes appear to be still the best way to decide which set of parameters to use.
Our reduction was checked using the Solar Atlas from
Kurucz et al. (1984). This spectrum was acquired with a very high
resolving power (![]() )
and a very high signal to noise ratio
(3000). The resolving power was adjusted to
that of ELODIE by convolving the
spectrum with an instrumental profile; a simple Gaussian with an FWHM
corresponding to the normal resolution
)
and a very high signal to noise ratio
(3000). The resolving power was adjusted to
that of ELODIE by convolving the
spectrum with an instrumental profile; a simple Gaussian with an FWHM
corresponding to the normal resolution ![]() was considered sufficient.
Our comparison spectrum was acquired using Callisto so that
we were in a stellar-like configuration. This precaution is not very
important as ELODIE is a fiber-fed spectrograph, but one of the advantages
was that it required a rather long exposure and therefore the reduction was
sensitive to the dark correction. Finally, we adjusted the radial
velocities. Notice that two versions of the spectrum, one resulting from
the TACOS reduction procedure and the other from the IRAF procedure,
were merged and normalized using our method. The
comparison is illustrated in Fig. 5.
was considered sufficient.
Our comparison spectrum was acquired using Callisto so that
we were in a stellar-like configuration. This precaution is not very
important as ELODIE is a fiber-fed spectrograph, but one of the advantages
was that it required a rather long exposure and therefore the reduction was
sensitive to the dark correction. Finally, we adjusted the radial
velocities. Notice that two versions of the spectrum, one resulting from
the TACOS reduction procedure and the other from the IRAF procedure,
were merged and normalized using our method. The
comparison is illustrated in Fig. 5.
It is clear, looking at the ratio for the strong lines, that scattered
light is not well subtracted with the standard TACOS procedure. The
difference increases as lines strengthen, reaching a maximum at the core
of H![]() in our example. Even if the difference for
H
in our example. Even if the difference for
H![]() can partly come from the normalization as can be seen looking
at the ratio in the wings, which differ slightly from 1, the big
difference in the core cannot be assigned to different continuum
adjustment. On the contrary, our optimized reduction leads to
differences which remain within, or only slightly larger than the noise.
can partly come from the normalization as can be seen looking
at the ratio in the wings, which differ slightly from 1, the big
difference in the core cannot be assigned to different continuum
adjustment. On the contrary, our optimized reduction leads to
differences which remain within, or only slightly larger than the noise.
Copyright ESO 2002
![\begin{figure}
\par\includegraphics[width=16.8cm]{1986f5.eps}
\end{figure}](/articles/aa/full/2002/07/aa1986/img23.gif)