 |
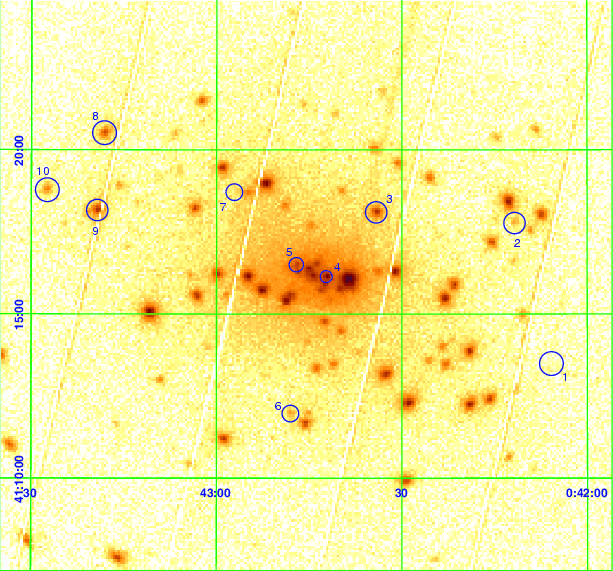
Figure 1: The 0.3-10 keV EPIC PN image of the central region of M 31. The data are from the 31-ks exposure taken on June 25, 2000. The intensity of the color is proportional to the logarithm of the number of counts collected (with a maximum of 5000 counts). PN chip boundaries are clearly visible. The positions of ten variable sources are encircled and labelled with the numbers listed in Table 2. |
At a distance of 760 kpc (van den Bergh 2000; adopted throughout
this paper), M 31 is close enough to allow detailed study of individual
sources within the galaxy using modern X-ray telescopes. Over 100
discrete X-ray sources in M 31 were detected with the Einstein observatory (Trinchieri & Fabbiano 1991, hereafter TF;
van Speybroeck et al. 1979). Primini et al. (1993, hereafter
PFJ) reported on the detection of 86 X-ray sources in the
central 34![]() of M 31 with the ROSAT HRI. Supper et al. (2001,
hereafter Su01) recently published the complete catalog of 560
sources detected in a
of M 31 with the ROSAT HRI. Supper et al. (2001,
hereafter Su01) recently published the complete catalog of 560
sources detected in a ![]() 10.7 deg2 survey of M 31 with the
ROSAT /PSPC
10.7 deg2 survey of M 31 with the
ROSAT /PSPC![]() .
From the extrapolation of the luminosity distribution, PFJ concluded
that the detected population of X-ray sources could account for only
.
From the extrapolation of the luminosity distribution, PFJ concluded
that the detected population of X-ray sources could account for only
![]() 15-26% of the unresolved X-ray emission in M 31, suggesting
that the remaining emission is truly diffuse or due to a new class of
X-ray sources. Spectral analysis of ROSAT data performed by Borozdin
& Priedhorsky (2000) and observations with XMM
(Shirey et al. 2001, hereafter Paper I) and Chandra (Garcia et al. 2001) showed that the unresolved X-ray emission in the
bulge of M 31 is significantly softer than most of the point sources
and can be approximated with an optically-thin thermal plasma model
(
15-26% of the unresolved X-ray emission in M 31, suggesting
that the remaining emission is truly diffuse or due to a new class of
X-ray sources. Spectral analysis of ROSAT data performed by Borozdin
& Priedhorsky (2000) and observations with XMM
(Shirey et al. 2001, hereafter Paper I) and Chandra (Garcia et al. 2001) showed that the unresolved X-ray emission in the
bulge of M 31 is significantly softer than most of the point sources
and can be approximated with an optically-thin thermal plasma model
(
![]() keV) as expected from truly diffuse emission.
keV) as expected from truly diffuse emission.
| Date & Time (UTC) | Rev | Obs. ID | Exp. (ks) |
| 25/6/2000 (10:44-20:25) | 100 | 0112570401 | 34.8a/30.7b |
| 28/12/2000 (0:10-3:34) | 193 | 0112570601 | 12.2a/9.8b |
In the first Chandra observation of M 31, the nuclear source seen
with Einstein and ROSAT was resolved into five sources
(Garcia et al. 2000, hereafter G2000).
One of these sources is located within 1
![]() of
the radio nucleus of M 31 and exhibits an unusually soft X-ray
spectrum, suggesting that it may be associated with the central
super-massive black hole. A few more pairs of previously unresolved
sources and a new transient were also detected within 30
of
the radio nucleus of M 31 and exhibits an unusually soft X-ray
spectrum, suggesting that it may be associated with the central
super-massive black hole. A few more pairs of previously unresolved
sources and a new transient were also detected within 30
![]() of
the nucleus.
of
the nucleus.
We report on observations of the Andromeda Galaxy (M 31) carried out with XMM-Newton (Jansen et al. 2001) during its Performance Verification (PV) phase. M 31 was selected as an XMM PV target in order to demonstrate the capabilities of the mission in performing spectral and timing studies in a field of point sources and extended emission. In Paper I we focused on the group properties of the X-ray point sources and on the diffuse emission. The spectral properties of discrete X-ray sources in the XMM-Newton exposures will be discussed in Trudolyubov et al. (2001, Paper III). In this present paper we discuss the variability of individual X-ray sources in M 31. In Sect. 2, we summarize the XMM-Newton observations and our data-reduction process. In Sect. 3, we discuss our detections of transient and periodic variability in individual sources. Finally, we present our conclusions.
| # | Source namea |
|
|
Commentsc | ||
| 1 | XR J004205.9+411329 | 00:42:05.9 | 41:13:29 | <2.7 | 12.6 |
PFJ#3 |
| 2 | XR J004212.3+411800 | 00:42:12.3 | 41:18:00 | 1.8 |
17.5 |
TF#14, PFJ#8 |
| 3 | XMMU J004234.1+411808 | 00:42:34.1 | 41:18:08 | 27.9 |
<6.4 | XMM X-ray nova (Sect. 3.1) |
| 4 | CXO J004242.0+411608 | 00:42:42.2 | 41:16:09 | 58.1 |
45.6 |
Chandra transient (G2000 and Sect. 3.2) |
| 5 | RX J0042.7+4116 | 00:42:47.2 | 41:16:28 | 9.5 |
94.0 |
TF#59, PFJ#50, Su97#198,
Su01#195 |
| 6 | XMMU J004247.5+411158 | 00:42:47.5 | 41:11:58 | 4.0 |
<3.0 | |
| 7 | CXOU J004257.1+411843 | 00:42:57.1 | 41:18:43 | <2.0 | 6.3 |
seen on Oct. 13, 1999 with Chandra |
| 8 | RX J0043.3+4120 | 00:43:18.9 | 41:20:19 | 23.4 |
2.5 |
SSSf, TF#87, Su97#235, Su01#235 |
| 9 | XMMU J004319.4+411759 | 00:43:19.4 | 41:17:59 | 43.6 |
<5.1e,h | SSSf, 865-s pulsations (Sect. 3.3) |
| 10 | RX J0043.4+4118 | 00:43:27.9 | 41:18:35 | 8.6 |
6.5 |
SSSf, TF#89, PFJ#80, Su97#240, Su01#241, SNR |
Copyright ESO 2001