![\begin{table}{
\begin{array}[b]{lcc}
\hline
\noalign{\smallskip }
& \; \; {\...
...\; 0.1 \; & \; 0.9 \; \\
\noalign{\smallskip }
\hline
\end{array}}
\end{table}](/articles/aa/full/2001/41/aa1465/img98.gif) |
Calculations based on the method presented in the previous section have
been performed in the aim of deriving the expected flux in the 2.22 MeV
line from the binary system. The energy distribution of neutrons was
assumed to be a Maxwellian with kT = 10 MeV, truncated at 5 MeV (![]() in
Eq. (14)) because
the gravitationnal potential of the primary compact object retains the
neutrons of lower energy (see Sect. 2). Since we are dealing with close
binary systems, the separation is less than 40
in
Eq. (14)) because
the gravitationnal potential of the primary compact object retains the
neutrons of lower energy (see Sect. 2). Since we are dealing with close
binary systems, the separation is less than 40 ![]() ,
which is the
mean free
path of 5 MeV neutrons in the vacuum. Therefore, the energy distribution
does not necessitate an additionnal cut to account for the loss of
neutrons by decay during their trip to the secondary star.
,
which is the
mean free
path of 5 MeV neutrons in the vacuum. Therefore, the energy distribution
does not necessitate an additionnal cut to account for the loss of
neutrons by decay during their trip to the secondary star.
The fraction of escaping 2.22 MeV radiation (f2.2) is defined as the
ratio of 2.22 MeV photons that reach the secondary star surface (outward)
without scattering to the total number of incident neutrons. This fraction
is calculated by integrating the angular distribution of escaping 2.22 MeV
photons (see Eq. (4)) over all the possible angles. The 2.22 MeV
photons produced by the returning neutrons are also taken into account. The
fraction f2.2 depends on the zenith angles and energies of incident
neutrons. It gives an idea of the efficiency of neutrons in producing an
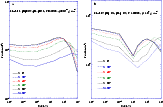
observable 2.22 MeV line. Figures 5 show the escaping
2.22 MeV fraction for the two models of the secondary star. The difference
in the neutron capture rate between the two models is principally due to
the difference in the composition of the atmosphere. Indeed the abundance
of 3He in the second model is such that a large fraction of neutrons
are captured by this nucleus and thus lost. Consequently, the neutrons
capture rate decreases by a factor ![]() 17 between the two models. In
Model-2 the 2.22 MeV photons are emitted deeper in the atmosphere, and so
their shorter mean free path lowers the fraction of escaping photons
by a factor 1.5 compared to Model-1. Finally, the gravitational
escaping energy of neutrons in Model-2 is slighty lower than in Model-1,
increasing the fraction of escaping neutrons and further reducing the 2.22
MeV emissivity in Model-2. All these effects lead to a decrease of
f2.2 by a factor
17 between the two models. In
Model-2 the 2.22 MeV photons are emitted deeper in the atmosphere, and so
their shorter mean free path lowers the fraction of escaping photons
by a factor 1.5 compared to Model-1. Finally, the gravitational
escaping energy of neutrons in Model-2 is slighty lower than in Model-1,
increasing the fraction of escaping neutrons and further reducing the 2.22
MeV emissivity in Model-2. All these effects lead to a decrease of
f2.2 by a factor ![]() 30 for Model-2 with respect to Model-1 at
low
30 for Model-2 with respect to Model-1 at
low ![]() .
.
The fraction of escaping 2.22 MeV photons depends not only on the neutron capture rate but also on the transmission of 2.22 MeV photons in the atmosphere. In Model-1 (see Fig. 5a), where the neutron energy is lower than the escaping energy, the neutrons thermalize quickly and stay in the upper layer of the atmosphere. If they leave the atmosphere, they cannot escape the secondary but a fraction of them decay before returning in the atmosphere. The fraction of escaping neutrons increases with the zenith angle. Indeed, high-zenith-angle incident neutrons can more easily escape since they scatter close to the surface. This is not the case for low-zenith-angle incident neutrons that go deeper in the atmosphere: even if they scatter toward the surface, their energies are rarely above the escape value. This explains why the f2.2 fraction decreases with increasing zenith angle below 5 MeV. Above 5 MeV, neutrons penetrate and are captured deeper in the atmosphere. The fraction of escaping neutrons is reduced, as well as the transmission of 2.22 MeV photons. However, for large zenith angles, the neutron captures happen closer to the surface in zones allowing the 2.22 MeV photons to escape more easily from the star.
The variation of the 2.22 MeV photon
escaping fraction as a function of the angle and the energy of impinging
neutrons in Model-2 is similar to that in Model-1. However, a resonance in the
elastic scattering of neutrons with 4He at 1.1 MeV is at the origin of
the drop around 1 MeV (see Fig. 5b). At this resonance, the
angular distribution of 4He-scattered neutrons is peaked for backward
directions![]() . Consequently, around 1 MeV, incident neutrons are more likely to backscatter and to be ejected out of the atmosphere with kinetic energies too high to allow them to return. This effect reduces the number of MeV neutrons that can thermalize and produce 2.2 MeV photons, hence the trough seen in Fig. 5b.
. Consequently, around 1 MeV, incident neutrons are more likely to backscatter and to be ejected out of the atmosphere with kinetic energies too high to allow them to return. This effect reduces the number of MeV neutrons that can thermalize and produce 2.2 MeV photons, hence the trough seen in Fig. 5b.
 |
Figure 5: Fraction of escaping 2.2 MeV photons as a function of the impinging neutron energies for several impinging zenith angle. The two models are presented separately. |
The distance between the accretion disk (the source of neutrons) and the
center of the secondary star, and the angles ![]() and
and ![]() ,
which
specify the direction of Earth (see Fig. 4), are the basic
parameters of
this calculation. Since the binary system is rotating,
,
which
specify the direction of Earth (see Fig. 4), are the basic
parameters of
this calculation. Since the binary system is rotating, ![]() varies with
time
and the observed flux becomes periodic. Intensities have been calculated as
a function of the
direction of emission for different values of the distance between the
primary and secondary stars. Assuming parameters of the binary system
(separation and
masses), it has been possible to derive light curves of the 2.22 MeV line
emission, depending on
varies with
time
and the observed flux becomes periodic. Intensities have been calculated as
a function of the
direction of emission for different values of the distance between the
primary and secondary stars. Assuming parameters of the binary system
(separation and
masses), it has been possible to derive light curves of the 2.22 MeV line
emission, depending on ![]() .
However, the range of interesting
separations is limited since the secondary radius needs to fill its Roche
lobe in order to allow the accretion of its matter by the compact object.
Using a study by Paczynski (1971) that calculated the critical radius of a
star in a binary system that allows the outward flow of its matter, we
estimated the upper limit of the separation to be between 3.5-6
.
However, the range of interesting
separations is limited since the secondary radius needs to fill its Roche
lobe in order to allow the accretion of its matter by the compact object.
Using a study by Paczynski (1971) that calculated the critical radius of a
star in a binary system that allows the outward flow of its matter, we
estimated the upper limit of the separation to be between 3.5-6 ![]() for a secondary star of 1
for a secondary star of 1 ![]() (Model-1) and 7.5-11
(Model-1) and 7.5-11 ![]() for a secondary star of 10
for a secondary star of 10 ![]() (Model-2), providing
compact object masses ranging from 3 to 20
(Model-2), providing
compact object masses ranging from 3 to 20 ![]() .
With this type of
close binary systems, the period of rotation is less than a day.
.
With this type of
close binary systems, the period of rotation is less than a day.
Figure 6 shows phasograms of the 2.22 MeV intensity as a
function of
the separation for Model-1. As expected, the intensity is maximum when the
neutron-irradiated area of the secondary star atmosphere faces the
observer. The maximum value of the intensity decreases with increasing
separation values because the neutrons flux impinging on the atmosphere
decreases with increasing distance between the accretion disk and the
secondary. In Fig. 6, the intensity is equal to zero at a phase
value of 0.5 only for a separation of 1.5 ![]() ,
because for this
value of
,
because for this
value of
![]() the irradiated area is hidden by the star. For larger
separations, the irradiated area becomes larger and a fraction of this
area is always visible by the observer.
the irradiated area is hidden by the star. For larger
separations, the irradiated area becomes larger and a fraction of this
area is always visible by the observer.
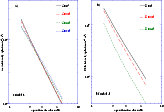
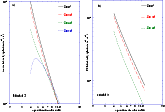
The mean and the root-mean-square (rms) fluxes are commonly used for the
analysis of periodic emissions. They have been estimated for our 2.22 MeV
intensity as a function of the separation and the direction of the
observer. Both the mean and the rms intensities decrease with increasing
separation values as a power law with slope around -2 (between -1.8 and
-2.3). Figures 7 and 8 show the variation
of the mean and rms intensities as a function of the binary separation for
the two models.
![\begin{table}{
\begin{array}[b]{lcccc}
\noalign{\smallskip }
\hline
\noalign{...
... & 1.7\times 10^{-6} \\
\noalign{\smallskip }
\hline
\end{array}}\end{table}](/articles/aa/full/2001/41/aa1465/img102.gif) |
The mean intensity does not vary significantly with the angle of the
Observer's direction with respect to the binary system plane. The
rms intensity decreases, however, showing a reduction of the modulation of the
visible photon flux with increasing ![]() .
The modulation
obviously disappears for a direction of observation of the binary system
perpendicular to the plane of the latter (
.
The modulation
obviously disappears for a direction of observation of the binary system
perpendicular to the plane of the latter (
![]() ).
).
 |
Figure 7:
Normalized mean a) and rms b) intensities for Model-1 as a function
of the separation of the binary. Several values of |
 |
Figure 8:
Normalized mean a) and rms b) intensities for Model-2 as a function
of the separation of the binary. Several values of |
The flux at 2.22 MeV can be derived using the formula:
where ![]() is the rate of neutrons emitted by the accretion disk,
I2.2 is the normalized intensity and
is the rate of neutrons emitted by the accretion disk,
I2.2 is the normalized intensity and
![]() the distance of the
binary system to the observer in kpc. For Model-1, the flux at 1 kpc is
found to
be in the range 10-7-10-5 photons s-1 cm-2depending on the accretion disk model. For Model-2, it is found to be
in the range 10-8 to 10-6 photons s-1 cm-2depending on the accretion disk model. Combining the results of
the distance of the
binary system to the observer in kpc. For Model-1, the flux at 1 kpc is
found to
be in the range 10-7-10-5 photons s-1 cm-2depending on the accretion disk model. For Model-2, it is found to be
in the range 10-8 to 10-6 photons s-1 cm-2depending on the accretion disk model. Combining the results of ![]() from
Sect. 2 (Tables 1a, b to 5a, b) with the calculations in this section, we
obtain the final fluxes F2.2, which we present succinctly in Tables 7 and 8. The separations have been chosen to be 2
from
Sect. 2 (Tables 1a, b to 5a, b) with the calculations in this section, we
obtain the final fluxes F2.2, which we present succinctly in Tables 7 and 8. The separations have been chosen to be 2 ![]() and 8
and 8 ![]() for Model-1 and Model-2 respectively, since for these values the mean
fluxes do not change significantly with the binary system inclination (see
Figs. 7 and 8).
for Model-1 and Model-2 respectively, since for these values the mean
fluxes do not change significantly with the binary system inclination (see
Figs. 7 and 8).
![\begin{table}
\par
{
\begin{array}[b]{lcccc}
\noalign{\smallskip }
\hline
\noa...
... & 1.2\times 10^{-7} \\
\noalign{\smallskip }
\hline
\end{array}}\end{table}](/articles/aa/full/2001/41/aa1465/img109.gif) |
The rotation of the binary system leads to a shift in the centroid of the
2.22 MeV
line. This Doppler shift changes with the phase and depends on the
observer's direction (![]() ). Using classical relations
in binary systems (e.g. Franck et al. 1992) we derive a relation
(Eq. (16)) for the spectral shift of the 2.22 MeV line
which depends on the masses of the compact object and the secondary
(
). Using classical relations
in binary systems (e.g. Franck et al. 1992) we derive a relation
(Eq. (16)) for the spectral shift of the 2.22 MeV line
which depends on the masses of the compact object and the secondary
(![]() and
and ![]() ,
respectively, in solar masses), the separation between the two objects
(
,
respectively, in solar masses), the separation between the two objects
(![]() in solar radii),
the phase (
in solar radii),
the phase (![]() ), and the angle between the observer's direction and the
binary system (
), and the angle between the observer's direction and the
binary system (![]() ).
).
The estimated spectral shift is mesurable with SPI, the
spectrometer onboard the INTEGRAL satellite. Using Eq. (16) and
the intensity variation as a function of the phase (as presented in Fig. 6) we have obtained the 2.22 MeV line profiles for Model-1
(Figs. 9) with a compact companion of 3 ![]() and
for two values of the binary system
and
for two values of the binary system
inclination![]() . The line is broadened and
double-peaked due to the rotation of the secondary star. Figures
10 show the shape of the line as it could be measured by SPI
(assuming a spectral resolution of 2.9 keV at 2.22 MeV). For an
inclination of 80
. The line is broadened and
double-peaked due to the rotation of the secondary star. Figures
10 show the shape of the line as it could be measured by SPI
(assuming a spectral resolution of 2.9 keV at 2.22 MeV). For an
inclination of 80![]() the double-peak shape is clearly visible, whereas
for a 10
the double-peak shape is clearly visible, whereas
for a 10![]() inclination that is not the case.
inclination that is not the case.
 |
Figure 9:
Shape of the neutron capture line for Model-1. The
inclination of the binary system is 10 |
Copyright ESO 2001