Full grating scan spectra of 43-197 ![]() m were obtained for 9 galaxies
with the LWS01 mode in the open time programs of TONAKA.IRGAL and GALIR.
In addition, we extracted LWS01 full grating scan data of 25 galaxies from
the ISO archival database for
a total of 34 nearby galaxies LWS spectra that were analyzed in the present
study.
The sample includes various types of galaxies, ranging from active galactic
nuclei (AGNs), starburst,
to normal galaxies. Table 1 lists the present sample,
where the flux density at 60
m were obtained for 9 galaxies
with the LWS01 mode in the open time programs of TONAKA.IRGAL and GALIR.
In addition, we extracted LWS01 full grating scan data of 25 galaxies from
the ISO archival database for
a total of 34 nearby galaxies LWS spectra that were analyzed in the present
study.
The sample includes various types of galaxies, ranging from active galactic
nuclei (AGNs), starburst,
to normal galaxies. Table 1 lists the present sample,
where the flux density at 60 ![]() m and the FIR color R(60/100) are
derived from the LWS spectra convolved with the IRAS band filters
(for the data reduction, see below).
m and the FIR color R(60/100) are
derived from the LWS spectra convolved with the IRAS band filters
(for the data reduction, see below).
| Galaxy | Type | Morphology | ISO(60)a[Jy] | R(60/100)b | visual size [ |
| Cen A | AGN | S0 pec, Sy2 | 98.4 | 0.43 |
|
| Circinus | AGN | SA(s)b:, Sy2 | 334.1 | 0.71 |
|
| IC 2554 | normal | SB(s)bc pec: | 15.9 | 0.52 |
|
| IRAS 00506+7248 | normal | 24.1 | 0.66 | ||
| IRAS 13242-5713 | normal | S... | 89.2 | 0.70 |
|
| M 51 | normal | SA(s)bc pec, HII, Sy2.5 | 36.4 | 0.38 |
|
| M 82 | starburst | I0, Sbrst, HII | 1486.6 | 0.87 |
|
| M 83 | starburst | SAB(s)c, HII, Sbrst | 138.0 | 0.60 |
|
| Maffei2 | normal | SAB(rs)bc: | 94.8 | 0.47 |
|
| NGC 1068 | AGN | (R)SA(rs)b, Sy1, Sy2 | 206.3 | 0.62 |
|
| NGC 1097 | starburst | (R'1:)SB(r'l)b, Sy1 | 49.6 | 0.54 |
|
| NGC 1365 | AGN | (R')SBb(s)b, Sy1.8 | 92.0 | 0.52 |
|
| NGC 2146 | starburst | SB(s)ab pec, HII | 163.3 | 0.65 |
|
| NGC 253 | starburst | SAB(s)c, HII, Sbrst | 1044.7 | 0.70 |
|
| NGC 3256 | starburst | Pec, merger, HII | 107.8 | 0.71 |
|
| NGC 3690 | starburst | IBm pec, HII | 121.7 | 1.00 |
|
| NGC 4038 | starburst | SB(s)m pec | 21.5 | 0.52 |
|
| NGC 4041 | normal | SA(rs)bc: | 11.7 | 0.43 |
|
| NGC 4414 | normal | SA(rs)c? | 24.8 | 0.38 |
|
| NGC 4945 | starburst | SB(s)cd: sp, Sy2 | 577.2 | 0.50 |
|
| NGC 520 | starburst | 37.9 | 0.65 |
|
|
| NGC 5430 | starburst | SB(s)b, HII, Sbrst | 9.2 | 0.51 |
|
| NGC 5937 | normal | (R')SAB(rs)b pec | 10.0 | 0.46 |
|
| NGC 6156 | normal | (R'1)SAB(rs)c | 20.9 | 0.61 |
|
| NGC 6240 | starburst | I0: pec, LINER, Sy2 | 25.8 | 0.87 |
|
| NGC 6764 | starburst | SB(s)bc, LINER, Sy2 | 4.6 | 0.50 |
|
| NGC 6810 | normal | SA(s)ab:sp, Sy2 | 17.0 | 0.48 |
|
| NGC 6824 | normal | SA(s)b: | 6.8 | 0.43 |
|
| NGC 6946 | starburst | SAB(rs)cd, HII | 58.6 | 0.50 |
|
| NGC 7469 | starburst | (R')SAB(rs)a, Sy1.2 | 24.7 | 0.69 |
|
| NGC 7552 | starburst | (R')SB(s)ab, HII, LINER | 74.7 | 0.59 |
|
| NGC 7582 | AGN | (R'1)SB(s)ab, Sy2 | 51.9 | 0.64 |
|
| NGC 7714 | starburst | SB(s)b:pec, HII, LINER | 12.7 | 0.97 |
|
| NGC 891 | normal | SA(s)b? sp, HII | 24.3 | 0.31 |
|
b Ratio of the 60 ![]() m and 100
m and 100 ![]() m flux
densities (in Jy) derived from the LWS spectra with the IRAS band filters.
m flux
densities (in Jy) derived from the LWS spectra with the IRAS band filters.
In the present study, we used the Standard Processed Data (SPD) of
off-line processing (OLP) version 9 products provided by the ISO data center.
The dark current and the drift in the detector responsivity were corrected
by using the LWS Interactive Analysis software (LIA version 7.3)![]() .
The ISO Spectral Analysis Package (ISAP version 1.6a)
.
The ISO Spectral Analysis Package (ISAP version 1.6a)![]() was then used for further data reduction.
The continuum spectra were stitched together by shifting each detector
signal with the offset method, adjusted to the SW5 channel in most galaxies.
In some cases where the SW5 channel is noisy, the adjustment was made
referring to the LW3 or LW4 channels.
The offsets between the detectors were typically less than 20%.
The line flux, the total far-infrared flux, and the dust temperature of the
continuum emission were derived by ISAP. The 60 and 100
was then used for further data reduction.
The continuum spectra were stitched together by shifting each detector
signal with the offset method, adjusted to the SW5 channel in most galaxies.
In some cases where the SW5 channel is noisy, the adjustment was made
referring to the LW3 or LW4 channels.
The offsets between the detectors were typically less than 20%.
The line flux, the total far-infrared flux, and the dust temperature of the
continuum emission were derived by ISAP. The 60 and 100 ![]() m flux densities
from the LWS spectra were found to agree with the IRAS data within about 20%.
The uncertainties in LWS spectra were suggested to be about 15-20% in
previous
works (e.g., Braine & Hughes 1999; Unger et al. 2000) and we
adopt 20% errors for the flux uncertainty.
m flux densities
from the LWS spectra were found to agree with the IRAS data within about 20%.
The uncertainties in LWS spectra were suggested to be about 15-20% in
previous
works (e.g., Braine & Hughes 1999; Unger et al. 2000) and we
adopt 20% errors for the flux uncertainty.
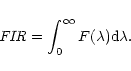
The continuum emission shorter than the 60 ![]() m region is affected by the
contribution from very small grains.
To derive a typical temperature of submicron grains
m region is affected by the
contribution from very small grains.
To derive a typical temperature of submicron grains ![]() in each
galaxy,
we fitted the LWS spectrum for
in each
galaxy,
we fitted the LWS spectrum for
![]()
![]() m with the following
equation:
m with the following
equation:
![\begin{figure}
\par\includegraphics[width=8.8cm,clip]{h2828f1.eps}\end{figure}](/articles/aa/full/2001/32/aah2828/img57.gif) |
Figure 1: The LWS spectrum and the fitted curve (Eq. (1)) for M 82. |
 |
(2) |
The observational results are summarized in Table 2.
![\resizebox{22cm}{!}{\includegraphics[angle=0]{h2828t2.eps}}](/articles/aa/full/2001/32/aah2828/img59.gif)
[C II]158 ![]() m is one of the most important lines for the
diagnosis of physical conditions of PDRs because of its
large luminosity and low critical density for collisional excitation.
However, the carbon atom has a lower ionization energy (11.26 eV) than hydrogen
(13.6 eV),
and carbon ions are expected to be present not only in the neutral region,
such as PDRs, but also in the ionized regions.
m is one of the most important lines for the
diagnosis of physical conditions of PDRs because of its
large luminosity and low critical density for collisional excitation.
However, the carbon atom has a lower ionization energy (11.26 eV) than hydrogen
(13.6 eV),
and carbon ions are expected to be present not only in the neutral region,
such as PDRs, but also in the ionized regions.
[N II]122 ![]() m is a good tracer of diffuse
low-density ionized gas, such as ELDWIM, because the ionization energy of
nitrogen atom nearly equals to that of hydrogen atom and the critical
density
for collisional excitation by electrons is about 300 electrons cm-3.
m is a good tracer of diffuse
low-density ionized gas, such as ELDWIM, because the ionization energy of
nitrogen atom nearly equals to that of hydrogen atom and the critical
density
for collisional excitation by electrons is about 300 electrons cm-3.
Oxygen atoms have an ionization energy of 13.6 eV almost the same as that of
hydrogen. [O I]63 ![]() m is one of the most luminous lines as well
as
[C II]158
m is one of the most luminous lines as well
as
[C II]158 ![]() m and it becomes a more efficient cooling line than
[C II]158
m and it becomes a more efficient cooling line than
[C II]158 ![]() m in high-density gases.
Together with the upper level transition at 145
m in high-density gases.
Together with the upper level transition at 145 ![]() m, it is an important
probe for neutral gas. [O I]145
m, it is an important
probe for neutral gas. [O I]145 ![]() m was weak and detected
only in a limited number of galaxies, and we
cannot examine the major fraction of the sample galaxies by using the
[O I]145
m was weak and detected
only in a limited number of galaxies, and we
cannot examine the major fraction of the sample galaxies by using the
[O I]145 ![]() m line.
[O III]88
m line.
[O III]88 ![]() m is a luminous line of dense ionized gas.
It has an upper level transition at 52
m is a luminous line of dense ionized gas.
It has an upper level transition at 52 ![]() m and
the line ratio of the 52
m and
the line ratio of the 52 ![]() m to 88
m to 88 ![]() m emission can be used to
derive the electron density of the ionized gas (e.g., Moorwood et al.
1980).
Unfortunately, the spectra in the 52
m emission can be used to
derive the electron density of the ionized gas (e.g., Moorwood et al.
1980).
Unfortunately, the spectra in the 52 ![]() m region do not have a
sufficient
signal to noise ratio to derive a reliable [O III]52
m region do not have a
sufficient
signal to noise ratio to derive a reliable [O III]52 ![]() m line
intensity for most of the present sample galaxies.
m line
intensity for most of the present sample galaxies.
In Table 3 we
list the electron density estimated from the ratio of the [O III] lines
and the neutral hydrogen density estimated from that of the [O I] lines
for the galaxies in which [OIII]52 ![]() m emission was detected.
These are rough estimates and
should be taken with caution because of the large errors
in the obtained line ratios. For about a half of the galaxies with the
detected [O III]52
m emission was detected.
These are rough estimates and
should be taken with caution because of the large errors
in the obtained line ratios. For about a half of the galaxies with the
detected [O III]52 ![]() m emission,
the line ratio is near the low-density limit and only upper limits of the
electron density are given. In the derivation of the neutral hydrogen
density we assume
that the gas temperature is 1000 K. Even with this temperature the line
ratios are in the low-density limit for the galaxies listed in
Table 3. For lower
temperatures the upper limits will further be decreased.
m emission,
the line ratio is near the low-density limit and only upper limits of the
electron density are given. In the derivation of the neutral hydrogen
density we assume
that the gas temperature is 1000 K. Even with this temperature the line
ratios are in the low-density limit for the galaxies listed in
Table 3. For lower
temperatures the upper limits will further be decreased.
In Fig. 2a,
Similar trends in the ratios of the line intensities to the far-infrared
intensity have been obtained for the normal galaxy sample (Malhotra et al.
1997, 2001b).
The present sample includes not only normal galaxies but also starburst
galaxies and AGNs.
In Fig. 3,
| object | n (cm-3)b | |
| Cen A | <140 | <56000 |
| Circinus |
|
<10000 |
| M 82 |
|
<1000 |
| NGC 1068 |
|
<48000 |
| NGC 2146 |
|
<45000 |
| NGC 253 | <70 | -c |
| NGC 3690 | <180 | <38000 |
a The electron density derived from the [O III]52 ![]() m to
88
m to
88 ![]() m line ratio.
m line ratio.
b The neutral hydrogen density derived from the [O I]145 ![]() m to
63
m to
63 ![]() m line ratio for the gas temperature of 1000 K.
m line ratio for the gas temperature of 1000 K.
c The line ratio of [O I] is too large and no reasonable density can be derived for NGC 253 (see Fig. 7 and next section).
![\begin{figure}
\par\includegraphics[width=8.8cm,clip]{h2828f3.eps}\end{figure}](/articles/aa/full/2001/32/aah2828/img65.gif) |
Figure 3:
a) Ratio of the [C II]158 |
Copyright ESO 2001
![\begin{figure}
\par\includegraphics[width=8.8cm,clip]{h2828f2.eps}\end{figure}](/articles/aa/full/2001/32/aah2828/img60.gif)