Of the 33 candidate sources which we have been able to identify spectroscopically, only three, and possibly five have projected linear sizes below 1 Mpc. These are B0217+367, B1709+465 and B1911+479. The uncertain cases are the source B0905+352, for which we do not have a well determined redshift yet and B1736+375 which may consist of two unrelated radio sources. Together with the 19 known GRGs in the area of the WENSS which share our selection criteria, we have so far identified 47 GRGs. This is by far the largest sample of sources with a projected linear size above 1 Mpc selected from a single survey. We also mention the existence of the large, but highly incomplete sample of GRGs which has been compiled by Ishwara-Chandra & Saikia (1999) from the literature. Although of similar size, the sample presented in this paper is better suited for statistical investigations of the radio and optical properties of GRGs since it has been selected from a single survey and in a more uniform matter.
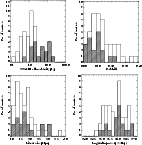
Figure 1a presents a
histogram of the 325-MHz flux density distribution of the sample
of 47 sources. The hatched bars indicate the flux density distribution of the sample of previously known GRGs.
Not surprisingly, we find that all newly discovered GRGs have flux
densities below 3 Jy, only; all ten GRGs with a 325-MHz flux density
above this value had already been identified as such.
For the area of the sky covered by WENSS, we can therefore agree with Riley (1989) who argued that no bright extended sources are missing from the LRL sample of bright radio sources (
S178>10.9 Jy, Dec
![]() ,
,
![]() ).
Furthermore, we have extended the range of flux densities at which low
redshift GRGs are found to sub-Jy levels. The median flux
density of the combined sample is 1.15 Jy, which is almost a factor of four
below the median value of the sample of previously known GRGs (see
Table 2).
).
Furthermore, we have extended the range of flux densities at which low
redshift GRGs are found to sub-Jy levels. The median flux
density of the combined sample is 1.15 Jy, which is almost a factor of four
below the median value of the sample of previously known GRGs (see
Table 2).
 |
Figure 1: Histograms of several properties of the new and old sample of GRGs. In all plots, the hatched bars indicate the distribution of previously known GRGs (see Table 1). a) (upper left): The 325-MHz flux density distribution of the GRGs. We have used a binsize of 0.2 in the logarithm of the flux density in Jy. b) (upper right): The redshift distribution of the GRGs, using a binsize of 0.03 in redshift. The source 8C0821+695 at z=0.538 lies outside the range of this plot. c) (lower left): The projected linear size distribution of the GRGs, using a binsize of 0.2 Mpc. The source 3C236 (D=5.7 Mpc) lies outside the range of this plot. d) (lower right): The rest-frame 325-MHz radio power distribution of the GRGs, using bins of width 0.2 in the logarithm of the radio power in WHz-1. |
The new sample of GRGs mostly contains GRGs at
![]() (see
Fig. 1b). The only exceptions are the sources
8C0821+695 (z=0.538; Lacy et al. 1993), B0750+434
(z=0.347) and B0925+420 (z=0.365). The redshift distribution peaks
at
(see
Fig. 1b). The only exceptions are the sources
8C0821+695 (z=0.538; Lacy et al. 1993), B0750+434
(z=0.347) and B0925+420 (z=0.365). The redshift distribution peaks
at
![]() .
The decrease in the number of sources towards higher
redshift is likely to be due to the lower angular size limit used in
the selection of the sample. Further, only more powerful GRGs will be
selected towards higher redshift, of which the space density is likely to
be lower. The median redshift of the sample
of new GRGs is 0.1404, which is higher than that of the old GRGs alone
(0.099; see Table 2). Since the average flux density is
lower this is not surprising. The median redshift of the combined
sample is 0.1175.
.
The decrease in the number of sources towards higher
redshift is likely to be due to the lower angular size limit used in
the selection of the sample. Further, only more powerful GRGs will be
selected towards higher redshift, of which the space density is likely to
be lower. The median redshift of the sample
of new GRGs is 0.1404, which is higher than that of the old GRGs alone
(0.099; see Table 2). Since the average flux density is
lower this is not surprising. The median redshift of the combined
sample is 0.1175.
We calculated the emitted radio power at a rest-frame frequency
of 325 MHz assuming isotropic emission.
Since the redshifts are low, the radio K-correction is only small.
For the new GRGs the measured
spectral index between 325 and 1400 MHz has been used; for the "old'' GRGs a spectral index of -0.8 has been assumed if no reliable literature value could be found. The distribution of 325-MHz radio powers has been plotted in
Fig. 1d. Despite the fact that a
large number of GRGs has been found at flux density values well below that of the "old'' sample, the distribution of the radio
powers of the new sources largely overlaps that of the old sources.
This is related to the, on average, higher redshifts of the new sources.
The combined sample is distributed rather uniformly between 1025and 1027 WHz-1; the sharp peak at the radio power bin
centered on
1026.1 WHz-1 is most likely a result of small number
statistics. At 325 MHz, the traditional separation between FRII and FRI-type
sources (Fanaroff & Riley 1974) lies near 1026 WHz-1,
which is close to the median value of the combined sample (see
Table 2).

|
Copyright ESO 2001