Most of the new YSOs identified by ISOCAM
are weak IR sources which were not detected by IRAS
and were not observed in previous ground-based
mid-IR surveys (dedicated to bright near-IR sources).
They likely correspond to low-luminosity, low-mass young stars.
In Sect. 4.1 below, we derive stellar luminosity estimates
for Class II and Class III objects
using published near-IR photometry from Barsony et al. (1997).
In Sect. 4.2, we provide mid-IR estimates of the disk luminosities,
![]() ,
for Class II YSOs.
Finally, calorimetric estimates of the bolometric
luminosities,
,
for Class II YSOs.
Finally, calorimetric estimates of the bolometric
luminosities,
![]() ,
for Class I YSOs are calculated in Sect. 4.3.
The luminosity function
of the
,
for Class I YSOs are calculated in Sect. 4.3.
The luminosity function
of the
![]() embedded cluster is then assembled in Sect. 4.4.
embedded cluster is then assembled in Sect. 4.4.
The J-band flux provides a good tracer of the stellar luminosity
for late-type PMS stars (i.e., T Tauri stars) because the J-band is
close to the maximum of the photospheric energy distribution
for such cool stars. It is also a good compromise between bands too much affected by
interstellar extinction at short wavelengths
(very few
![]() YSOs have been detected in the V, R, or I bands),
and the H, K and mid-IR bands which are contaminated by
intrinsic excesses.
Greene et al. (1994) showed that there is a good
correlation between the dereddened J-band flux and the stellar luminosity
derived by other methods. They pointed out that in
YSOs have been detected in the V, R, or I bands),
and the H, K and mid-IR bands which are contaminated by
intrinsic excesses.
Greene et al. (1994) showed that there is a good
correlation between the dereddened J-band flux and the stellar luminosity
derived by other methods. They pointed out that in
![]() this correlation is roughly consistent with a more theoretically
based correlation expected for 1-Myr old PMS stars following the
D'Antona & Mazzitelli (1994) evolutionary tracks.
More recently, Strom et al. (1995) and Kenyon & Hartmann (1995)
used the same model PMS tracks to directly convert dereddened
J-band fluxes into stellar masses. We adopt a similar approach here.
this correlation is roughly consistent with a more theoretically
based correlation expected for 1-Myr old PMS stars following the
D'Antona & Mazzitelli (1994) evolutionary tracks.
More recently, Strom et al. (1995) and Kenyon & Hartmann (1995)
used the same model PMS tracks to directly convert dereddened
J-band fluxes into stellar masses. We adopt a similar approach here.
The main difficulty and source of uncertainty with this method is due to the foreground extinction affecting the J-band fluxes. One must estimate the interstellar extinction toward each source in order to correct the observed J-band fluxes. We have used the observed near-IR colors to estimate the J-band extinction. The (J-H) color excess is most suitable for this purpose (e.g. Greene et al. 1994) since the dispersion in the intrinsic (J-H) colors of CTTSs is small and observationally well determined (cf. Strom et al. 1989; Meyer et al. 1997).
The reddening law quoted by Cohen et al. (1981),
which is determined for the standard CIT system, should be applicable
to the JHK photometry of Barsony et al. (1997).
We have thus used:
![\begin{displaymath}A_V = 9.09\times [(J-H)-(J-H)_0]
\end{displaymath}](/articles/aa/full/2001/22/aa9901/img111.gif) |
(1) |
![\begin{displaymath}A_V = 15.4\times [(H-K)-(H-K)_0]
\end{displaymath}](/articles/aa/full/2001/22/aa9901/img112.gif) |
(2) |
The uncertainties on MJ and MH result from
the typical uncertainties on the J, H, Kmagnitudes and on the intrinsic
colors (J-H)0 and (H-K)0. With
![]() ,
,
![]() (Barsony et al. 1997), and
(Barsony et al. 1997), and
![]() ( (J-H)0)
( (J-H)0)![]() ,
,
![]() ( (H-K)0)
( (H-K)0)![]() (Meyer et al. 1997),
we obtain the following typical uncertainties:
(Meyer et al. 1997),
we obtain the following typical uncertainties:
![]() ( MJ) = 0.39 mag, and
( MJ) = 0.39 mag, and
![]() ( MH) = 0.60 mag. In addition, the uncertainty on the
cluster distance (
( MH) = 0.60 mag. In addition, the uncertainty on the
cluster distance (
![]() pc) induces a maximum systematic error
of
pc) induces a maximum systematic error
of ![]() mag on MJ and MH.
mag on MJ and MH.
The absolute J-band magnitude MJ can be directly converted into a stellar
luminosity
![]() if the effective stellar temperature
if the effective stellar temperature
![]() is known:
is known:
![]() ,
where BCJ
is the bolometric correction for the J band depending only on
,
where BCJ
is the bolometric correction for the J band depending only on
![]() .
Pre-main sequence objects in the mass range
.
Pre-main sequence objects in the mass range
![]() are cool sub-giant stars with typical photospheric temperatures
are cool sub-giant stars with typical photospheric temperatures
![]() 2500-5500 K (e.g. Greene & Meyer 1995;
D'Antona & Mazzitelli 1994).
In this temperature range (0.34 dex wide),
the photospheric blackbody peaks close
to the J band (1.2
2500-5500 K (e.g. Greene & Meyer 1995;
D'Antona & Mazzitelli 1994).
In this temperature range (0.34 dex wide),
the photospheric blackbody peaks close
to the J band (1.2 ![]() m), so that the J-band bolometric correction
spans only a limited range,
m), so that the J-band bolometric correction
spans only a limited range,
![]() ,
corresponding
to a total shift in luminosity of only 0.4 dex.
Therefore, if we use a (geometrical) average value for the
effective temperature,
,
corresponding
to a total shift in luminosity of only 0.4 dex.
Therefore, if we use a (geometrical) average value for the
effective temperature,
![]() K,
we should not make an error larger than
K,
we should not make an error larger than
![]() dex on
dex on
![]() .
.
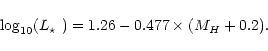
Furthermore, since
bright MJ sources tend to be of earlier spectral type than faint sources,
we can in fact achieve more accurate luminosity estimates.
Indeed, PMS stars are predicted to lie
within a well-defined strip of the HR diagram. This
is illustrated in Fig. 4 which displays
model evolutionary tracks and isochrones from D'Antona & Mazzitelli
(1998)
on a MJ-log
![]() diagram
for PMS stars with ages between
diagram
for PMS stars with ages between ![]() Myr and
Myr and ![]() Myr.
We have used the compilations of
Hartigan et al. (1994), Kenyon & Hartmann (1995),
and Wilking et al. (1999) to derive an approximate linear
interpolation for BCJ:
Myr.
We have used the compilations of
Hartigan et al. (1994), Kenyon & Hartmann (1995),
and Wilking et al. (1999) to derive an approximate linear
interpolation for BCJ:
![]() log10(
log10(
![]() ).
Figure 4 shows that, for a given observed value of MJ, the possible
range of log10(
).
Figure 4 shows that, for a given observed value of MJ, the possible
range of log10(
![]() )
is reduced to less than
)
is reduced to less than ![]() 0.15 dex, inducing a
maximum error of
0.15 dex, inducing a
maximum error of ![]() % (
% (![]() dex) on
dex) on
![]() .
Based on Fig. 4, we have adopted a linear
relationship between MJ and
.
Based on Fig. 4, we have adopted a linear
relationship between MJ and
![]() :
log
:
log
![]() (see the heavy dashed line in Fig. 4).
This leads to the following
(see the heavy dashed line in Fig. 4).
This leads to the following
![]() conversion:
conversion:
The
![]() conversion described above cannot be applied
to sources undetected in the J band. Instead, we use the H-band magnitude,
along with the extinction estimate derived from the (H-K) color, but with
the additional complication that the circumstellar (disk) emission
cannot be neglected.
Meyer et al. (1997) found that the H-band circumstellar excess
is on the order of 20% of the stellar flux, on average, for the
Taurus CTTS sample of Strom et al. (1989)
(for a
conversion described above cannot be applied
to sources undetected in the J band. Instead, we use the H-band magnitude,
along with the extinction estimate derived from the (H-K) color, but with
the additional complication that the circumstellar (disk) emission
cannot be neglected.
Meyer et al. (1997) found that the H-band circumstellar excess
is on the order of 20% of the stellar flux, on average, for the
Taurus CTTS sample of Strom et al. (1989)
(for a
![]() sample, see Greene & Lada 1996).
This excess, expressed as a veiling index
sample, see Greene & Lada 1996).
This excess, expressed as a veiling index
![]() (e.g.
Greene & Meyer 1995), is equal to
(e.g.
Greene & Meyer 1995), is equal to ![]() 0.2.
Accordingly, we have applied a systematic correction
0.2.
Accordingly, we have applied a systematic correction
![]() H
H
![]() mag.
The
mag.
The
![]() relationship obtained in a way similar to the
J-band relation is then:
relationship obtained in a way similar to the
J-band relation is then:
 |
(4) |
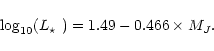
This method can also be applied to Class III YSOs, using different values
for (J-H)0 and (H-K)0.
We have derived
![]() for all Class III YSOs
using the following relationships:
for all Class III YSOs
using the following relationships:
![]() ,
or
,
or
![]() ;
and
log
;
and
log
![]() ,
or
log
,
or
log
![]() (the H-band IR excess for Class III YSOs is negligible).
(the H-band IR excess for Class III YSOs is negligible).
The resulting
MJ, MH, AV, and
![]() estimates are listed in
Table 3 for Class II YSOs, and in Tables 4 and 5 for Class III YSOs.
estimates are listed in
Table 3 for Class II YSOs, and in Tables 4 and 5 for Class III YSOs.
Since the SED of an embedded Class II YSO peaks in the mid-IR
range,
the ISOCAM fluxes should be approximately valid tracers of the total,
bolometric luminosities (
![]() ).
To estimate
).
To estimate
![]() for weak Class II sources, an empirical approach
thus consists in using this
for weak Class II sources, an empirical approach
thus consists in using this
![]() -
-
![]() relationship
after proper calibration on a sub-sample of (brighter) objects for which the
luminosity can be derived by a more direct method.
This approach has been adopted by, e.g., Olofsson et al. (1999).
Here, we have used the
relationship
after proper calibration on a sub-sample of (brighter) objects for which the
luminosity can be derived by a more direct method.
This approach has been adopted by, e.g., Olofsson et al. (1999).
Here, we have used the
![]() estimates of Sect. 4.1 to check that
a correlation is actually present between
estimates of Sect. 4.1 to check that
a correlation is actually present between
![]() and the mid-IR
fluxes. Figure 5 displays
and the mid-IR
fluxes. Figure 5 displays
![]() (corrected for extinction)
as a function of
(corrected for extinction)
as a function of
![]() for the 104 Class II sources detected both in the near-IR and in the mid-IR range.
for the 104 Class II sources detected both in the near-IR and in the mid-IR range.
A correlation is found, showing that, despite some scatter, the ISOCAM fluxes can be used to give rough estimates of the stellar luminosities of Class II YSOs. This is useful for the few ISOCAM sources of our sample which have not been detected at near-IR wavelengths.
The mid-IR emission of Class II YSOs is usually interpreted as
arising from warm dust in an optically thick circumstellar disk.
Using a simplified disk model (e.g. Beckwith et al. 1990),
it is easy to show that any observed monochromatic flux in
the optically thick, power-law range of the disk SED
is simply proportional to the total disk luminosity
![]() divided by the projection factor cos(i), where i is the
disk inclination angle to the line of sight.
In the Beckwith et al. (1990) model, the disk is parameterized by a power-law
temperature profile with three free parameters, T0, r0, and q,
such that:
divided by the projection factor cos(i), where i is the
disk inclination angle to the line of sight.
In the Beckwith et al. (1990) model, the disk is parameterized by a power-law
temperature profile with three free parameters, T0, r0, and q,
such that:
![]() .
Here, we have adopted
T0 = 1500 K, meaning that the disk inner radius
is at the dust sublimation temperature, and q=2/3, corresponding
to an IR spectral index
.
Here, we have adopted
T0 = 1500 K, meaning that the disk inner radius
is at the dust sublimation temperature, and q=2/3, corresponding
to an IR spectral index
![]() typical of CTTS spectra.
typical of CTTS spectra.
We must, however, account for the fact that the stellar emission
itself is not completely negligible
in the mid-IR bands, especially at 6.7 ![]() m.
A simple blackbody emission at
m.
A simple blackbody emission at
![]() K
gives
K
gives
| (5) | |||
| (6) |
 |
(7) |
According to this model, the mid-IR flux is a direct tracer of the
disk luminosity, and the
![]() correlation
of Fig. 5 simply expresses that
correlation
of Fig. 5 simply expresses that
![]() correlates with
correlates with
![]() .
The origin of
.
The origin of
![]() is either the release of gravitational
energy by accretion in the disk,
or the absorption/reprocessing of stellar photons by the dusty disk.
In the latter case,
is either the release of gravitational
energy by accretion in the disk,
or the absorption/reprocessing of stellar photons by the dusty disk.
In the latter case,
![]() is naturally proportional to
is naturally proportional to
![]() .
The fraction
.
The fraction
![]() of stellar luminosity reprocessed by the disk
depends on the spatial distribution of dust.
In the ideal case of an infinite, spatially flat
disk, this fraction is 0.25 (Adams & Shu 1986). If the disk is
flared,
of stellar luminosity reprocessed by the disk
depends on the spatial distribution of dust.
In the ideal case of an infinite, spatially flat
disk, this fraction is 0.25 (Adams & Shu 1986). If the disk is
flared,
![]() is larger, while it is smaller if the disk has a inner hole.
The theoretical
is larger, while it is smaller if the disk has a inner hole.
The theoretical
![]() correlations
plotted in Fig. 5 correspond to
correlations
plotted in Fig. 5 correspond to
![]() and to three
representative inclination angles.
The fact that this simple
model accounts for the
observed correlation quite well,
suggests that the disks of most
and to three
representative inclination angles.
The fact that this simple
model accounts for the
observed correlation quite well,
suggests that the disks of most
![]() Class II YSOs are passive disks
dominated by reprocessing.
This is consistent with recent estimates of the disk accretion level
in Taurus CTTSs (e.g. Gullbring et al. 1998).
The typical disk accretion rate of a CTTS is estimated to be
Class II YSOs are passive disks
dominated by reprocessing.
This is consistent with recent estimates of the disk accretion level
in Taurus CTTSs (e.g. Gullbring et al. 1998).
The typical disk accretion rate of a CTTS is estimated to be
![]() yr, corresponding to an accretion luminosity
yr, corresponding to an accretion luminosity
![]() for
for
![]() and
and
![]() (i.e.,
(i.e.,
![]() at 1
at 1![]() Myr).
In this case, the luminosity due to reprocessing is
Myr).
In this case, the luminosity due to reprocessing is ![]() 5 times
larger than the accretion luminosity in the disk.
5 times
larger than the accretion luminosity in the disk.
On the other hand, 37 sources (among a total of 104) are located
above the passive disk model lines in Fig. 5.
These are good candidates for having an active disk with an accretion
rate typically larger than
![]() yr.
yr.
Overall, we find that the median
![]() ratio is 0.41 for the
93 Class II sources detected in the near-IR and
with
ratio is 0.41 for the
93 Class II sources detected in the near-IR and
with
![]() mJy (i.e. the completeness level derived in
Sect. 2.4).
Using this ratio, we have derived rough estimates of the
stellar luminosities of the 15 Class II YSOs which have no
near-IR photometry (see Table 3) as follows:
mJy (i.e. the completeness level derived in
Sect. 2.4).
Using this ratio, we have derived rough estimates of the
stellar luminosities of the 15 Class II YSOs which have no
near-IR photometry (see Table 3) as follows:
| (8) |
The most direct method of estimating the total
luminosities
![]() of embedded YSOs consists in integrating the
observed SEDs (cf. WLY89).
However, since most of the
of embedded YSOs consists in integrating the
observed SEDs (cf. WLY89).
However, since most of the ![]() Ophiuchi Class II and Class III YSOs
are deeply embedded within the cloud (
Ophiuchi Class II and Class III YSOs
are deeply embedded within the cloud (
![]() ), only
a negligible fraction of their bolometric luminosity can be recovered
by finite-beam IR observations (e.g. Comerón et al. 1993).
We thus do not attempt to derive calorimetric estimates of
), only
a negligible fraction of their bolometric luminosity can be recovered
by finite-beam IR observations (e.g. Comerón et al. 1993).
We thus do not attempt to derive calorimetric estimates of
![]() for these sources.
In contrast, the calorimetric method is believed to be appropriate
for Class I YSOs since these are self-embedded in substantial
amounts of circumstellar material which re-radiate locally
the absorbed luminosity (cf. WLY89 and AM94).
Using our new mid-IR measurements, we have evaluated
the calorimetric luminosities (
for these sources.
In contrast, the calorimetric method is believed to be appropriate
for Class I YSOs since these are self-embedded in substantial
amounts of circumstellar material which re-radiate locally
the absorbed luminosity (cf. WLY89 and AM94).
Using our new mid-IR measurements, we have evaluated
the calorimetric luminosities (
![]() )
of the 16 Class I YSOs
observed in our survey.
Only 7 of them have reliable IRAS fluxes
up to 60 or 100
)
of the 16 Class I YSOs
observed in our survey.
Only 7 of them have reliable IRAS fluxes
up to 60 or 100 ![]() m (IRS54, IRS44, GSS30, IRS43, EL29, IRS48,
IRS51). For these, the median of the ratio of
m (IRS54, IRS44, GSS30, IRS43, EL29, IRS48,
IRS51). For these, the median of the ratio of
![]() (6.7-14.3
(6.7-14.3 ![]() m)
to
m)
to
![]() is found to be 9.8, suggesting that the typical fraction of a
Class I source's luminosity radiated between 6.7
and 14.3
is found to be 9.8, suggesting that the typical fraction of a
Class I source's luminosity radiated between 6.7
and 14.3 ![]() m is
m is ![]() 10%.
Assuming that this ratio is representative of all Class I YSOs,
we have derived estimates of
10%.
Assuming that this ratio is representative of all Class I YSOs,
we have derived estimates of
![]() for the
remaining 9 weaker Class I sources (i.e., CRBR85, LFAM26, LFAM1, WL12, IRS46,
CRBR12, IRS67, CRBR42, WL6). These luminosities are listed in Table 2.
for the
remaining 9 weaker Class I sources (i.e., CRBR85, LFAM26, LFAM1, WL12, IRS46,
CRBR12, IRS67, CRBR42, WL6). These luminosities are listed in Table 2.
Combining the
![]() luminosities determined in Sect. 4.1 for the
sources detected in the near-IR with the
luminosities determined in Sect. 4.1 for the
sources detected in the near-IR with the
![]() estimates from
estimates from
![]() for the sources without near-IR measurements (Sect. 4.2),
we have built a luminosity function for Class II YSOs which represents
a major improvement over previous studies (see Fig. 6a).
In terms of
for the sources without near-IR measurements (Sect. 4.2),
we have built a luminosity function for Class II YSOs which represents
a major improvement over previous studies (see Fig. 6a).
In terms of
![]() ,
the completeness level for this population
can be estimated from the
,
the completeness level for this population
can be estimated from the
![]() completeness limit
derived in Sect. 2.4 (
completeness limit
derived in Sect. 2.4 (
![]() mJy)
using Eq. (8):
mJy)
using Eq. (8):
![]() .
While the luminosity function previously published by
Greene et al. (1994) included only 33 (bright) Class II sources
and suffered from severe incompleteness below
.
While the luminosity function previously published by
Greene et al. (1994) included only 33 (bright) Class II sources
and suffered from severe incompleteness below
![]() ,
our present completeness level
is a factor
,
our present completeness level
is a factor ![]() 30-50 lower.
The new luminosity function shows a marked flattening
in logarithmic units at
30-50 lower.
The new luminosity function shows a marked flattening
in logarithmic units at
![]() ,
well above our completeness limit.
This important new feature is discussed in Sect. 5 below.
,
well above our completeness limit.
This important new feature is discussed in Sect. 5 below.
![\begin{figure}
\mbox{\includegraphics[width=8.9cm,clip]{ms9901f6a.eps}\includegraphics[width=5.8cm]{ms9901f6b.eps} }\end{figure}](/articles/aa/full/2001/22/aa9901/img187.gif) |
Figure 6:
Luminosity functions (LF) a) for the 123 Class II YSOs
(continuous histogram with statistical
error bars).
The function corresponding to a similar histogram
shifted by half the 0.2 dex bin size
is shown as a thin curve to illustrate the level of
statistical fluctuations due to binning.
The LF of 33 Class II sources from Greene et al. (1994)
is displayed as a darker histogram
(rebinned to 0.2 dex bins, and rescaled to d=140 pc
for better comparison with the new LF).
The typical
|
Based on the
![]() estimates of Sect. 4.3,
a new bolometric luminosity function for the
16 Class I YSOs of
estimates of Sect. 4.3,
a new bolometric luminosity function for the
16 Class I YSOs of
![]() is displayed in Fig. 6b.
The associated completeness level is
derived from
is displayed in Fig. 6b.
The associated completeness level is
derived from
![]() mJy and
mJy and
![]() mJy (Sect. 2.4)
using
mJy (Sect. 2.4)
using
![]() (6.7-14.3
(6.7-14.3 ![]() m)
m)
![]() (Sect. 4.3):
(Sect. 4.3):
![]() .
The median
.
The median
![]() for Class I YSOs
is
for Class I YSOs
is
![]() ,
which is
,
which is ![]() 8 times larger
than the median
8 times larger
than the median
![]() of Class II YSOs (
of Class II YSOs (
![]() ).
The luminosities of Class I YSOs span a range of two orders of magnitude
between
).
The luminosities of Class I YSOs span a range of two orders of magnitude
between ![]() 0.1
0.1![]() and
and ![]() 10
10![]() ,
which is roughly as wide as
the luminosity range spanned by Class II YSOs.
The comparatively large value of
,
which is roughly as wide as
the luminosity range spanned by Class II YSOs.
The comparatively large value of
![]() for Class I YSOs is probably
due to a dominant contribution of accretion luminosity
as expected in the case of protostars.
for Class I YSOs is probably
due to a dominant contribution of accretion luminosity
as expected in the case of protostars.
In Fig. 6c, we plot the luminosity function of
the 55 Class III sources that are located within the CS contours
of Fig. 1 and for which we have enough near-IR data
to derive
![]() according to the procedure described in Sect. 4.1.
This sample comprises 19 confirmed Class IIIs from Table 4 together
with 36 candidate Class III sources from Table 5.
It might be contaminated by a few background/foreground sources but
is characterized by a relatively well defined completeness luminosity.
From the completeness level
according to the procedure described in Sect. 4.1.
This sample comprises 19 confirmed Class IIIs from Table 4 together
with 36 candidate Class III sources from Table 5.
It might be contaminated by a few background/foreground sources but
is characterized by a relatively well defined completeness luminosity.
From the completeness level
![]() mJy
and using Eq. (5) with an average extinction
correction corresponding to AV = 17 mag, we get
mJy
and using Eq. (5) with an average extinction
correction corresponding to AV = 17 mag, we get
![]() ,
which is
,
which is ![]() 6 times higher than
6 times higher than
![]() .
Deep X-ray observations with XMM
should improve the completeness luminosity for Class III YSOs
by an order of magnitude in the near future (cf. discussion by Grosso et al. 2000
in a companion paper).
.
Deep X-ray observations with XMM
should improve the completeness luminosity for Class III YSOs
by an order of magnitude in the near future (cf. discussion by Grosso et al. 2000
in a companion paper).
Copyright ESO 2001
![\begin{figure}
\par\includegraphics[width=7.2cm,clip]{ms9901f4.eps}
\end{figure}](/articles/aa/full/2001/22/aa9901/img133.gif)
![\begin{figure}
\par\includegraphics[width=8.5cm,clip]{ms9901f5new.eps}
\end{figure}](/articles/aa/full/2001/22/aa9901/img158.gif)