 |
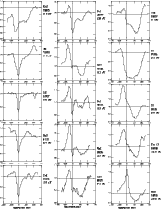
Figure 20: Accretion components of lines of different excitation potentials in the spectrum with enhanced accretion (HJD 2450388.5) |
 |
Figure 20: Accretion components of lines of different excitation potentials in the spectrum with enhanced accretion (HJD 2450388.5) |
The best indicators of accretion are the lines of Na I D and the O I 7773Å triplet. Occasionally, when accretion is enhanced, red-shifted components appear in many other lines. In one night (HJD 2450388.5) the accretion was exceptionally strong. The accretion components were present in almost all the emission lines, which gives an opportunity to describe the spectrum of the accreting gas in more detail. Profiles of selected lines of different excitation potentials are shown in Fig. 20. The common feature is that the accretion line profile consists of two different components: a low velocity absorption at about 0kms-1 or slightly blue-shifted, and a high velocity absorption with the bottom around +250kms-1 and extending to +400kms-1. The low excitation lines of K I, Li I, Ba II, Ca I and Fe I all show enhanced low-velocity absorptions with a weak red-extending wing. The lines of excitation potentials between 2 and 7eV have both low-velocity and high-velocity absorptions. The lines of the highest excitations, more than 8eV, show mostly high-velocity components.
The presence of accretion-induced enhancements of the low excitation, low ionization lines in the spectrum of RW Aur A were reported recently by Stout-Batalha et al. (2000) with emphasis on Li I. They suggested that the enhancement of absorption at the line centre is due to additional absorption by cool gas at the beginning of the accretion flow.
The EW of the central absorption of K I 7699Å can be used as an
indicator
of this low velocity gas. We find a correlation between the EW of
K I 7699Å and the EW of the blue-shifted absorption of
H![]() ,
both correlating with B-V (Fig. 21).
This is an observational evidence that the inflow and the outflow are
related processes.
,
both correlating with B-V (Fig. 21).
This is an observational evidence that the inflow and the outflow are
related processes.
The difference between this spectrum with enhanced accretion and the average spectrum of RW Aur A is shown in Fig. 22. Note that the dips of the absorptions are blue-shifted from -2 to -15kms-1. The shift is larger for stronger lines (up to -100kms-1 in Na D). No molecular bands of TiO were found in the differential spectrum.
In several lines of neutrals and ions we measured the
relative depths of the low velocity components and the relative depths at
+250kms-1. Assuming LTE conditions we find
![]() K,
K,
![]() for the low velocity components, which are similar to
the parameters obtained for the broad emission lines.
The high-velocity absorptions are
formed at higher temperature (>8000K) and higher densities
(
for the low velocity components, which are similar to
the parameters obtained for the broad emission lines.
The high-velocity absorptions are
formed at higher temperature (>8000K) and higher densities
(
![]() )
but different sets of lines give different values.
)
but different sets of lines give different values.
Copyright ESO 2001