| |
Figure 6: Fluxes of the broad emission lines correlate with colour (fluxes in units of 10-12ergcm-2Å-1) |
In this section, we give a brief overview of different spectral
features. Several components can be distinguished in the spectrum.
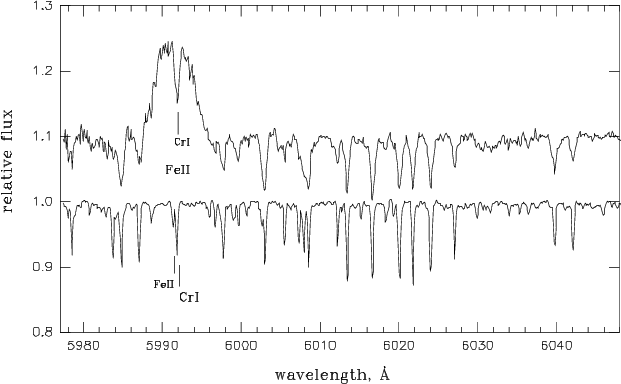
The weak absorption lines (WALs) can be identified as the highly veiled
photospheric spectrum of a K1-K4V star (average veiling = 3; see
Fig. 3).
In the spectral classification, we try to avoid the lines originating from
low excitation levels, because they can be enhanced by additional
absorption in the accreting gas well above the photospheric level
(Stout-Batalha et al. 2000). This effect is quite strong
in density sensitive lines, like Ba II 6141Å
(
![]() eV).
More details about
the accretion enhancement of absorption lines, or shell lines,
are given in Sect. 7.
The width of the WALs, if interpreted only as rotationally
broadened, corresponds on average to
eV).
More details about
the accretion enhancement of absorption lines, or shell lines,
are given in Sect. 7.
The width of the WALs, if interpreted only as rotationally
broadened, corresponds on average to
![]() kms-1,
but was found variable from night to night from 16 to 40kms-1.
Variability in radial velocity of the WALs is discussed in
Sect. 6.
Hereafter, we refer to these weak absorption lines
as the "photospheric spectrum'', although there may be a contribution
from the layers above the photosphere (the shell).
The spectral region, where the photospheric
spectrum is least blended with emission lines, is shown in Fig. 3.
In some nights, the veiling was so high that very little of
the photospheric spectrum remained visible.
kms-1,
but was found variable from night to night from 16 to 40kms-1.
Variability in radial velocity of the WALs is discussed in
Sect. 6.
Hereafter, we refer to these weak absorption lines
as the "photospheric spectrum'', although there may be a contribution
from the layers above the photosphere (the shell).
The spectral region, where the photospheric
spectrum is least blended with emission lines, is shown in Fig. 3.
In some nights, the veiling was so high that very little of
the photospheric spectrum remained visible.
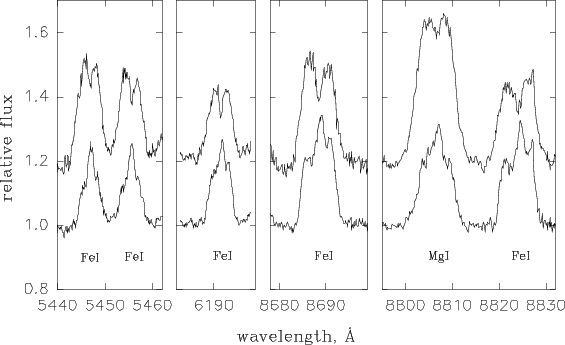 |
Figure 9: The narrow absorptions on top of the broad emissions (upper spectra) turn into narrow emissions (lower spectra) when the veiling is very high |
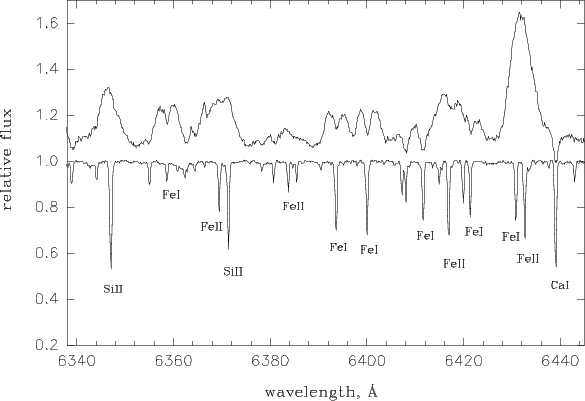
An outstanding characteristic of the spectrum are the numerous
intensive broad emission lines (BELs), most of them belonging to
neutral and singly ionised metals. The FWHM of the BELs is
200-280kms-1for Fe I and Fe II lines, and up to 500kms-1 for H![]() .
The line profiles of the BELs are variable on a time scale of one day.
No large variations of the line profiles were noticed
during 1-2 hours. An example of the BELs' variability is shown in
Fig. 4.
The blue and red wings of the BELs at the line base remain symmetrically
extended to
.
The line profiles of the BELs are variable on a time scale of one day.
No large variations of the line profiles were noticed
during 1-2 hours. An example of the BELs' variability is shown in
Fig. 4.
The blue and red wings of the BELs at the line base remain symmetrically
extended to
![]() kms-1, while the intensities of the red
and blue parts of the profile can change considerably.
kms-1, while the intensities of the red
and blue parts of the profile can change considerably.
Most of the BELs can easily be identified using the spectrum of the supergiant 41 Cyg (F5II) for comparison (see Fig. 5). Note, that narrow absorptions, similar to the WALs, can be found superimposed on top of the broad Fe I emissions, but are usually absent in the Fe II emissions. As a result, the BELs of Fe II look split into two parts, while the BELs of Fe II and other ions have a more triangular profile. These narrow absorptions on top of emission lines vary in radial velocity and width in correlation with the WALs. One might identify them as the photospheric lines seen through the optically thin emission. Then, the absence of these absorptions on top of the Fe II lines is understandable: the Fe II lines are very weak in the photospheric spectrum of a K dwarf. However, the average profile of these absorptions is systematically broader than that of the WALs.
We measured the equivalent widths of 25 almost unblended, broad emissions of
Fe I and Fe II observed in the spectrum with the most intensive
lines, and
in the spectrum with the least intensive lines.
Then, the equivalent widths were
converted into fluxes using our photometric data.
In both cases the lines can be brought to a curve of growth
with
![]() K and
K and
![]() .
However, the lines can be
formed
in non-LTE conditions, and these values should be considered as rough
estimates.
.
However, the lines can be
formed
in non-LTE conditions, and these values should be considered as rough
estimates.
The fluxes in the emission lines show no clear correlation with the
brightness of the star. Instead, there is a good correlation between
the line fluxes and the B-V colour (Fig. 6). This correlation
is partly due to the contribution of the emission lines to the
B and V magnitudes.
For the spectrum with the most intensive emissions, we estimated the
contribution to the B passband as
![]() ,
and to the V passband
as
,
and to the V passband
as
![]() .
That is, most of the B-V range in Fig. 6
is caused by this effect of the emission lines. The full range of variations
in B-V is, however, much larger (see Fig. 1).
Other mechanisms, like temperature
variations or extinction by circumstellar dust may enter.
.
That is, most of the B-V range in Fig. 6
is caused by this effect of the emission lines. The full range of variations
in B-V is, however, much larger (see Fig. 1).
Other mechanisms, like temperature
variations or extinction by circumstellar dust may enter.
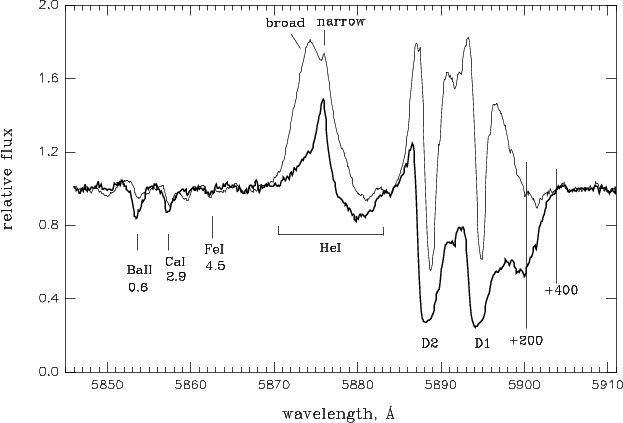
The next obvious spectral features are the red-shifted absorption components in many lines. We will refer to these as the accretion components. In some lines, like the O I 7773Å triplet, Na I D1/D2, He I D3, the accretion components are present permanently, though strongly variable in strength. The maximum velocity (extension of the red wing) is about 400kms-1. Examples of these variations are shown in Fig. 7. Note, that the residual intensity at the bottom of the red-shifted absorption in the oxygen line can be as small as 0.4 of the continuum intensity. In Fig. 8 we show the two most differing spectra in the region of the D1, D2 and D3 lines. In the following analysis we will use as an "accretion parameter'' the equivalent width (EW) of the D1 absorption between the velocities of +200 and +400kms-1. There are many other spectral lines, both neutrals and ions, which occasionally show strong accretion components. The spectrum of the accreting gas is described in more detail in Sect. 7. Because of the accretion components, the maximum intensity (or centre of gravity) of the BELs is usually blue-shifted. For example, for He I broad: -36kms-1; Fe II 5316Å: -28kms-1; Pa13: -25kms-1; Fe I 5455Å: -14kms-1 and Fe I 6191Å: -8kms-1.
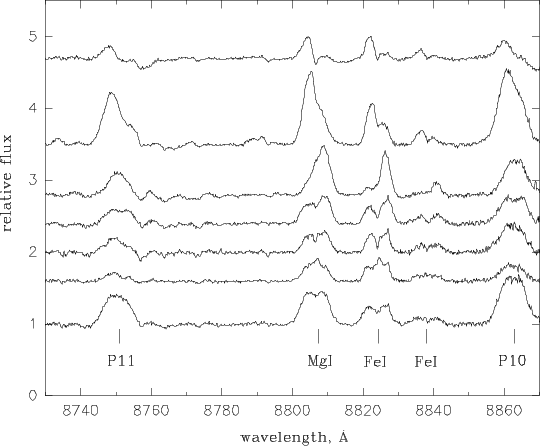
Besides the BELs, there are a few narrow emission lines (NELs) with
FWHM of about 40kms-1. A comprehensive study of the narrow
emission lines
in spectra of T Tauri stars (including RW Aur) was done by
Batalha et al. (1996) with one conclusion being that the lines are
formed near
the magnetic footpoints of the accretion column. In our spectra,
the narrow emission components are clearly visible in He I 5875Å,
6678Å and
7065Å. These lines have
both broad and narrow emission components.
The line profile of He I can be decomposed into three Gaussians:
a broad emission with FWHM
=200-250kms-1, centred at
![]() kms-1, a narrow emission with FWHM =35-60kms-1,
centred at about +10kms-1,
and an accretion component with FWHM =150kms-1, centred at about
+250kms-1.
Only a narrow component is present in the He II 4686Å emission,
at the average radial velocity of +20kms-1.
Occasionally, weak narrow peaks can be found on top of many other
lines in the spectrum which shows the highest veiling (HJD 2450382.5),
as shown in Fig. 9. The line D3 is
present in all of our spectra (it falls in the middle of the spectral
order), and therefore we use
it for the analysis of the NEL correlation with other parameters in
Sect. 6.
kms-1, a narrow emission with FWHM =35-60kms-1,
centred at about +10kms-1,
and an accretion component with FWHM =150kms-1, centred at about
+250kms-1.
Only a narrow component is present in the He II 4686Å emission,
at the average radial velocity of +20kms-1.
Occasionally, weak narrow peaks can be found on top of many other
lines in the spectrum which shows the highest veiling (HJD 2450382.5),
as shown in Fig. 9. The line D3 is
present in all of our spectra (it falls in the middle of the spectral
order), and therefore we use
it for the analysis of the NEL correlation with other parameters in
Sect. 6.
A blue-shifted absorption component indicating
gas outflow (wind) is a typical characteristic of
H![]() ,
H
,
H![]() ,
Na I D
and the IR triplet of Ca II. Examples of variability
in these line profiles are shown in Fig. 10.
,
Na I D
and the IR triplet of Ca II. Examples of variability
in these line profiles are shown in Fig. 10.
And, finally, forbidden lines are always present in the spectra, e.g. [O I] 6300Å, [S II] 6716Å and 6731Å. The line profiles are similar to those published by Hamann (1984).
Copyright ESO 2001