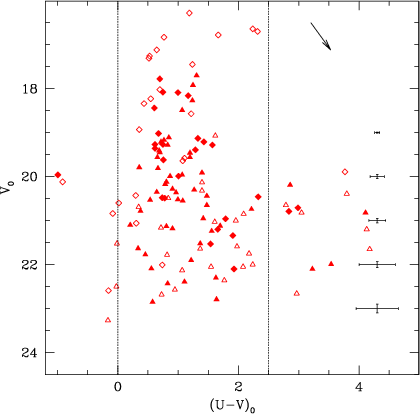
The UV color-magnitude diagram (CMD) for all the objects is presented in Fig. 5. As before, the objects retained as good candidates after visual inspection of the images are plotted as filled symbols and the rest as open symbols. The objects from Field 1 are plotted as diamonds, the ones from Field 2 as triangles. Vertical lines indicate the color range within which the MW and majority of M 31 globular clusters are located. Note that several open symbols are found in the same area of the CMD as globular clusters. Spectroscopic observations are necessary to assess the real nature of these objects.
The object at (U-V)0=-0.99 and V0=19.96 (f1.GC-8) is located very close to the area where a large number of bright young blue stars were found (Rejkuba et al. 2001a). It might be a young object, precursor of a globular cluster, similar to the ones found in other merging galaxies (e.g. Whitmore et al. 1999), as well as to some clusters found in the central regions of NGC 5128 (Holland et al. 1999).
There is a number of objects brighter than V<17.5 that were all identified in Field 1. Probably these are bright stars blended with some faint companions. They all appear saturated in the V-band VLT images and were found in the lower right corner (south-west) of Field 1 on U-band images. Their FWHM, that was larger than stellar, is probably an artifact due to the distortion of the PSF in that part of the chip.
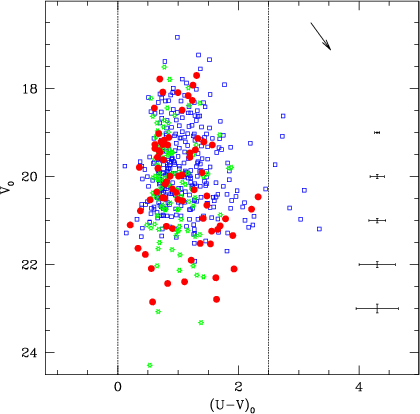 |
Figure 6: Color-magnitude diagram for globular clusters in NGC 5128 (filled circles) compared to the MW (stars) and M 31 globular clusters (open squares) |
Figure 6 shows the CMD for all NGC 5128 globular clusters (filled circles) that satisfy all the selection criteria. This CMD is compared with the ones of the MW (stars) and M 31 (squares) globular clusters. Globular clusters populate a similar region of the CMD in the three galaxies. Data for the MW clusters were taken from the web page of W. Harris (1996). M 31 clusters are from the catalogue of Barmby et al. (2000). I did not take into account globular clusters with colors bluer than B-V=0.55, as they might be younger objects (Barmby et al. 2000). The magnitudes were corrected for the mean reddening towards M 31 ( E(B-V)=0.08). For the globular cluster candidates in NGC 5128, a mean foreground reddening of E(B-V)=0.1 (Burstein & Heiles 1982; Schlegel et al. 1998) was used. The reddening vector plotted in the upper right corner corresponds to E(B-V)=0.2.
By constraining the colors to be within the range of the reddest MW and bluest M 31 globular cluster colors (cf. the third selection criterion) I exclude distant compact galaxies (Barrientos 2000). The total number of bona fide globular cluster candidates is 71, with 23 in Field 1 and 48 in Field 2. Only those are taken into account in the further analysis.
![\begin{figure}
\par\includegraphics[angle=270,width=17.5cm]{10447f7.eps} \end{figure}](/articles/aa/full/2001/15/aa10447/img66.gif) |
Figure 7:
Color-color diagram for globular clusters
in NGC 5128 (filled circles). The lines are the isochrones of SSP models.
The number next to each isochrone indicate the age in Gyr. Each isochrone is
plotted for a range of metallicities and for
a Salpeter IMF. The four different models are from:
a) Kurth et al. (1999) for Z=0.0001, 0.0004, 0.008, 0.004,
0.02 and 0.05; b) Bruzual & Charlot (2001) for the same range of
age and Zas the previous model; c) Maraston (2001) for
|
![]() band magnitudes were measured
on SOFI images for 23 of the bona fide globular cluster candidates
and 10 of the extended objects,
some of which might also be globular clusters.
The U-V color is strongly dependent on both metallicity and
age
(Buzzoni 1995; Kurth et al. 1999; Maraston
1998).
Adding the K-band
magnitude information it is possible to disentangle the young from the old
objects. The color-color plot is shown in Fig. 7. Filled dots are
used to denote globular cluster candidates that satisfied all of the
classification criteria.
The lines are isochrones of evolutionary synthesis models
of simple stellar populations (SSP) calculated for a Salpeter IMF and a
range of metallicities from Z=0.0001 to 0.05 (see caption for the exact
metallicities plotted for each model).
The four different models displayed on panels (a), (b), (c) and (d) are
from Kurth et al. (1999),
Bruzual & Charlot (2001), Maraston (2001) and Worthey
(1994), respectively.
The ages are indicated with numbers denoting Gyr next to the lines.
Unfortunately the models do not allow one
to discriminate between ages in the range of
5-20 Gyr. However, it is comforting to see that almost all the objects are
concentrated towards the isochrones in excess of 1 Gyr. This is
additional evidence that they are indeed globular clusters.
A spread of metallicities of more than 1.5 dex is also evident.
band magnitudes were measured
on SOFI images for 23 of the bona fide globular cluster candidates
and 10 of the extended objects,
some of which might also be globular clusters.
The U-V color is strongly dependent on both metallicity and
age
(Buzzoni 1995; Kurth et al. 1999; Maraston
1998).
Adding the K-band
magnitude information it is possible to disentangle the young from the old
objects. The color-color plot is shown in Fig. 7. Filled dots are
used to denote globular cluster candidates that satisfied all of the
classification criteria.
The lines are isochrones of evolutionary synthesis models
of simple stellar populations (SSP) calculated for a Salpeter IMF and a
range of metallicities from Z=0.0001 to 0.05 (see caption for the exact
metallicities plotted for each model).
The four different models displayed on panels (a), (b), (c) and (d) are
from Kurth et al. (1999),
Bruzual & Charlot (2001), Maraston (2001) and Worthey
(1994), respectively.
The ages are indicated with numbers denoting Gyr next to the lines.
Unfortunately the models do not allow one
to discriminate between ages in the range of
5-20 Gyr. However, it is comforting to see that almost all the objects are
concentrated towards the isochrones in excess of 1 Gyr. This is
additional evidence that they are indeed globular clusters.
A spread of metallicities of more than 1.5 dex is also evident.
In Fig. 7 most of the clusters lie slightly to the right and below the model lines. There are two possible explanations. First, a difference with the SSP models, particularly significant in U-V and B-V colors, has already been pointed out by Barmby & Huchra (2000). They suggested U fluxes from the stellar libraries, systematic problems with modeling HB color and observational errors as possible causes of this offset. Second, in the data presented here additional offset may arise from the difference between the Bessel and Johnson U-band transmission curves (Bessel 1995).
Copyright ESO 2001