I used the VLT Antu (UT1)+FORS1 (FOcal Reducer/low dispersion Spectrograph)
to obtain the Bessel U- and V-band photometry of globular
clusters and stars in two different fields in NGC 5128.
The field of view was
![]() and
the pixel scale
and
the pixel scale
![]() pixel. The FORS1 detector is a
pixel. The FORS1 detector is a
![]() CCD with 24
CCD with 24 ![]() m pixels.
m pixels.
Field 1 was centered on the prominent N-E shell ![]() 14
14![]() away from the
center of the galaxy, while Field 2
was chosen to overlap with
Soria et al. (1996) HST observations at a
distance of
away from the
center of the galaxy, while Field 2
was chosen to overlap with
Soria et al. (1996) HST observations at a
distance of ![]() 9
9![]() from the
center of the galaxy. Observations were carried out on the 11th and 12th
of July 1999 in service mode. Pairs of images of 15 min exposure time were
taken per field in each filter. The journal of observations
is given in Table 1.
from the
center of the galaxy. Observations were carried out on the 11th and 12th
of July 1999 in service mode. Pairs of images of 15 min exposure time were
taken per field in each filter. The journal of observations
is given in Table 1.
In addition to VLT data, I obtained a 45 min long exposure of Field 2
in ![]() using SOFI at the
New Technology Telescope (NTT) at the ESO/La Silla
Observatory. The field of view of SOFI is
using SOFI at the
New Technology Telescope (NTT) at the ESO/La Silla
Observatory. The field of view of SOFI is
![]() and the pixel scale
and the pixel scale
![]() pixel. This field is smaller than the one
of FORS1 and so only about 40% of objects in one field
have
pixel. This field is smaller than the one
of FORS1 and so only about 40% of objects in one field
have ![]() -band magnitudes.
-band magnitudes.
Both fields were also observed with the Wide Field Imager (WFI) at the 2.2 m telescope on La Silla. The data from WFI observations are used here to assess the V-band magnitude of some of the brightest cluster candidates that were saturated on V-band FORS1 images. I calibrated the WFI photometry by comparing magnitudes of globular clusters well exposed (but not saturated) on VLT and WFI images in order to determine the zero point of WFI observations.
For optical data (VLT and 2.2 m images),
the standard image processing, including the overscan and
bias subtraction and the
flat-field correction, was performed within the IRAF![]() environment.
The pairs of exposures in each filter were registered using the imalign task and averaged to obtain the
final images. Cosmic rays were rejected in this process using the crreject
algorithm within the imcombine task in IRAF. Bad pixels were masked out.
environment.
The pairs of exposures in each filter were registered using the imalign task and averaged to obtain the
final images. Cosmic rays were rejected in this process using the crreject
algorithm within the imcombine task in IRAF. Bad pixels were masked out.
The standard procedure in reducing infrared (IR) data consists of sky subtraction, flat-field correction, registering and combining the images. Good sky subtraction in a crowded field like that of a galactic halo is particularly important. For that step I used the DIMSUM package (Stanford et al. 1995) within IRAF. In DIMSUM the sky subtraction is made in two passes. In the first one a median sky is computed for each image from 6 temporarily closest frames. The shifts between the sky subtracted frames are then computed and all the images stacked together using a rejection algorithm to remove cosmic rays. An object mask is computed for the coadded image and then shifted back in order to create object masks for the individual frames. In the second pass, the sky subtraction is made using the object masks to avoid overestimation of the sky level. These masks are also used to check that the bright object cores were not removed as cosmic rays in the previous pass. After the mask-pass sky subtraction, the frames are registered with imalign and combined with imcombine task in IRAF.
NGC 5128 is close enough that its globular clusters can be distinguished
from stars on the basis of their slightly non-stellar appearance on
high resolution ground-based images taken in excellent seeing conditions.
At the distance of NGC 5128 (3.6 Mpc) a typical MW globular cluster
with a mean King core
radius of
![]() pc had, on the best seeing VLT images, a
FWHM of 2.6 pix, which is
pc had, on the best seeing VLT images, a
FWHM of 2.6 pix, which is ![]() 0.4
pix bigger than the stellar FWHM.
The excellent seeing, especially on the V-band images of Field 2,
allowed me to identify globular cluster candidates
with
0.4
pix bigger than the stellar FWHM.
The excellent seeing, especially on the V-band images of Field 2,
allowed me to identify globular cluster candidates
with ![]() as small as 1.7 pc, corresponding to observed FWHM of 2.4
pix (see f2.GC-6 in Table 4),
purely on the basis of their non-stellar
appearance through the following procedure within IRAF: (i) first the
daofind algorithm was run in order
to detect all the stars and clusters in the image; (ii) photometry
through a 3 pixels aperture was performed on all the objects; (iii)
relatively bright, isolated, stellar objects were used to create the PSF,
which was then fitted to all the objects, subtracted and the residual images
created. DAOPHOT II (Stetson 1987)
permits creation of the variable PSF,
which was necessary for the
U-band images that showed fixed pattern residuals upon subtraction of the
non-variable PSF. In order to create a variable PSF I used 35 stars per
image.
as small as 1.7 pc, corresponding to observed FWHM of 2.4
pix (see f2.GC-6 in Table 4),
purely on the basis of their non-stellar
appearance through the following procedure within IRAF: (i) first the
daofind algorithm was run in order
to detect all the stars and clusters in the image; (ii) photometry
through a 3 pixels aperture was performed on all the objects; (iii)
relatively bright, isolated, stellar objects were used to create the PSF,
which was then fitted to all the objects, subtracted and the residual images
created. DAOPHOT II (Stetson 1987)
permits creation of the variable PSF,
which was necessary for the
U-band images that showed fixed pattern residuals upon subtraction of the
non-variable PSF. In order to create a variable PSF I used 35 stars per
image.
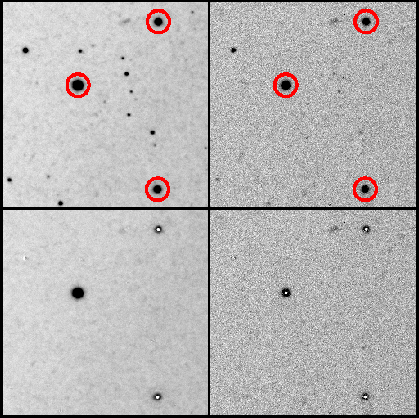
Because of their slightly larger FWHM and non-stellar PSF, globular clusters were easily detected on residual images created by subtracting the objects fitted with a stellar PSF. This subtraction was performed using the allstar task. Globular cluster residuals were oversubtracted in the center and undersubtracted in the wings (Fig. 1). Images were visually inspected and the residuals in the U- and V-band images compared. This was necessary to discard obvious galaxies from the candidate list.
After visual inspection of the residual
images, 50 and 81 objects in Field 1 and 2, respectively, were
retained as candidates for globular clusters. Good globular cluster
candidates, the ones that have round ring-like residuals, are listed in
Table 3. Other extended objects for which the visual
distinction was not very clear, some of them being blended stars
or round galaxies, but some of which might be
globular clusters as well, are listed in Table 4.
The Sextractor programme (Bertin & Arnouts 1996)
was used to measure precise coordinates, FWHM (fU and fV columns in
Tables 3 and 4) and ellipticities (
![]() and
and
![]() columns) for these
objects.
columns) for these
objects.
I performed aperture photometry within IRAF for all the objects. Since the fields were quite crowded, stellar objects had to be removed in order to obtain more precise photometry of globular clusters. To do so, I first subtracted all the stars (this time excluding the globular cluster candidates from the aperture photometry list) from the original images using the allstar task. Aperture photometry of globular cluster candidates was then measured through circular apertures of 16, 20 and 25 pixel radii. In some cases a bright saturated star or another globular cluster candidate was found near the cluster, or the latter was located near the edge of the image and thus only a 3 pix aperture magnitude was used. The 3 pix magnitudes were later extrapolated to 25 pix magnitude values using an aperture correction calculated as a median correction for more isolated globular clusters. The error in magnitude for these clusters is larger and hard to quantify, since the aperture correction depends on the concentration and compactness of the cluster. The positions and magnitudes of globular clusters are presented in Tables 3 and 4. The clusters with magnitudes measured through a smaller aperture and later corrected are flagged with "b'' (near the bright star or another globular cluster) or "e'' (near the edge of the image).
![\begin{figure}
{
\resizebox{\hsize}{!}{\includegraphics[angle=270]{10447f2.eps}} }
\end{figure}](/articles/aa/full/2001/15/aa10447/img35.gif) |
Figure 2: Photometric calibration of Landolt (1992) stars during the nights of observations in U and V filters. Left panels: the scatter for the calibration without the color term; right panels: the scatter for the calibration with the color term |
![\begin{figure}
{
\resizebox{\hsize}{!}{\includegraphics[angle=270]{10447f3.eps}} }
\end{figure}](/articles/aa/full/2001/15/aa10447/img36.gif) |
Figure 3:
Photometric calibration of
Persson et al. (1998) stars
in |
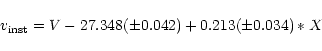
For the photometric calibration of the VLT images, a
total of 14 stars in 4 different Landolt
(1992)
fields, spanning the color range
-1.321<(U-V)< 4.162,
were observed during the two nights.
The following transformations were
calculated:
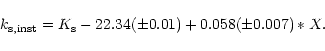
SOFI images were calibrated using 6 standards from the
Persson et al.
(1998) list observed during the night and spanning
an airmass range from 1.1 to 3.4. Each standard star
was observed at 5 different positions on the IR-array. In this way, a total of
30 independent measurements was obtained.
The least square fit (Fig. 3) yielded the following
calibration equation:
I made completeness tests for detection of stars on the U- and V-band
images. Using the IRAF task addstar within the DAOPHOT package I
added 400 stars each time to each of the U- and V-band images, all with the
same magnitude and uniformly distributed over the whole field, and
re-computed the photometry. The completeness and the accuracy of
photometry were measured at 0.5 mag bins.
The 90% completeness for stellar sources
is reached at magnitude 25 in the
V-band and 23.5 in U-band. The completeness drops to 50% at
![]() and
and ![]() .
More detailed results of completeness tests
will be presented in the forthcoming paper where the stellar photometry
of NGC 5128 is analyzed (Rejkuba et al. 2001b).
.
More detailed results of completeness tests
will be presented in the forthcoming paper where the stellar photometry
of NGC 5128 is analyzed (Rejkuba et al. 2001b).
Globular clusters have larger PSFs than stars, their selection is based mainly on the recognition of a "globular-like'' residual on a subtracted image and thus their identification as such is more subjective. In order to check the completeness level of globular cluster detections, I made similar simulations as for the stars. The fainter globular clusters, that are of interest in simulation, are not resolved and thus I just treat them as stars. To add a correct, typical globular cluster PSF, the best cluster candidates' PSFs were used to create simulated images. In order to investigate the dependence of detection on core radius, simulations with different typical PSFs were made. Two sets of simulations were done using the PSFs of clusters with small core radii, f1.GC-17 and f2.GC-4, to add objects, while in the other two sets much less concentrated clusters f1.GC-10 and f2.GC-36 were used. At each pass 100 clusters were added, distributed uniformly, all with the same magnitude. The completeness of the globular cluster detection was measured for each half magnitude.
The detection depends quite significantly on core radius in the sense
that more small ![]() clusters are lost at the faint end.
The incompleteness magnitude is defined as magnitude where more than 50%
of the added clusters are not detected as such (they are actually all
detected, but their residuals are not recognized as globular cluster-like,
because they are lost in noise). It begins in at
clusters are lost at the faint end.
The incompleteness magnitude is defined as magnitude where more than 50%
of the added clusters are not detected as such (they are actually all
detected, but their residuals are not recognized as globular cluster-like,
because they are lost in noise). It begins in at ![]() mag for clusters
like f1.GC-17 and f2.GC-4, but most of the larger clusters, like f1.GC-10
and f2.GC-36, can still be detected at the 90% level at magnitude V=23. The
incompleteness for clusters with large
mag for clusters
like f1.GC-17 and f2.GC-4, but most of the larger clusters, like f1.GC-10
and f2.GC-36, can still be detected at the 90% level at magnitude V=23. The
incompleteness for clusters with large ![]() begins in at magnitude V=23.5. In
the simulations, clusters could be detected with magnitudes as faint as V=24.
However, at those magnitude limits it is almost impossible to distinguish
globular cluster residuals from galaxies.
begins in at magnitude V=23.5. In
the simulations, clusters could be detected with magnitudes as faint as V=24.
However, at those magnitude limits it is almost impossible to distinguish
globular cluster residuals from galaxies.
From the simulations I conclude that
clusters fainter than ![]() mag would probably
not be detected. MW clusters
corresponding to these magnitudes are Pal 1,
Pal 13, Terzan 1, E 3 and AM 4.
However, at magnitude V=22.0 (
mag would probably
not be detected. MW clusters
corresponding to these magnitudes are Pal 1,
Pal 13, Terzan 1, E 3 and AM 4.
However, at magnitude V=22.0 (![]() 2 magnitudes past the GCLF peak)
more than 90% of the clusters are detected.
2 magnitudes past the GCLF peak)
more than 90% of the clusters are detected.
| ID1 | ID2 |
|
|
|
|
(U-V) |
| f1.GC-13 | C36 | 19.04 | 18.24 | 18.27 | 18.39 | 0.91 |
| f1.GC-16 | C37 | 19.24 | 18.17 | 18.46 | 18.47 | 1.33 |
| f1.GC-23 | C38 | 19.00 | |
|
18.40 | 1.16 |
| f2.GC-26 | C15 | 19.76 | 18.62 | |
18.58 | 1.40 |
| f2.GC-81 | C12 | 18.82 | 17.74 | 17.79 | 18.01 | 1.47 |
The most recent studies of the GCS in NGC 5128 (Holland et al.
1999; Alonso & Minniti 1997) have investigated the central
regions of the galaxy away from the fields studied here.
The only photometry of globular
clusters found in common with the data presented here
is the photographic plate
measurements of five clusters in
Hesser et al. (1986, 1984)
and the Washington photometry of
the three of these 5 clusters in
Harris et al. (1992). The clusters in common are C36, C37,
C38, C12 and C15 (numbering from Hesser et al. 1984,
1986). While in the
Hesser et al. papers only the
![]() magnitude is
given, Harris et al. (1992) report also photographic
V-band magnitudes
as well as Washington photometry for C12, C36 and C37. In order to compare
the Washington photometry with Bessell V magnitudes, I used the
transformation equation (Harris et al. 1992):
V = T1 +
0.66 (M-T1).
magnitude is
given, Harris et al. (1992) report also photographic
V-band magnitudes
as well as Washington photometry for C12, C36 and C37. In order to compare
the Washington photometry with Bessell V magnitudes, I used the
transformation equation (Harris et al. 1992):
V = T1 +
0.66 (M-T1).
The clusters in common are among the brightest ones and in this study
their magnitudes were
measured on 2.2 m+WFI images. The comparison between the data from the
literature and my measurements is given in Table 2. In
Cols. 1 and 2 the identification of the objects in common is given,
![]() magnitudes are from Hesser et al. (1984,
1986),
magnitudes are from Hesser et al. (1984,
1986),
![]() and
and
![]() are photographic magnitudes and the
V-band brightness derived from Washington photometry. The last two
columns present my measurements.
There is a good agreement between the V-band magnitude derived from the
Washington photometry and my measurements. The largest difference is for
cluster C12 (f2.GC-81), which I measured 0.2 magnitudes fainter,
probably due to the vicinity of a bad column on the WFI chip.
are photographic magnitudes and the
V-band brightness derived from Washington photometry. The last two
columns present my measurements.
There is a good agreement between the V-band magnitude derived from the
Washington photometry and my measurements. The largest difference is for
cluster C12 (f2.GC-81), which I measured 0.2 magnitudes fainter,
probably due to the vicinity of a bad column on the WFI chip.
| name | alpha | delta | V | U |
|
fV | fU |
|
|
R | c | |||
| (2000) | (2000) | mag | mag | mag | mag | mag | mag | pix | pix | kpc | ||||
| f1.GC-1 | 13:26:26.32 | -42:48:55.8 | 19.58 | 0.00 | 20.49 | 0.04 | |
|
8.70 | 7.40 | 0.21 | 0.24 | 17.07 | |
| f1.GC-2 | 13:26:29.01 | -42:49:44.7 | 20.77 | 0.03 | 23.26 | 0.30 | |
|
4.11 | 4.34 | 0.05 | 0.3 | 16.79 | |
| f1.GC-3 | 13:26:26.99 | -42:49:50.4 | 22.41 | 0.04 | 24.5: | 0.4 | |
|
5.17 | |
0.11 | |
16.45 | u |
| f1.GC-4 | 13:26:28.13 | -42:51:29.5 | 21.02 | 0.03 | 24.17 | 0.31 | |
|
4.09 | 3.49: | 0.04 | 0.4: | 15.41 | u, n |
| f1.GC-5 | 13:26:33.52 | -42:51:00.6 | 19.52 | 0.05 | 21.11 | 0.03 | |
|
3.32 | 3.46 | 0.05 | 0.04 | 16.53 | b |
| f1.GC-6 | 13:26:40.76 | -42:50:18.2 | 21.10 | 0.10 | 24.1: | 0.4 | |
|
4.23 | |
0.11 | |
18.07 | u, b, n |
| f1.GC-7 | 13:26:21.10 | -42:48:41.4 | 19.59 | 0.00 | 21.32 | 0.04 | |
|
4.61 | 4.77 | 0.06 | 0.09 | 16.62 | |
| f1.GC-8 | 13:26:19.88 | -42:49:11.5 | 20.27 | 0.10 | 19.44 | 0.05 | |
|
3.80 | 3.84 | 0.15 | 0.27 | 16.06 | b, n |
| f1.GC-9 | 13:26:21.36 | -42:49:59.6 | 20.79 | 0.01 | 21.69 | 0.05 | |
|
3.45 | 3.63 | 0.07 | 0.09 | 15.60 | |
| f1.GC-10 | 13:26:14.80 | -42:50:09.1 | 20.80 | 0.01 | 21.74 | 0.09 | |
|
5.07 | 5.33 | 0.23 | 0.32 | 14.67 | |
| f1.GC-11 | 13:26:09.76 | -42:50:29.9 | 20.30 | 0.09 | 21.47 | 0.07 | |
|
4.33 | 4.66 | 0.03 | 0.20 | 13.80 | b |
| f1.GC-12 | 13:26:08.77 | -42:51:28.5 | 19.70 | 0.05 | 21.15 | 0.07 | |
|
4.30 | 4.86 | 0.16 | 0.14 | 12.87 | |
| f1.GC-13 | 13:26:07.80 | -42:52:00.3 | 18.39 | 0.10 | 19.30 | 0.01 | |
|
|
3.45 | |
0.19 | 12.31 | v |
| f1.GC-14 | 13:26:09.45 | -42:53:17.4 | 19.93 | 0.05 | 20.85 | 0.02 | |
|
4.01 | 4.22 | 0.05 | 0.21 | 11.52 | b |
| f1.GC-15 | 13:26:08.96 | -42:53:42.4 | 19.44 | 0.01 | 20.93 | 0.06 | |
|
4.49 | 5.32 | 0.09 | 0.08 | 11.14 | |
| f1.GC-16 | 13:26:10.65 | -42:53:42.4 | 18.47 | 0.10 | 19.80 | 0.02 | |
|
|
3.58 | |
0.19 | 11.37 | v |
| f1.GC-17 | 13:26:22.03 | -42:53:45.0 | 19.58 | 0.01 | 20.36 | 0.03 | |
|
3.42 | 3.49 | 0.08 | 0.15 | 13.02 | |
| f1.GC-18 | 13:26:22.04 | -42:54:25.9 | 19.67 | 0.01 | 20.45 | 0.04 | |
|
3.44 | 3.58 | 0.07 | 0.15 | 12.61 | |
| f1.GC-19 | 13:26:05.27 | -42:54:58.1 | 18.75 | 0.10 | 19.52 | 0.01 | |
|
|
3.29 | |
0.12 | 9.72 | v |
| f1.GC-20 | 13:26:05.45 | -42:55:22.4 | 21.51 | 0.05 | 23.33 | 0.10 | |
|
5.52 | 4.29: | 0.06 | 0.5: | 9.47 | u, e |
| f1.GC-21 | 13:26:10.60 | -42:55:00.0 | 21.65 | 0.03 | 23.72 | 0.28 | |
|
4.16 | 3.89: | 0.07 | 0.4: | 10.48 | u |
| f1.GC-22 | 13:26:15.95 | -42:55:00.5 | 18.09 | 0.10 | 18.95 | 0.01 | |
|
|
3.34 | |
0.17 | 11.30 | v |
| f1.GC-23 | 13:26:23.81 | -42:54:00.5 | 18.40 | 0.10 | 19.56 | 0.01 | |
|
|
3.32 | |
0.17 | 13.14 | v |
| f1.GC-24 | 13:26:28.87 | -42:52:35.9 | 19.33 | 0.00 | 20.17 | 0.02 | |
|
3.73 | 3.84 | 0.12 | 0.11 | 14.8 | |
| f1.GC-34 | 13:26:09.76 | -42:53:16.8 | 21.27 | 0.10 | 23.22 | 0.30 | |
|
4.45 | 5.63 | 0.09 | 0.32 | 11.57 | b |
| f1.GC-38 | 13:26:20.06 | -42:55:22.8 | 21.84 | 0.10 | 23.54 | 0.30 | |
|
5.29 | 4.49: | 0.13 | 0.46: | 11.75 | u, e |
| f2.GC-1 | 13:25:42.07 | -43:12:44.2 | 23.10 | 0.07 | 24.9: | 0.4 | |
|
3.79 | |
0.03 | |
12.43 | u |
| f2.GC-2 | 13:25:41.92 | -43:10:40.7 | 19.52 | 0.10 | 20.40 | 0.03 | |
|
|
3.61 | |
0.14 | 10.33 | v |
| f2.GC-3 | 13:25:40.82 | -43:08:15.1 | 20.10 | 0.10 | 20.62 | 0.03 | |
|
|
3.56 | |
0.13 | 7.84 | v |
| f2.GC-4 | 13:25:40.46 | -43:07:16.9 | 19.77 | 0.01 | 21.13 | 0.06 | |
|
2.81 | 3.59 | 0.05 | 0.08 | 6.87 | |
| f2.GC-7 | 13:25:39.04 | -43:12:56.7 | 22.41 | 0.05 | 25.8: | 0.4 | |
|
3.45 | |
0.13 | |
12.53 | u, n |
| f2.GC-8 | 13:25:38.97 | -43:10:40.9 | 21.55 | 0.02 | 23.27 | 0.14 | |
|
3.62 | 5.95 | 0.07 | 0.08 | 10.20 | |
| f2.GC-9 | 13:25:38.10 | -43:13:01.2 | 20.59 | 0.01 | 21.66 | 0.07 | |
|
3.07 | 4.00 | 0.06 | 0.13 | 12.57 | |
| f2.GC-10 | 13:25:37.58 | -43:12:32.3 | 23.16 | 0.10 | 23.90 | 0.20 | |
|
3.15 | 3.68 | 0.15 | 0.38 | 12.06 | u |
| f2.GC-11 | 13:25:36.65 | -43:12:49.9 | 22.30 | 0.04 | 26.0: | 0.4 | |
|
3.49 | |
0.05 | |
12.34 | u, n |
| f2.GC-13 | 13:25:35.84 | -43:07:27.2 | 20.96 | 0.02 | 22.60 | 0.10 | |
|
2.66 | 3.32 | 0.07 | 0.13 | 6.77 | |
| f2.GC-14 | 13:25:35.82 | -43:07:15.3 | 22.08 | 0.02 | 22.70 | 0.10 | |
|
2.85 | 4.17 | 0.06 | 0.16 | 6.57 | |
| f2.GC-15 | 13:25:35.55 | -43:08:36.1 | 20.83 | 0.01 | 21.99 | 0.07 | 18.29 | 0.10 | 2.88 | 3.72 | 0.06 | 0.05 | 7.94 | |
| f2.GC-17 | 13:25:34.01 | -43:10:44.6 | 20.48 | 0.10 | 21.43 | 0.05 | 17.60 | 0.10 | 2.73 | 3.50 | 0.08 | 0.05 | 10.10 | b |
| f2.GC-18 | 13:25:33.58 | -43:07:18.5 | 21.44 | 0.04 | 22.41 | 0.09 | 17.96 | 0.19 | 2.85 | 4.02 | 0.05 | 0.12 | 6.54 | |
| f2.GC-20 | 13:25:33.07 | -43:07:00.6 | 21.26 | 0.04 | 22.84 | 0.04 | 17.68 | 0.09 | 3.18 | 4.62 | 0.07 | 0.18 | 6.21 | b |
| f2.GC-21 | 13:25:33.03 | -43:09:20.8 | 20.84 | 0.01 | 21.54 | 0.05 | 18.18 | 0.11 | 2.86 | 3.70 | 0.04 | 0.09 | 8.63 | |
| f2.GC-22 | 13:25:32.76 | -43:11:51.1 | 21.13 | 0.04 | 25.4: | 0.5 | |
|
3.26 | |
0.05 | |
11.23 | u, n |
| f2.GC-23 | 13:25:32.71 | -43:07:01.6 | 18.80 | 0.10 | 20.03 | 0.02 | 15.60 | 0.03 | |
3.50 | |
0.16 | 6.22 | v, b |
| f2.GC-24 | 13:25:32.25 | -43:07:16.5 | 20.12 | 0.01 | 20.95 | 0.04 | 17.71 | 0.08 | 2.83 | 3.56 | 0.05 | 0.08 | 6.46 | |
| f2.GC-26 | 13:25:30.35 | -43:11:48.4 | 18.58 | 0.10 | 19.98 | 0.02 | |
|
|
3.88 | |
0.19 | 11.15 | v |
| f2.GC-28 | 13:25:30.10 | -43:06:54.0 | 21.49 | 0.03 | 22.56 | 0.16 | 17.05 | 0.08 | 3.49 | 4.35 | 0.13 | 0.08 | 6.02 | |
| f2.GC-29 | 13:25:29.68 | -43:11:41.7 | 19.76 | 0.10 | 20.62 | 0.04 | |
|
|
3.61 | |
0.15 | 11.03 | v |
| f2.GC-31 | 13:25:29.38 | -43:07:41.1 | 20.66 | 0.02 | 21.47 | 0.08 | 18.24 | 0.12 | 2.97 | 3.74 | 0.09 | 0.13 | 6.84 | |
| f2.GC-34 | 13:25:28.06 | -43:06:46.3 | 22.40 | 0.09 | 23.12 | 0.17 | |
|
3.17 | 3.68 | 0.02 | 0.15 | 5.87 | |
| f2.GC-35 | 13:25:26.75 | -43:09:39.7 | 19.54 | 0.00 | 20.44 | 0.03 | 17.00 | 0.05 | 3.40 | 4.01 | 0.10 | 0.12 | 8.90 | |
| f2.GC-36 | 13:25:26.68 | -43:08:52.7 | 19.72 | 0.01 | 20.57 | 0.03 | 17.12 | 0.06 | 4.50 | 5.13 | 0.09 | 0.08 | 8.08 | |
| f2.GC-40 | 13:25:24.32 | -43:07:58.5 | 19.59 | 0.10 | 20.58 | 0.04 | 16.72 | 0.04 | |
3.75 | |
0.16 | 7.15 | v |
| f2.GC-41 | 13:25:22.61 | -43:07:37.6 | 21.43 | 0.04 | 23.29 | 0.19 | 17.65 | 0.09 | 3.85 | 5.36 | 0.08 | 0.16 | 6.83 | |
| f2.GC-43 | 13:25:21.26 | -43:10:03.0 | 21.41 | 0.02 | 21.78 | 0.10 | 17.62 | 0.12 | 4.91 | 5.48 | 0.12 | 0.13 | 9.38 | |
| f2.GC-46 | 13:25:20.63 | -43:06:35.6 | 20.27 | 0.20 | 21.50 | 0.20 | |
|
3.11 | 3.73 | 0.07 | 0.07 | 5.83 | e |
| f2.GC-47 | 13:25:19.90 | -43:07:43.5 | 20.22 | 0.01 | 21.78 | 0.05 | 16.75 | 0.04 | 3.25 | 4.04 | 0.05 | 0.15 | 7.02 |
| name | alpha | delta | V | U |
|
fV | fU |
|
|
R | c | |||
| (2000) | (2000) | mag | mag | mag | mag | mag | mag | pix | pix | kpc | ||||
| f2.GC-48 | 13:25:19.42 | -43:11:51.0 | 21.09 | 0.02 | 21.63 | 0.09 | |
|
3.99 | 4.89 | 0.21 | 0.13 | 11.29 | |
| f2.GC-49 | 13:25:18.79 | -43:07:11.1 | 22.21 | 0.23 | 23.59 | 0.15 | 18.88 | 0.28 | 5.07 | |
0.16 | |
6,52 | b, u |
| f2.GC-50 | 13:25:18.79 | -43:10:53.7 | 22.61 | 0.08 | 24.4: | 0.3 | 18.39 | 0.11 | 3.31 | |
0.06 | |
10.32 | u |
| f2.GC-52 | 13:25:17.84 | -43:13:21.4 | 21.94 | 0.12 | 22.44 | 0.08 | |
|
4.45 | 6.57 | 0.19 | 0.31 | 12.90 | |
| f2.GC-53 | 13:25:17.28 | -43:08:38.6 | 19.87 | 0.10 | 20.69 | 0.03 | 16.61 | 0.08 | 3.11 | 3.50 | 0.07 | 0.12 | 8.07 | b |
| f2.GC-54 | 13:25:16.91 | -43:09:27.4 | 19.48 | 0.10 | 20.41 | 0.03 | 16.55 | 0.05 | |
3.67 | |
0.10 | 8.91 | v |
| f2.GC-57 | 13:25:15.19 | -43:08:38.8 | 20.86 | 0.02 | 22.10 | 0.05 | 17.58 | 0.08 | 2.86 | 3.72 | 0.07 | 0.14 | 8.18 | |
| f2.GC-59 | 13:25:13.82 | -43:07:32.3 | 20.61 | 0.02 | 22.04 | 0.11 | 17.43 | 0.07 | 3.09 | 4.01 | 0.05 | 0.08 | 7.17 | b |
| f2.GC-60 | 13:25:12.90 | -43:06:39.2 | 20.50 | 0.05 | 23.52 | 0.16 | |
|
2.51 | 4.30 | 0.04 | 0.01 | 6.39 | n |
| f2.GC-61 | 13:25:12.85 | -43:07:58.9 | 18.23 | 0.10 | 19.64 | 0.01 | 15.12 | 0.02 | |
3.46 | |
0.14 | 7.67 | v |
| f2.GC-63 | 13:25:12.76 | -43:10:42.7 | 20.75 | 0.02 | 22.39 | 0.19 | 17.77 | 0.08 | 4.45 | 5.95 | 0.09 | 0.19 | 10.38 | |
| f2.GC-65 | 13:25:10.39 | -43:08:11.1 | 22.74 | 0.09 | 23.73 | 0.25 | |
|
3.00 | 5.23: | 0.07 | 0.43: | 8.04 | u |
| f2.GC-66 | 13:25:10.11 | -43:06:41.7 | 21.05 | 0.02 | 23.43 | 0.15 | |
|
2.50 | 4.79: | 0.01 | 0.20 | 6.68 | |
| f2.GC-69 | 13:25:09.07 | -43:10:01.4 | 19.87 | 0.01 | 21.23 | 0.04 | |
|
2.78 | 3.64 | 0.10 | 0.07 | 9.92 | |
| f2.GC-70 | 13:25:08.92 | -43:08:53.3 | 20.30 | 0.01 | 21.33 | 0.05 | |
|
3.67 | 4.51 | 0.06 | 0.06 | 8.83 | |
| f2.GC-71 | 13:25:08.78 | -43:09:09.1 | 19.42 | 0.10 | 20.43 | 0.03 | |
|
|
3.88 | |
0.12 | 9.09 | v |
| f2.GC-74 | 13:25:07.48 | -43:12:28.6 | 20.43 | 0.01 | 21.40 | 0.07 | |
|
2.89 | 4.18 | 0.12 | 0.19 | 12.44 | |
| f2.GC-75 | 13:25:07.41 | -43:07:34.8 | 21.83 | 0.04 | 23.36 | 0.17 | |
|
4.10 | 5.80 | 0.13 | 0.40 | 7.74 | u |
| f2.GC-76 | 13:25:07.31 | -43:08:29.3 | 20.67 | 0.01 | 21.80 | 0.07 | |
|
3.78 | 4.28 | 0.02 | 0.15 | 8.58 | |
| f2.GC-79 | 13:25:05.88 | -43:12:02.2 | 22.70 | 0.07 | 23.97 | 0.37 | |
|
3.19 | 5.25: | 0.11 | 0.46: | 12.11 | u |
| f2.GC-81 | 13:25:05.70 | -43:10:30.2 | 18.01 | 0.20 | 19.48 | 0.01 | |
|
|
3.83 | |
0.11 | 10.63 | v |
| comment: | b | = | near bright (saturated) star. |
| e | = | near edge of the field. | |
| u | = | marginal or no detection. | |
| v | = | object saturated in V; V mag from WFI data. | |
| n | = | object does not satisfy all the criteria for globular cluster classification. |
| name | alpha | delta | V | U |
|
fV | fU |
|
|
R | c | |||
| (2000) | (2000) | mag | mag | mag | mag | mag | mag | pix | pix | kpc | ||||
| f1.GC-25 | 13:26:28.27 | -42:50:03.9 | 20.43 | 0.10 | 19.68 | 0.10 | |
|
4.65 | 4.42 | 0.29 | 0.32 | 16.45 | |
| f1.GC-26 | 13:26:25.48 | -42:51:07.5 | 21.15 | 0.11 | 21.23 | 0.04 | |
|
7.63 | 9.06 | 0.39 | 0.33 | 15.3 | |
| f1.GC-27 | 13:26:30.45 | -42:52:10.8 | 18.33 | 0.10 | 19.19 | 0.01 | |
|
|
3.62 | |
0.31 | 15.3 | v |
| f1.GC-28 | 13:26:14.46 | -42:49:34.1 | 20.20 | 0.05 | 24.13 | 0.30 | |
|
4.85 | |
0.18 | |
15.12 | u |
| f1.GC-29 | 13:26:07.23 | -42:51:38.1 | 17.09 | 0.10 | 18.92 | 0.01 | |
|
|
2.84 | |
0.11 | 12.55 | v |
| f1.GC-30 | 13:26:16.36 | -42:54:28.5 | 21.37 | 0.02 | 21.84 | 0.10 | |
|
6.05 | 7.33 | 0.38 | 0.55 | 11.69 | |
| f1.GC-31 | 13:26:17.40 | -42:54:14.5 | 19.24 | 0.10 | 19.76 | 0.02 | |
|
|
2.99 | 0.10 | |
12.00 | v |
| f1.GC-32 | 13:26:06.37 | -42:53:54.4 | 20.74 | 0.04 | 21.20 | 0.03 | |
|
2.83 | 3.26 | 0.08 | 0.23 | 10.64 | |
| f1.GC-33 | 13:26:04.74 | -42:54:00.6 | 22.90 | 0.10 | 22.91 | 0.20 | |
|
4.53 | 5.51 | 0.14 | 0.38 | 10.35 | u, e |
| f1.GC-35 | 13:26:07.81 | -42:55:05.6 | 19.95 | 0.00 | 21.19 | 0.04 | |
|
2.80 | 3.15 | 0.08 | 0.18 | 10.00 | |
| f1.GC-36 | 13:26:11.89 | -42:54:51.8 | 16.95 | 0.10 | 19.35 | 0.01 | |
|
|
3.10 | |
0.21 | 10.76 | v |
| f1.GC-37 | 13:26:14.14 | -42:54:37.6 | 20.91 | 0.02 | 21.09 | 0.04 | |
|
5.41 | 6.56 | 0.25 | 0.32 | 11.26 | |
| f1.GC-39 | 13:26:26.66 | -42:55:19.3 | 17.01 | 0.10 | 19.49 | 0.01 | |
|
|
2.93 | |
0.21 | 12.88 | v |
| f1.GC-40 | 13:26:09.63 | -42:54:26.2 | 22.32 | 0.05 | 23.22 | 0.23 | |
|
4.15 | 4.11 | 0.11 | 0.09 | 10.71 | |
| f1.GC-41 | 13:26:07.05 | -42:52:37.5 | 17.14 | 0.10 | 18.07 | 0.01 | |
|
|
2.98 | |
0.17 | 11.72 | v |
| f1.GC-42 | 13:26:05.18 | -42:52:34.0 | 16.59 | 0.10 | 17.94 | 0.00 | |
|
|
3.10 | |
0.18 | 11.55 | v |
| f1.GC-43 | 13:26:06.78 | -42:52:43.2 | 17.62 | 0.10 | 18.30 | 0.01 | |
|
|
2.97 | |
0.15 | 11.61 | v |
| f1.GC-44 | 13:26:11.93 | -42:53:02.9 | 18.65 | 0.10 | 19.25 | 0.01 | |
|
|
2.94 | |
0.14 | 12.03 | v |
| f1.GC-45 | 13:26:07.65 | -42:54:28.3 | 17.76 | 0.10 | 19.16 | 0.01 | |
|
|
3.04 | |
0.20 | 10.41 | v |
| f1.GC-46 | 13:26:07.22 | -42:54:20.7 | 17.43 | 0.10 | 18.24 | 0.00 | |
|
|
3.16 | |
0.22 | 10.43 | v |
| f1.GC-47 | 13:26:06.43 | -42:54:21.3 | 18.88 | 0.10 | 20.26 | 0.02 | |
|
|
3.10 | |
0.22 | 10.32 | v |
| f1.GC-48 | 13:26:06.19 | -42:54:30.3 | 18.54 | 0.10 | 19.25 | 0.01 | |
|
|
3.08 | |
0.20 | 10.18 | v |
| f1.GC-49 | 13:26:10.13 | -42:54:56.4 | 19.89 | 0.10 | 21.16 | 0.05 | |
|
|
3.27 | |
0.22 | 10.45 | v |
| f1.GC-50 | 13:26:14.97 | -42:55:21.4 | 17.57 | 0.10 | 18.26 | 0.15 | |
|
|
3.08 | |
0.23 | 10.94 | v |
| f2.GC-5 | 13:25:40.13 | -43:10:13.3 | 21.96 | 0.03 | 26.3: | 0.5 | |
|
4.12 | |
0.23 | |
9.78 | u |
| f2.GC-6 | 13:25:39.11 | -43:12:11.6 | 21.34 | 0.02 | 23.11 | 0.11 | |
|
2.40 | 3.78 | 0.04 | 0.14 | 11.76 | |
| f2.GC-12 | 13:25:36.39 | -43:08:02.7 | 21.47 | 0.07 | 22.35 | 0.16 | |
|
4.98 | 5.32 | 0.29 | 0.32 | 7.40 | |
| f2.GC-16 | 13:25:34.40 | -43:12:04.2 | 23.58 | 0.13 | 23.58 | 0.21 | |
|
3.95 | 5.24 | 0.16 | 0.46 | 11.49 | u |
| f2.GC-19 | 13:25:33.25 | -43:10:19.6 | 22.67 | 0.06 | 24.6: | 0.5 | 17.75 | 0.11 | 4.01 | |
0.17 | |
9.65 | u |
| f2.GC-25 | 13:25:31.09 | -43:10:27.6 | 21.13 | 0.02 | 24.34 | 0.24 | 17.00 | 0.10 | 3.54 | 4.01 | 0.10 | 0.09 | 9.75 | u |
| f2.GC-27 | 13:25:30.30 | -43:11:26.6 | 21.90 | 0.03 | 24.04 | 0.30 | |
|
4.84 | |
0.09 | |
10.77 | u |
| f2.GC-30 | 13:25:29.42 | -43:09:21.9 | 22.36 | 0.06 | 24.60 | 0.26 | 20.03 | 0.47 | 3.58 | |
0.03 | |
8.59 | u |
| f2.GC-32 | 13:25:29.00 | -43:12:50.9 | 22.44 | 0.05 | 23.67 | 0.19 | |
|
6.74 | 3.40: | 0.43 | 0.39 | 12.23 | |
| f2.GC-33 | 13:25:28.26 | -43:06:40.0 | 22.31 | 0.06 | 24.71 | 0.27 | |
|
4.26 | |
0.04 | |
5.76 | u |
| f2.GC-37 | 13:25:24.77 | -43:06:54.8 | 22.36 | 0.09 | 24.07 | 0.26 | 17.84 | 0.18 | 4.36 | |
0.17 | |
6.04 | u |
| f2.GC-38 | 13:25:24.66 | -43:11:50.6 | 21.95 | 0.03 | 23.48 | 0.38 | |
|
4.06 | 6.91: | 0.10 | 0.49 | 11.19 | u |
| f2.GC-39 | 13:25:24.61 | -43:08:15.2 | 22.97 | 0.11 | 26.1: | 0.6 | 16.90 | 0.07 | 4.16 | |
0.26 | |
7.44 | u |
| f2.GC-42 | 13:25:21.46 | -43:11:43.8 | 20.80 | 0.20 | 21.80 | 0.08 | |
|
6.46 | 7.17 | 0.42 | 0.45 | 11.12 | |
| f2.GC-44 | 13:25:21.24 | -43:06:57.0 | 20.70 | 0.01 | 24.66 | 0.32 | 16.92 | 0.08 | 2.42 | 4.31 | 0.03 | 0.21 | 6.17 | |
| f2.GC-45 | 13:25:21.03 | -43:08:31.9 | 21.83 | 0.04 | 21.98 | 0.07 | 18.14 | 0.08 | 5.72 | 5.57 | 0.29 | 0.25 | 7.81 | |
| f2.GC-51 | 13:25:18.00 | -43:06:57.6 | 22.09 | 0.05 | 23.07 | 0.11 | 17.86 | 0.10 | 4.23 | 5.19 | 0.39 | 0.31 | 6.33 | |
| f2.GC-55 | 13:25:16.76 | -43:13:13.5 | 19.38 | 0.00 | 21.16 | 0.05 | |
|
3.65 | 4.98 | 0.08 | 0.26 | 12.79 | |
| f2.GC-56 | 13:25:16.72 | -43:13:18.4 | 20.63 | 0.20 | 22.19 | 0.10 | |
|
3.98 | 5.62 | 0.26 | 0.14 | 12.88 | |
| f2.GC-58 | 13:25:14.84 | -43:11:00.3 | 22.81 | 0.09 | 22.95 | 0.16 | 18.22 | 0.10 | 4.58 | 6.75 | 0.33 | 0.41 | 10.58 | |
| f2.GC-62 | 13:25:12.81 | -43:12:00.7 | 21.51 | 0.05 | 25.8: | 0.5: | |
|
5.55 | |
0.35 | |
11.70 | u |
| f2.GC-64 | 13:25:12.17 | -43:08:48.7 | 21.31 | 0.10 | 23.43 | 0.20 | 17.30 | 0.09 | 6.31 | |
0.15 | |
8.52 | u |
| f2.GC-67 | 13:25:09.32 | -43:09:58.4 | 22.88 | 0.10 | 23.99 | 0.12 | |
|
5.15 | |
0.15 | |
9.85 | u |
| f2.GC-68 | 13:25:09.06 | -43:13:18.4 | 20.44 | 0.01 | 22.00 | 0.09 | |
|
7.25 | 8.77 | 0.46 | 0.27 | 13.19 | |
| f2.GC-72 | 13:25:08.11 | -43:10:37.4 | 21.00 | 0.03 | 21.51 | 0.07 | |
|
6.21 | 6.69 | 0.36 | 0.19 | 10.57 | |
| f2.GC-73 | 13:25:08.03 | -43:09:51.8 | 22.99 | 0.12 | 23.88 | 0.17 | |
|
5.32 | |
0.16 | |
9.84 | u |
| f2.GC-77 | 13:25:06.66 | -43:08:57.9 | 21.16 | 0.03 | 23.41 | 0.19 | |
|
5.73 | 4.25 | 0.18 | 0.29 | 9.09 | u |
| f2.GC-78 | 13:25:06.11 | -43:06:51.9 | 22.06 | 0.05 | 24.4: | 0.5 | |
|
3.39 | |
0.08 | |
7.23 | u |
| f2.GC-80 | 13:25:05.72 | -43:06:50.9 | 20.96 | 0.02 | 23.91 | 0.40 | |
|
2.52 | 4.51 | 0.08 | 0.18 | 7.26 |
| comment: | b | = | near bright (saturated) star. |
| e | = | near edge of the field. | |
| u | = | marginal or no detection. | |
| v | = | object saturated in V; V mag is from WFI data. |
Typical Galactic globular clusters
have mean King core radii
![]() pc, mean
tidal radii
pc, mean
tidal radii
![]() pc and mean ellipticities
pc and mean ellipticities
![]() (June 1999 update of the Harris 1996 catalogue;
White & Shawl 1987).
(June 1999 update of the Harris 1996 catalogue;
White & Shawl 1987).
Holland et al. (1999) used HST WFPC2 data to find globular
clusters in the central parts of NGC 5128 and measured their
structural parameters. They did not find any
significant difference between the
MW and NGC 5128 globular clusters'
King core radii (![]() ), tidal radii (
), tidal radii (![]() )
and half-mass radii (
)
and half-mass radii (![]() ). They also found no trend
in
). They also found no trend
in ![]() ,
,
![]() or
or ![]() with galactocentric distance,
contrary to what one may expect due to stronger tidal forces closer to
the galactic center.
However, they measured higher mean ellipticities for their
globular cluster candidates with respect to the MW
globular clusters. Their samples
are restricted only to the brighter clusters in NGC 5128,
corresponding to the absolute magnitude MV=-6.4. For comparison, the
present sample reaches almost 2 magnitudes deeper.
with galactocentric distance,
contrary to what one may expect due to stronger tidal forces closer to
the galactic center.
However, they measured higher mean ellipticities for their
globular cluster candidates with respect to the MW
globular clusters. Their samples
are restricted only to the brighter clusters in NGC 5128,
corresponding to the absolute magnitude MV=-6.4. For comparison, the
present sample reaches almost 2 magnitudes deeper.
I measured the FWHM and ellipticity for all the objects in Tables 3 and 4 using the Sextractor programme (Bertin & Arnouts 1996). U-band images had variable PSF across the frame and the objects were, in some places, elongated, thus showing higher ellipticity than in the V-band images.
The FWHM vs. ellipticity for all the objects in Fields 1 and 2 is plotted in Fig. 4. The upper panel shows the results obtained from the V-band, the lower panel the ones obtained from the U-band. The vertical line indicates the mean FWHM for stars. The objects from Table 4, some of which might as well be blended stars or galaxies, are plotted as open symbols, while the filled dots were used for objects from Table 3 (i.e. good candidates). Objects that were slightly saturated on the V-band VLT images are shown only in the U-band diagram (lower panel). Due to the poorer seeing conditions during the observations with the 2.2 m telescope, their profiles are more similar to the stellar profiles on the WFI images.
In order to classify an object as a globular cluster all of the following criteria were imposed:
Copyright ESO 2001
![\begin{figure}
{
\resizebox{\hsize}{!}{\includegraphics[angle=270]{10447f4.eps}} }
\end{figure}](/articles/aa/full/2001/15/aa10447/img62.gif)