S. C. Kappadath4 - M. McConnell2 - J. Ryan2 - V. Schönfelder1 - H. Steinle1
A&A 368, 347-368 (2001)
DOI: 10.1051/0004-6361:20000489
G. Weidenspointner1,![]() -
M. Varendorff1 -
U. Oberlack3
-
D. Morris2 -
S. Plüschke1
-
R. Diehl1 -
-
M. Varendorff1 -
U. Oberlack3
-
D. Morris2 -
S. Plüschke1
-
R. Diehl1 -
S. C. Kappadath4 -
M. McConnell2 -
J. Ryan2 -
V. Schönfelder1 -
H. Steinle1
1 - Max-Planck-Institut für extraterrestrische Physik,
85740 Garching, Germany
2 -
Space Science Center, University of New Hampshire, Durham,
NH 03824, USA
3 -
Astrophysics Laboratory, Columbia University, New York,
NY 10027, USA
4 -
Louisiana State University, Baton Rouge, Louisiana, USA
Received 28 July 2000 / Accepted 5 December 2000
Abstract
The instrumental line background of the Compton telescope COMPTEL
onboard the Compton Gamma-Ray Observatory is due to the activation
and/or decay of many isotopes. The major components
of this background can be attributed to eight
individual isotopes, namely 2D, 22Na, 24Na,
28Al, 40K, 52Mn, 57Ni, and 208Tl.
The identification of instrumental lines with specific isotopes
is based on the line energies as well as on the variation of the
event rate with time, cosmic-ray intensity, and deposited radiation dose
during passages through the South-Atlantic Anomaly. The
characteristic variation of the event rate due to a specific isotope
depends on its life-time, orbital parameters such as the altitude of the
satellite above Earth, and the solar cycle.
A detailed understanding of the background contributions from
instrumental lines is crucial at MeV energies for measuring the
cosmic diffuse gamma-ray background and for observing ![]() -ray line
emission in the interstellar medium or from supernovae and their
remnants. Procedures to determine the event rate from each background
isotope are described, and their average activity in spacecraft
materials over the first seven years of the mission is estimated.
-ray line
emission in the interstellar medium or from supernovae and their
remnants. Procedures to determine the event rate from each background
isotope are described, and their average activity in spacecraft
materials over the first seven years of the mission is estimated.
Key words: methods: data analysis - line: identification
Gamma-ray experiments in low-Earth orbit, such as the Compton
telescope COMPTEL onboard the Compton Gamma-Ray Observatory (CGRO),
operate in an intense and variable radiation environment. The main
constituents of the ambient radiation fields are primary cosmic-ray
particles, geomagnetically trapped radiation-belt particles, as well
as albedo neutrons and ![]() -ray photons. The different particle
species interact with the spacecraft and detector materials, resulting
in the emission of instrumental background photons (for a review, see
e.g. Dean et al. 1991). COMPTEL data, dominated by
instrumental background, have a typical signal-to-noise ratio of a few
percent. Hence, a qualitative and quantitative understanding of the
instrumental background is crucial for conducting astrophysical
measurements, in particular of the cosmic diffuse gamma-ray background
(hereafter CDG), and of the
-ray photons. The different particle
species interact with the spacecraft and detector materials, resulting
in the emission of instrumental background photons (for a review, see
e.g. Dean et al. 1991). COMPTEL data, dominated by
instrumental background, have a typical signal-to-noise ratio of a few
percent. Hence, a qualitative and quantitative understanding of the
instrumental background is crucial for conducting astrophysical
measurements, in particular of the cosmic diffuse gamma-ray background
(hereafter CDG), and of the ![]() -ray line emission in the
interstellar medium or from supernovae and their remnants.
-ray line emission in the
interstellar medium or from supernovae and their remnants.
The instrumental background experienced by COMPTEL is subdivided into
two major components according to their signature in energy space:
first, a continuum background discussed by Ryan et al. (1997); second, the instrumental line background, the
focus of this paper.
The latter arises from a number of different radioactive isotopes
generated in the instrument material. This primarily occurs from
activation by trapped protons during passages through the
South-Atlantic Anomaly (SAA), from neutron absorption, and from
primordial radioactivity![]() .
An earlier report on activation in the COMPTEL
telescope was given by Morris et al. (1997a).
.
An earlier report on activation in the COMPTEL
telescope was given by Morris et al. (1997a).
The discussion is structured as follows. After a brief description of
the COMPTEL instrument in Sect. 2, general
characteristics of the instrumental (line) background are summarized
in Sect. 3. In
Sect. 4, identifications of specific isotopes
are discussed. In Sect. 5, the variations of the
activity of individual isotopes are described. In
Sect. 6, a comparison of instrumental
line backgrounds in different low-energy ![]() -ray experiments is
given. Also, average values for the activity of spacecraft materials
are presented. The results of this work are summarized and discussed
in Sect. 7. Finally, appendices give the event
selections used in these line studies, and provide detailed
descriptions of the procedures employed for determining the background
contributions of individual isotopes in the CDG analysis, and also -
with slight modifications - in the analysis of the galactic 1.8 MeV
line emission from 26Al.
-ray experiments is
given. Also, average values for the activity of spacecraft materials
are presented. The results of this work are summarized and discussed
in Sect. 7. Finally, appendices give the event
selections used in these line studies, and provide detailed
descriptions of the procedures employed for determining the background
contributions of individual isotopes in the CDG analysis, and also -
with slight modifications - in the analysis of the galactic 1.8 MeV
line emission from 26Al.
COMPTEL is the first double-scattering Compton telescope designed for
![]() -ray astronomy to operate on a satellite platform. A detailed
description of the COMPTEL instrument, which is sensitive to
-ray astronomy to operate on a satellite platform. A detailed
description of the COMPTEL instrument, which is sensitive to
![]() -rays in the 0.8-30 MeV range, can be found in
Schönfelder et al. (1993). Briefly, the
instrument consists of two planes of detector arrays, D1 and D2,
separated by 1.58 m (see Fig. 1). The D1 detector
consists of seven cylindrical modules filled with NE 213A organic
liquid scintillator. The D2 detector consists of 14 cylindrical
NaI(Tl) crystals. The D1 scintillator material has a low average
atomic number to optimize the occurrence of a single Compton scatter,
while the D2 scintillator crystals have a high density and average
atomic number to maximize their photon absorption properties. Each
detector array is surrounded by a pair of overlapping anti-coincidence
domes, manufactured of NE 110 plastic scintillator, to reject charged
particle triggers of the telescope. The in-flight performance of the
instrument is monitored with two calibration (CAL) units, each
composed of a 60Co-doped scintillator viewed by two 1/2 inch
photomultiplier tubes (PMTs), that provide tagged photons for
in-flight energy calibration (Snelling et al. 1986). The
COMPTEL instrument accepts and registers coincident triggers in a
single D1-D2 module pair within the coincidence time window of
-rays in the 0.8-30 MeV range, can be found in
Schönfelder et al. (1993). Briefly, the
instrument consists of two planes of detector arrays, D1 and D2,
separated by 1.58 m (see Fig. 1). The D1 detector
consists of seven cylindrical modules filled with NE 213A organic
liquid scintillator. The D2 detector consists of 14 cylindrical
NaI(Tl) crystals. The D1 scintillator material has a low average
atomic number to optimize the occurrence of a single Compton scatter,
while the D2 scintillator crystals have a high density and average
atomic number to maximize their photon absorption properties. Each
detector array is surrounded by a pair of overlapping anti-coincidence
domes, manufactured of NE 110 plastic scintillator, to reject charged
particle triggers of the telescope. The in-flight performance of the
instrument is monitored with two calibration (CAL) units, each
composed of a 60Co-doped scintillator viewed by two 1/2 inch
photomultiplier tubes (PMTs), that provide tagged photons for
in-flight energy calibration (Snelling et al. 1986). The
COMPTEL instrument accepts and registers coincident triggers in a
single D1-D2 module pair within the coincidence time window of ![]() ns in the absence of a veto signal from the four charged
particle shields as valid events. These interactions can be caused by
a single photon or by multiple photons and/or particles. Among other
parameters, a time-of-flight (ToF) value and a so-called pulse shape
discriminator (PSD) value in D1 are recorded for each event. The ToF
is a measure of the time difference between the triggers in the D1 and
D2 detectors and is used to discriminate forward scattered
(D1
ns in the absence of a veto signal from the four charged
particle shields as valid events. These interactions can be caused by
a single photon or by multiple photons and/or particles. Among other
parameters, a time-of-flight (ToF) value and a so-called pulse shape
discriminator (PSD) value in D1 are recorded for each event. The ToF
is a measure of the time difference between the triggers in the D1 and
D2 detectors and is used to discriminate forward scattered
(D1
![]() D2) events, such as celestial photons with a ToF value
of about 5 ns, from backward scattered (D2
D2) events, such as celestial photons with a ToF value
of about 5 ns, from backward scattered (D2
![]() D1) background
events which cluster around a ToF value of about -5 ns. The PSD is
a measure of the shape of the scintillation light pulse in the D1
detector. The energy loss characteristics of recoil electrons
resulting from Compton scattering and of recoil protons resulting from
neutron scattering are different, allowing one to reject many neutron
induced events. The summed energy deposits in the two detectors,
E1 + E2, are a measure of the
total energy of the incident photon,
D1) background
events which cluster around a ToF value of about -5 ns. The PSD is
a measure of the shape of the scintillation light pulse in the D1
detector. The energy loss characteristics of recoil electrons
resulting from Compton scattering and of recoil protons resulting from
neutron scattering are different, allowing one to reject many neutron
induced events. The summed energy deposits in the two detectors,
E1 + E2, are a measure of the
total energy of the incident photon,
![]() ,
while the
photon scatter angle
,
while the
photon scatter angle
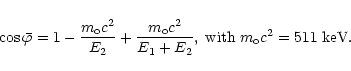
![]() is determined from E1and E2 through the Compton-scatter formula:
is determined from E1and E2 through the Compton-scatter formula:
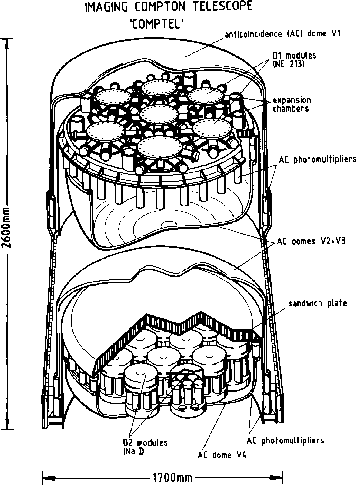 |
Figure 1: A schematic view of the Compton telescope COMPTEL (from Schönfelder et al. 1993) |
| Open with DEXTER | |
The particle and photon environment of COMPTEL produces coincident
interactions in the D1 and D2 detectors that pass all the logic and
electronic criteria for a valid event.
In the following, an overview is given of different types of
instrumental background events in terms of their interaction process
and location, as illustrated in Fig. 2. This
classification of background events (van Dijk 1996)
provides a simple and versatile framework for discussing the COMPTEL
instrumental background.
ToF is of prime importance in identifying and rejecting instrumental
background events. A schematic representation of the ToF distribution
of valid events is depicted in Fig. 3.
| |
Figure 2: An illustration of the main channels for the triggering of valid events due to instrumental background (adopted from van Dijk 1996). For simplicity, BATSE was omitted in this schematic view of CGRO. The various event types are explained in the text |
| Open with DEXTER | |
![]() Event types A and B: events caused by the
double scattering of a single photon. Any photon created in CGRO may
produce this type of background event, which, if the scattering is
from D1 to D2, is identical to a proper celestial event. It follows
that the ToF distribution of forward scattered single photon events is
identical to that of celestial photons and peaks around 5 ns in the
ToF forward peak. Depending on where they originate, forward
scattered single photon events may be rejected. In particular, many of
the photons that originate from below the D1 detector (such as type
B events) can be eliminated by a selection on the scatter angle
Event types A and B: events caused by the
double scattering of a single photon. Any photon created in CGRO may
produce this type of background event, which, if the scattering is
from D1 to D2, is identical to a proper celestial event. It follows
that the ToF distribution of forward scattered single photon events is
identical to that of celestial photons and peaks around 5 ns in the
ToF forward peak. Depending on where they originate, forward
scattered single photon events may be rejected. In particular, many of
the photons that originate from below the D1 detector (such as type
B events) can be eliminated by a selection on the scatter angle
![]() (see e.g. the event selections in
Appendix A). The remaining instrumental background
from forward scattered single photons is therefore mostly due to
photons originating in, around and above the D1 detector (such as type
A events); type B events are negligible. Line emissions
appear in energy space, particularly in
(see e.g. the event selections in
Appendix A). The remaining instrumental background
from forward scattered single photons is therefore mostly due to
photons originating in, around and above the D1 detector (such as type
A events); type B events are negligible. Line emissions
appear in energy space, particularly in
![]() and
E1-E2 space (see below).
and
E1-E2 space (see below).
Single photons may also scatter in D2 before interacting in D1. These
backward scattered single photon events, however, are identifiable by
their ToF distribution, which is confined in the backward peak at ToF
values of about - 5 ns. Finally, high-energy neutrons can undergo a
double scattering process analogously to photons, however, many of
these neutron events can be rejected by their PSD value.
![\begin{figure}
\par\includegraphics[width=8.8cm,clip]{H2362F3.eps}\end{figure}](/articles/aa/full/2001/10/aah2362/img15.gif) |
Figure 3:
A schematic representation of the ToF distribution of valid
events. Three major components can be discerned: the ToF backward peak
and forward peak, centered at ToF values of about -5 ns and +5 ns,
respectively, and an underlying continuum distribution. The backward
peak is composed of all types of background events originating in and
around the D2 detector (these are not specified individually in this
illustration). The ToF forward peak contains the celestial signal as
well as background events originating in and around the D1 detector,
mostly of types A and C. The ToF continuum is dominated by
background events of types D, E, and F originating
in the instrument structure between the two detectors and the
spacecraft structure in general. The relative magnitudes of the
different components, which depend on
|
| Open with DEXTER | |
![]() Event types C and D: events caused by two
or more photons both spatially and temporally correlated (so-called
multiple photon or cascade events). In general, multiple photon
events are more efficient in generating a background event than single
photon events, since the probability for coincident interactions in
both detectors increases with the number of emitted photons. Emission
of two or more photons can occur from a small region on a time-scale
shorter than the coincidence window of 40 ns. Nucleons that have been
excited above the first nuclear level, e.g. by proton or neutron
interactions, may promptly emit a cascade of photons. The multitude of
nuclear excitation levels often results in a rather featureless
continuum distribution in energy space. If, however, only a few
transition levels are involved, characteristic features appear in
E2 and
E1-E2 space (see
below). Multiple photons may also arise from
Event types C and D: events caused by two
or more photons both spatially and temporally correlated (so-called
multiple photon or cascade events). In general, multiple photon
events are more efficient in generating a background event than single
photon events, since the probability for coincident interactions in
both detectors increases with the number of emitted photons. Emission
of two or more photons can occur from a small region on a time-scale
shorter than the coincidence window of 40 ns. Nucleons that have been
excited above the first nuclear level, e.g. by proton or neutron
interactions, may promptly emit a cascade of photons. The multitude of
nuclear excitation levels often results in a rather featureless
continuum distribution in energy space. If, however, only a few
transition levels are involved, characteristic features appear in
E2 and
E1-E2 space (see
below). Multiple photons may also arise from ![]() -particle
bremsstrahlung, or the annihilation of a positron. Also, high-energy
neutrons may induce the emission of one or more
-particle
bremsstrahlung, or the annihilation of a positron. Also, high-energy
neutrons may induce the emission of one or more ![]() -ray photons
outside of the D1 scintillator (thereby eluding rejection by PSD) and
some may interact in the D2 detector. More complicated nuclear
reactions such as the spallation (break-up) of a nucleus or the
initiation of a shower of secondaries by an incident cosmic-ray
particle or neutron may also produce multiple photons.
-ray photons
outside of the D1 scintillator (thereby eluding rejection by PSD) and
some may interact in the D2 detector. More complicated nuclear
reactions such as the spallation (break-up) of a nucleus or the
initiation of a shower of secondaries by an incident cosmic-ray
particle or neutron may also produce multiple photons.
Frequently, the emission of photons is nearly simultaneous, i.e. on time-scales much shorter than the coincidence window. The ToF value of these event types is determined by the location of the emitting nucleus relative to the D1 and D2 detectors. Multiple photons originating in the vicinity of the D1 detector (such as type C events) will peak slightly below a ToF value of 5 ns (see Sect. 4.2) and therefore contribute to the ToF forward peak. Photons emitted by nuclei in the spacecraft material between the D1 and D2 detectors (such as type D events) will interact in the two detectors near-simultaneously and have ToF values that are broadly distributed around zero, while photons originating in and around the D2 detector will contribute to the ToF backward peak. The full, double-peaked ToF distribution of all multiple photon events not only reflects the location of the emitting nucleus, but also the mass distribution of the entire spacecraft relative to the D1 and D2 detectors.
![]() Event type E: events that are both spatially and
temporally uncorrelated (the so-called random coincidences). The
COMPTEL detectors are continuously exposed to a large flux of
Event type E: events that are both spatially and
temporally uncorrelated (the so-called random coincidences). The
COMPTEL detectors are continuously exposed to a large flux of
![]() -ray photons. This inevitably leads to coincident interactions
that qualify as valid events. The photons producing these random
coincidences are mostly of local or atmospheric origin. Since the two
photons creating the event are unrelated to one another, and, in
particular, not correlated in time, these events are uniformly
distributed in ToF. Type E events may also involve a neutron
instead of a photon triggering the D2 detector, which has no PSD
capability.
-ray photons. This inevitably leads to coincident interactions
that qualify as valid events. The photons producing these random
coincidences are mostly of local or atmospheric origin. Since the two
photons creating the event are unrelated to one another, and, in
particular, not correlated in time, these events are uniformly
distributed in ToF. Type E events may also involve a neutron
instead of a photon triggering the D2 detector, which has no PSD
capability.
![]() Event type F: events caused by two photons that
are temporally correlated, but spatially uncorrelated. High-energy
cosmic-ray particles or atmospheric neutrons may interact at several
different locations along their path through CGRO. Individual
interactions include those generating type C and D events
(e.g. spallations or showers). The whole interaction chain creating
type F events is similar to multiple photon events, the
main difference being that their ToF distribution depends on both the
location of the interactions as well as the (relativistic) velocity of
the primary particle. The ToF distribution of this type of event is
broad and covers the entire coincidence window (also reflecting
the spacecraft mass distribution).
Event type F: events caused by two photons that
are temporally correlated, but spatially uncorrelated. High-energy
cosmic-ray particles or atmospheric neutrons may interact at several
different locations along their path through CGRO. Individual
interactions include those generating type C and D events
(e.g. spallations or showers). The whole interaction chain creating
type F events is similar to multiple photon events, the
main difference being that their ToF distribution depends on both the
location of the interactions as well as the (relativistic) velocity of
the primary particle. The ToF distribution of this type of event is
broad and covers the entire coincidence window (also reflecting
the spacecraft mass distribution).
![]() Other processes, such as the interaction of a neutron in the
D2 detector after producing a photon in the D1 system, or direct
ionization losses of
Other processes, such as the interaction of a neutron in the
D2 detector after producing a photon in the D1 system, or direct
ionization losses of ![]() -particles created in the housings of the
D1 scintillators, may also play a role. The event signatures of these
and other, more complicated processes, however, will be similar to the
event types described above.
-particles created in the housings of the
D1 scintillators, may also play a role. The event signatures of these
and other, more complicated processes, however, will be similar to the
event types described above.
Event types A - D may arise from activation by primary
cosmic-ray protons or secondary particles as well as atmospheric
neutrons. The time between the interaction of the proton or neutron
within the telescope material and the actual triggering of a
background event varies, since it depends on the decay time of the
radio-isotopes produced. These processes and the resulting background
events can be crudely separated into "prompt'' and "delayed''
components. For prompt background events the time delay between the
primary particle interaction in the instrument and the resulting
emission of background photons is shorter than the coincidence window
of 40 ns for the triggering of a valid event. Thus the intensity of
prompt background components instantaneously follows the
(time-variable) incident local cosmic-ray flux (see
Sect. 5). For delayed events the time delay is longer
than the typical length of the fast-logic veto signal of ![]() 200 ns. In contrast to protons, neutrons can travel to any location
in the spacecraft to produce
200 ns. In contrast to protons, neutrons can travel to any location
in the spacecraft to produce ![]() -ray photons without triggering
the veto system. Inside the veto domes, particularly in the D1
detector, prompt events can therefore only be produced by neutrons.
Both protons and neutrons, however, can produce delayed background
events inside as well as outside the veto domes.
-ray photons without triggering
the veto system. Inside the veto domes, particularly in the D1
detector, prompt events can therefore only be produced by neutrons.
Both protons and neutrons, however, can produce delayed background
events inside as well as outside the veto domes.
As described in Sect. 2, events due to incident celestial photons have ToF values around 5 ns. Only background events with a similar ToF value will therefore interfere with astrophysical analyses. As illustrated in Fig. 3, a major portion of the instrumental background events, including those in the backward peak, can be eliminated by a ToF selection. The most important background event types in the ToF forward peak region around ToF = 5 ns are those originating in the D1 detector (types A and C), and some of the background events produced in the satellite structure (types D, E, and F).
After ToF selection, the majority of the instrumental line
background is expected to arise from activation of the D1 detector
material because of the relatively high mass density and probability
for triggering a background event as compared to the general
spacecraft structure. The material composition of the D1 detector
system therefore provides important clues as to which radioactive
isotopes can effectively be produced and ultimately contribute to the
instrumental line background in the low-Earth orbit of CGRO. The D1
support structure and the D1 module and PMT housings are mostly
aluminium, the most abundant element in the instrument. The liquid
scintillator NE 213A is composed of hydrogen and carbon. The quartz
windows in the module housings contain silicon and oxygen. The PMTs
and electronics boxes contain, among other elements, copper, nickel,
and iron.
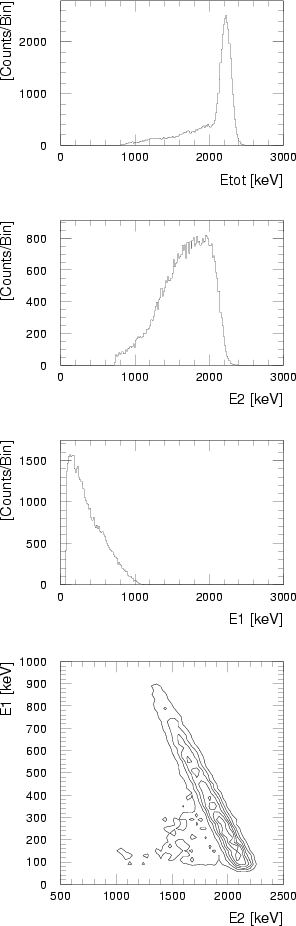 |
Figure 4:
The
|
| Open with DEXTER | |
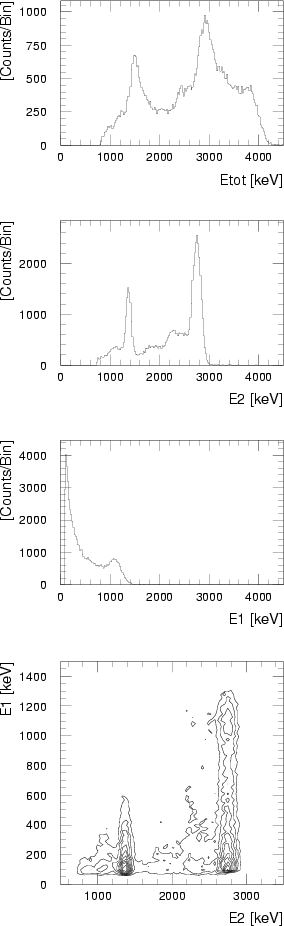 |
Figure 5:
The
|
| Open with DEXTER | |
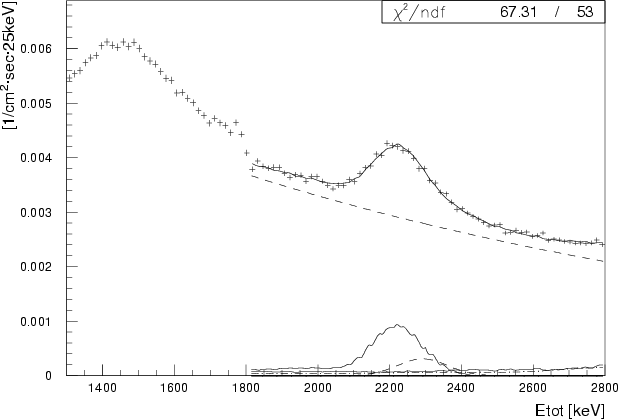
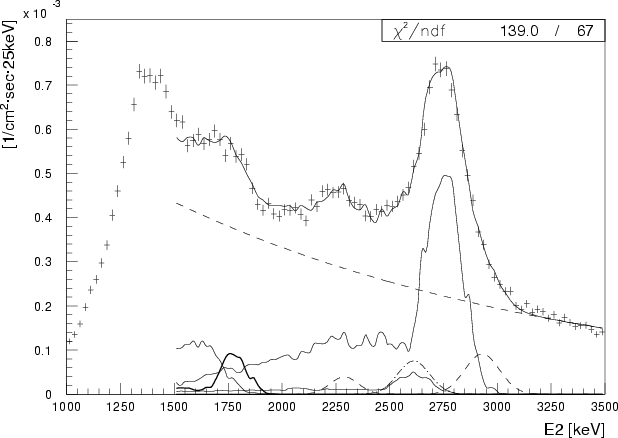
Events from the instrumental line background produce conspicuous and characteristic features in energy space that can be exploited to distinguish them from the general (continuum) background. The ToF distributions of the line background and the continuum background are also different: the instrumental line background is concentrated in the forward peak region, while the continuum background in energy is throughout the ToF continuum as well as the ToF forward peak. In the following, the characteristics of single photon (type A) events and multiple photon or cascade (type C) events are illustrated with examples of (background) events from 2D and 24Na, respectively, both major contributors to the instrumental line background (see Sect. 4).
The instrumental 2.22 MeV photons emitted when 2D is produced in
the D1 scintillators (see Sect. 4.1) are single photon (type
A) background events. The
![]() ,
E2,
E1, and
E1-E2 distributions of
instrumental 2.22 MeV photons for CDG event selections (described in
Appendix A.1) as determined from Monte Carlo
simulations are depicted in Fig. 4. The
,
E2,
E1, and
E1-E2 distributions of
instrumental 2.22 MeV photons for CDG event selections (described in
Appendix A.1) as determined from Monte Carlo
simulations are depicted in Fig. 4. The
![]() distribution exhibits a peak at the energy of the
primary photon, while the distributions in E2 and
E1 are broad and relatively featureless. In
E1-E2 space the event distribution of type
A events follows the diagonal
distribution exhibits a peak at the energy of the
primary photon, while the distributions in E2 and
E1 are broad and relatively featureless. In
E1-E2 space the event distribution of type
A events follows the diagonal
![]() ,
with
,
with
![]() MeV for 2D.
The distributions in
MeV for 2D.
The distributions in
![]() and
E1-E2 are the most important characteristics
of single photon background events.
and
E1-E2 are the most important characteristics
of single photon background events.
The ![]() -decay of 24Na results in the emission of two
photons with energies 1.37 MeV and 2.75 MeV causing type C line
background events (see Sect. 4.2). The
-decay of 24Na results in the emission of two
photons with energies 1.37 MeV and 2.75 MeV causing type C line
background events (see Sect. 4.2). The ![]() -particle is
of minor importance for the generation of a background event. Since it
rarely escapes the support structure, it contributes to the background
only through secondary bremsstrahlung photons. The 24Na
signature in
-particle is
of minor importance for the generation of a background event. Since it
rarely escapes the support structure, it contributes to the background
only through secondary bremsstrahlung photons. The 24Na
signature in
![]() ,
E2, E1, and
E1-E2 as determined from Monte Carlo
simulations is shown, for CDG event selections (see
Appendix A.1), in Fig. 5. The
most important characteristic of 24Na, and any other isotope
emitting multiple photons, is the E2 distribution, which
exhibits peaks at the energies of each of the primary photons. In
E1 the only conspicuous feature is the Compton edge of the
1.37 MeV photon (the Compton edge of the 2.75 MeV photon is suppressed
by the CDG data selections). The
,
E2, E1, and
E1-E2 as determined from Monte Carlo
simulations is shown, for CDG event selections (see
Appendix A.1), in Fig. 5. The
most important characteristic of 24Na, and any other isotope
emitting multiple photons, is the E2 distribution, which
exhibits peaks at the energies of each of the primary photons. In
E1 the only conspicuous feature is the Compton edge of the
1.37 MeV photon (the Compton edge of the 2.75 MeV photon is suppressed
by the CDG data selections). The
![]() spectrum is more
complex and exhibits less pronounced, line-like features just above
the individual photon energies. These come from the absorption of one
photon in D2 with the other photon scattering in D1 with an energy
deposit near the D1 threshold. In addition, in
spectrum is more
complex and exhibits less pronounced, line-like features just above
the individual photon energies. These come from the absorption of one
photon in D2 with the other photon scattering in D1 with an energy
deposit near the D1 threshold. In addition, in
![]() a
shoulder is present at about 3.9 MeV. This is analogous to the sum
peak in standard spectroscopy employing a single detector. Under CDG
data selections, this shoulder is due to the absorption of the
2.75 MeV photon in D2, with the 1.37 MeV photon scattering in D1 with
an energy deposit at the Compton edge. The 24Na event
distribution in
E1-E2 space is also very
characteristic: the events cluster along two bands parallel to the
E1 axis located in E2 at the energies of the
two decay photons. The band at 2.75 MeV in E2 extends in
E1 from the threshold up to the Compton edge of the
1.37 MeV photon. The band at 1.37 MeV in E2 is suppressed
by the CDG data selections.
a
shoulder is present at about 3.9 MeV. This is analogous to the sum
peak in standard spectroscopy employing a single detector. Under CDG
data selections, this shoulder is due to the absorption of the
2.75 MeV photon in D2, with the 1.37 MeV photon scattering in D1 with
an energy deposit at the Compton edge. The 24Na event
distribution in
E1-E2 space is also very
characteristic: the events cluster along two bands parallel to the
E1 axis located in E2 at the energies of the
two decay photons. The band at 2.75 MeV in E2 extends in
E1 from the threshold up to the Compton edge of the
1.37 MeV photon. The band at 1.37 MeV in E2 is suppressed
by the CDG data selections.
For other isotopes, if the energy of one of a pair of cascade photons is below the D2 threshold, then the two photons produce a cascade (type C) event only if the lower-energy photon scatters in D1, and the higher-energy photon interacts in D2. The E2 and E1-E2 distribution of such a cascade photon pair is simple: there is only one photopeak in E2 and only one band in E1-E2.
Radioactive decays that result in the (simultaneous) emission of two
or more photons can produce line background events other than of type
C.
For example, an individual photon of the emitted
photon multiple can produce a type A event, provided all other
photons escape from the instrument without interacting in any of the
detectors.
As apparent in the
E1-E2 event distribution of
24Na, however, the
![]() signatures corresponding to
the photon energies 1.37 MeV and 2.75 MeV are much weaker than the
cascade structure.
Monte Carlo simulations show that less than 10% of the
24Na background events are due to type A events.
This illustrates the fact that multiple photon decays in the D1
detector material are more efficient in generating a background event
than decays that result in the emission of a single photon only.
signatures corresponding to
the photon energies 1.37 MeV and 2.75 MeV are much weaker than the
cascade structure.
Monte Carlo simulations show that less than 10% of the
24Na background events are due to type A events.
This illustrates the fact that multiple photon decays in the D1
detector material are more efficient in generating a background event
than decays that result in the emission of a single photon only.
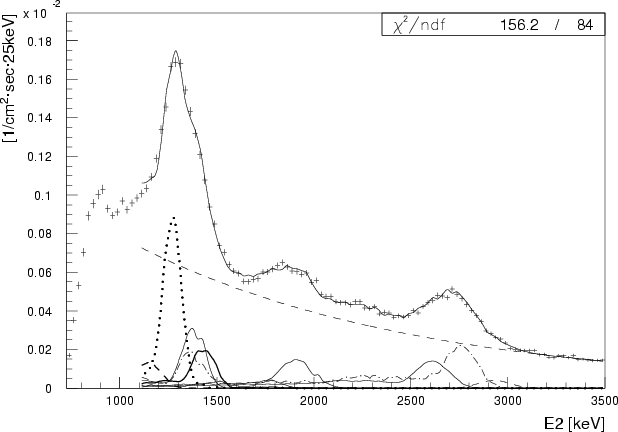
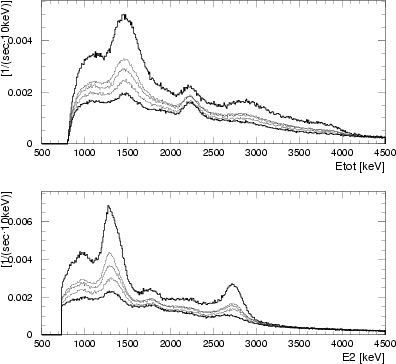 |
Figure 6:
An illustration of the spectral distributions in
|
| Open with DEXTER | |
|
The major components of the COMPTEL instrumental line background can
be attributed to eight individual isotopes, namely 2D, 22Na,
24Na, 28Al, 40K, 52Mn, 57Ni, and 208Tl
(Weidenspointner 1999). Identification of these
isotopes was achieved in an iterative process, starting from the most
prominent lines. The
![]() and E2 spectra (see
Fig. 6) are particularly useful for the
identification of isotopes that give rise to single photon (type A) or multiple photon (type C) events, respectively. The
diagnostic power of E1 spectra is limited since they do
not exhibit line features at the energy of the incident photons, but
only rather broad features at the corresponding Compton edges. Due to
the correlated signatures in
E1-E2 space,
individual spectral features can be accentuated by applying suitable
event selections. Viable isotope identifications are required to
account self-consistently for spectral features in selected regions of
the
E1-E2 dataspace (see the detailed
explanations in Appendix B), as well as for
their variation with time and/or incident cosmic-ray intensity
(discussed in Sect. 5). The telescope response to
individual isotopes was modelled through Monte Carlo simulations.
The isotopes, their half-lifes, most important decay channels, and
main production channels are summarized in
Table 1. Below, a review of the isotope
identifications is given (a more detailed account on the COMPTEL
instrumental line background can be found in, e.g., Weidenspointner
1999).
and E2 spectra (see
Fig. 6) are particularly useful for the
identification of isotopes that give rise to single photon (type A) or multiple photon (type C) events, respectively. The
diagnostic power of E1 spectra is limited since they do
not exhibit line features at the energy of the incident photons, but
only rather broad features at the corresponding Compton edges. Due to
the correlated signatures in
E1-E2 space,
individual spectral features can be accentuated by applying suitable
event selections. Viable isotope identifications are required to
account self-consistently for spectral features in selected regions of
the
E1-E2 dataspace (see the detailed
explanations in Appendix B), as well as for
their variation with time and/or incident cosmic-ray intensity
(discussed in Sect. 5). The telescope response to
individual isotopes was modelled through Monte Carlo simulations.
The isotopes, their half-lifes, most important decay channels, and
main production channels are summarized in
Table 1. Below, a review of the isotope
identifications is given (a more detailed account on the COMPTEL
instrumental line background can be found in, e.g., Weidenspointner
1999).
Thermal-neutron capture on hydrogen results in the production of a
stable 2D nucleus and the emission of a single 2.22 MeV
photon, as seen in
![]() (see top panel in
Fig. 6). The liquid scintillator NE 213A in the D1
detector modules consists of 9.2% H and 90.8% C by mass, making it
an efficient moderator for neutrons. The instrumental 2.22 MeV
photons are isotropically emitted from the D1 scintillators and
constitute single photon (type A) background events. The average
moderation and absorption times in the D1 scintillator for an incident
neutron are a few
(see top panel in
Fig. 6). The liquid scintillator NE 213A in the D1
detector modules consists of 9.2% H and 90.8% C by mass, making it
an efficient moderator for neutrons. The instrumental 2.22 MeV
photons are isotropically emitted from the D1 scintillators and
constitute single photon (type A) background events. The average
moderation and absorption times in the D1 scintillator for an incident
neutron are a few ![]() s and about 3 10-4 s, respectively,
hence the instrumental 2.22 MeV line is a quasi-prompt background
component that follows the local, instantaneous cosmic-ray intensity
(Weidenspointner et al. 1996). This quasi-prompt
nature of the production/emission of the 2.22 MeV line is the reason
for treating, in the following, the stable isotope 2D as if it
were unstable, and for referring to it as "short-lived''. In
principle, the initial scatterings of the incident neutrons could be
identified by their PSD values. However, the time-scale for the
moderation and absorption of an incident high-energy neutron is too
long to associate the initial scatterings with the delayed neutron
capture producing the
s and about 3 10-4 s, respectively,
hence the instrumental 2.22 MeV line is a quasi-prompt background
component that follows the local, instantaneous cosmic-ray intensity
(Weidenspointner et al. 1996). This quasi-prompt
nature of the production/emission of the 2.22 MeV line is the reason
for treating, in the following, the stable isotope 2D as if it
were unstable, and for referring to it as "short-lived''. In
principle, the initial scatterings of the incident neutrons could be
identified by their PSD values. However, the time-scale for the
moderation and absorption of an incident high-energy neutron is too
long to associate the initial scatterings with the delayed neutron
capture producing the ![]() -ray. The instrumental 2.22 MeV events
therefore cannot be rejected by a selection on PSD.
-ray. The instrumental 2.22 MeV events
therefore cannot be rejected by a selection on PSD.
The bulk of the neutrons producing 2D are expected to be of atmospheric origin, with secondary neutrons produced in the spacecraft being of minor importance. This follows from measurements of the fast-neutron flux in the D1 detector and Monte Carlo simulations of the production of secondary neutrons in cosmic-ray interactions (Morris et al. 1995a), as well as from an estimate for the neutron absorption efficiency of the D1 detector.
The main production channels for 24Na are neutron-capture
reactions such as 27Al(n, ![]() )24Na and proton
reactions such as 27Al(p, 3pn)24Na. The Al structure of
the D1 detector system is the primary source of 24Na
activation.
As described in Sect. 3, spectral features of
the 24Na background in both the
)24Na and proton
reactions such as 27Al(p, 3pn)24Na. The Al structure of
the D1 detector system is the primary source of 24Na
activation.
As described in Sect. 3, spectral features of
the 24Na background in both the
![]() and
E2 spectra can be understood by considering its cascade
nature (type C events). In particular, the two photons with
energies of 1.37 MeV and 2.75 MeV produce line features at about
1.3 MeV and 2.7 MeV in E2 (see bottom panel in
Fig. 6).
and
E2 spectra can be understood by considering its cascade
nature (type C events). In particular, the two photons with
energies of 1.37 MeV and 2.75 MeV produce line features at about
1.3 MeV and 2.7 MeV in E2 (see bottom panel in
Fig. 6).
In addition, the time-variation of the 24Na event rate is
consistent with expectations for an isotope with a half-life of 15 h
that is produced during SAA passages (see
Sect. 5.1). Also, ToF distributions summed using data
selections that favour 24Na events have the characteristics of
type C background events, i.e. they peak slightly below a ToF
value of 5 ns (see Fig. 7), corresponding to an
average distance of the location of the photon emission from the D1
module of about 20-30 cm.
| |
Figure 7: The measured ToF distribution of 24Na events from the vicinity of the D1 detector |
| Open with DEXTER | |
40K is one of the contributors to the spectral line feature at
about 1.4 MeV in
![]() (see top panel of
Fig. 6). A prominent line at this energy was
present before launch in some of the calibration data, and at
that time was tentatively identified with primordial 40K
radioactivity, contained e.g. in the concrete of the buildings.
The 1.4 MeV line was still present after launch, however, and did
not vary with any orbital parameter, indicating an instrumental
origin as well.
(see top panel of
Fig. 6). A prominent line at this energy was
present before launch in some of the calibration data, and at
that time was tentatively identified with primordial 40K
radioactivity, contained e.g. in the concrete of the buildings.
The 1.4 MeV line was still present after launch, however, and did
not vary with any orbital parameter, indicating an instrumental
origin as well.
A viable explanation for the instrumental 1.4 MeV line was the
potassium in the glass of the D1 PMTs (van Dijk 1996).
Electron capture by 40K results in the emission of a single
1.46 MeV photon (type A event). This origin is supported by the
fact that a disproportionate fraction of the photons at 1.46 MeV
interact in the outer sections of the D1 scintillator, indicating that
the photons enter the D1 detectors from the sides, consistent with the
location of the D1 PMTs. Also, the observed
![]() distribution at 1.46 MeV peaks at high
distribution at 1.46 MeV peaks at high
![]() values, again
indicating that the photons enter from the sides. These
characteristics were reproduced in Monte Carlo
simulations. Furthermore, the potassium content in the D1 PMTs derived
from the observed 1.4 MeV line rate is consistent with the
manufacturer's specifications, as was confirmed by radiological
measurements of a PMT in the laboratory. The mass of the PMT front
window (made of Corning France 801.51) is about 24.9 g, with a
potassium mass fraction of 6%; the mass of the PMT side and back
glass (both made of Schott 8245) is about 40.7 g and 9.1 g,
respectively, both with a potassium mass fraction of 0.14%. The front
window contains more than 95% of the potassium in the PMTs and is
closest to the detectors. The 40K background therefore is
dominated by the front window. The 40K activity of the front
window, normalized to its mass, is about 0.2 decays s-1 g-1.
values, again
indicating that the photons enter from the sides. These
characteristics were reproduced in Monte Carlo
simulations. Furthermore, the potassium content in the D1 PMTs derived
from the observed 1.4 MeV line rate is consistent with the
manufacturer's specifications, as was confirmed by radiological
measurements of a PMT in the laboratory. The mass of the PMT front
window (made of Corning France 801.51) is about 24.9 g, with a
potassium mass fraction of 6%; the mass of the PMT side and back
glass (both made of Schott 8245) is about 40.7 g and 9.1 g,
respectively, both with a potassium mass fraction of 0.14%. The front
window contains more than 95% of the potassium in the PMTs and is
closest to the detectors. The 40K background therefore is
dominated by the front window. The 40K activity of the front
window, normalized to its mass, is about 0.2 decays s-1 g-1.
Routine data processing and the investigation of galactic 1.8 MeV line
emission from radioactive 26Al indicated the build-up of a broad
background component at about 1.5 MeV in
![]() (see top
panel of Fig. 6). Investigations of the energy
distribution of this background feature, as well as of its ToF
dependence, led to its identification with the
(see top
panel of Fig. 6). Investigations of the energy
distribution of this background feature, as well as of its ToF
dependence, led to its identification with the ![]() -decay of
22Na produced in the D1 detector material (Oberlack
1997). This background component is produced by a two
photon cascade (type C event) with energies of
-decay of
22Na produced in the D1 detector material (Oberlack
1997). This background component is produced by a two
photon cascade (type C event) with energies of ![]() 500 keV and
500 keV and ![]() 1.3 MeV, consistent with the absorption of the
1.275 MeV photon in D2, and the scattering of an annihilation 511 keV
photon in D1 (the reverse process, involving absorption of the 511 keV
photon in D2, is suppressed because 511 keV is below the D2
threshold). The ToF distribution of the 1.275 MeV 22Na line in
E2 is consistent with the ToF signature of the 24Na
cascade. The build-up of the feature is consistent with an isotope of
half-life of 2.6 y (see Sect. 5.1).
1.3 MeV, consistent with the absorption of the
1.275 MeV photon in D2, and the scattering of an annihilation 511 keV
photon in D1 (the reverse process, involving absorption of the 511 keV
photon in D2, is suppressed because 511 keV is below the D2
threshold). The ToF distribution of the 1.275 MeV 22Na line in
E2 is consistent with the ToF signature of the 24Na
cascade. The build-up of the feature is consistent with an isotope of
half-life of 2.6 y (see Sect. 5.1).
The most important process for the production of 22Na in the D1 detector are proton interactions in the aluminium structure, the main channel being 27Al(p, 3p3n)22Na. Based on the production cross-sections, some 22Na should also be produced in proton interactions with silicon, found in the glass of the D1 PMTs, such as Si(p, 4pxn). It is expected that most of the 22Na production occurs during SAA passages (see Sect. 5.1).
The isotope 28Al is produced by thermal-neutron capture on
aluminium, the most abundant element in the D1 detector. The existence
of the strong 2D line due to thermal-neutron capture on
hydrogen indicates the presence of a thermal-neutron flux in the D1
scintillators. The cross-section for thermal-neutron capture on
aluminium has a value of 0.28 mb (cf. 0.33 mb for hydrogen). Upon
its ![]() -decay, 28Al can generate a type C
background event: the 1.78 MeV photon is absorbed in D2, with a
bremsstrahlung photon (from the
-decay, 28Al can generate a type C
background event: the 1.78 MeV photon is absorbed in D2, with a
bremsstrahlung photon (from the ![]() )
scattering in D1. A
small fraction of the 28Al decays result in type A
background events from the double scattering of the 1.78 MeV
photon.
)
scattering in D1. A
small fraction of the 28Al decays result in type A
background events from the double scattering of the 1.78 MeV
photon.
From the beginning of the mission a weak, albeit significant, line feature at about 1.8 MeV has consistently been present in the E2 distribution (see bottom panel of Fig. 6). The position of this feature is independent of E1, as expected for a type C event. Additional support for the identification of 28Al comes from the fact that, as expected, the 1.8 MeV feature is short-lived (see Sect. 5.2).
The above mentioned isotopes were not sufficient to account entirely
for the pronounced and broad ![]() 1.4 MeV feature in
E2 that built up over the mission. After subtracting the
effects of the other isotopes, there was clear evidence for a build-up
of the 1.4 MeV residual, whose half-life was estimated to be between
that of 24Na and that of 22Na (assuming that it is due to a
single isotope). The E1 dependence of the 1.4 MeV residual
in E2 suggested that the line is due to a
1.4 MeV feature in
E2 that built up over the mission. After subtracting the
effects of the other isotopes, there was clear evidence for a build-up
of the 1.4 MeV residual, whose half-life was estimated to be between
that of 24Na and that of 22Na (assuming that it is due to a
single isotope). The E1 dependence of the 1.4 MeV residual
in E2 suggested that the line is due to a ![]() -decay
and therefore arises from type C background events.
After detailed modelling of the E2 and
-decay
and therefore arises from type C background events.
After detailed modelling of the E2 and
![]() spectra, taking into account the material composition of the D1
detector, it was concluded that the 1.4 MeV residual is due to a blend
of two different isotopes, namely 52Mn (1.43 MeV) and 57Ni
(1.38 MeV).
spectra, taking into account the material composition of the D1
detector, it was concluded that the 1.4 MeV residual is due to a blend
of two different isotopes, namely 52Mn (1.43 MeV) and 57Ni
(1.38 MeV).
The isotope 52Mn is produced in SAA-proton interactions
with the Fe, Cr, and Ni in the D1
detector![]() , found mainly
in the electronics. Matters are complicated by the
fact that 52Mn can be produced in either its ground state or
an isomeric state. These two states have different half-lifes and
decay schemes. The time variation
of the 52Mn event rate suggests that this isotope is
more likely produced in the ground state (
T1/2 = 5.6 d) than in
the isomeric state (
T1/2 = 21.1 min), as described in
Sect. 5.1. In this case, most 52Mn events are
due to the absorption of a 1.43 MeV photon in D2, accompanied by the
scattering of another photon, from the radioactive decay or positron
annihilation, in D1.
, found mainly
in the electronics. Matters are complicated by the
fact that 52Mn can be produced in either its ground state or
an isomeric state. These two states have different half-lifes and
decay schemes. The time variation
of the 52Mn event rate suggests that this isotope is
more likely produced in the ground state (
T1/2 = 5.6 d) than in
the isomeric state (
T1/2 = 21.1 min), as described in
Sect. 5.1. In this case, most 52Mn events are
due to the absorption of a 1.43 MeV photon in D2, accompanied by the
scattering of another photon, from the radioactive decay or positron
annihilation, in D1.
The isotope 57Ni is expected to be mostly produced by proton
interactions with Ni and Cu in the D1 detector during SAA
passages![]() . The 57Ni background is mainly produced by the
absorption of the 1.38 MeV photon in D2, with one of the 511 keV
annihilation photons scattering in D1 (type C event). Similar to
52Mn, the identification of 57Ni, which has a
half-life of about 36 h, is supported
by modelling the observed long-term variation of its
background contribution (see Sect. 5.1).
. The 57Ni background is mainly produced by the
absorption of the 1.38 MeV photon in D2, with one of the 511 keV
annihilation photons scattering in D1 (type C event). Similar to
52Mn, the identification of 57Ni, which has a
half-life of about 36 h, is supported
by modelling the observed long-term variation of its
background contribution (see Sect. 5.1).
Similar to the 1.4 MeV feature, the 2.7 MeV feature in E2represents a blend of lines from more than a single isotope. In addition to 24Na, at least one component with a very long half-life (exceeding that of 22Na) is present. The position of the residual is about 2.6 MeV. 208Tl, which is part of the natural 232Th decay chain, is the most viable candidate.
The isotope 208Tl undergoes ![]() -decay through several
channels, all of which involve the emission of at least two photons,
implying that the 208Tl multiple photon (type C) events are
efficient in triggering the telescope. The half-life of 208Tl is
only 3.1 min. If the isotope is part of a natural decay chain,
however, then its effective half-life is equal to the longest
half-life of any of its parent isotopes, which in this case is the
isotope 232Th with a half-life of
1.4 1010 y. The
main channel for the production of background events by 208Tl is
the absorption of the 2.61 MeV photon in D2, with another photon
scattering in D1.
-decay through several
channels, all of which involve the emission of at least two photons,
implying that the 208Tl multiple photon (type C) events are
efficient in triggering the telescope. The half-life of 208Tl is
only 3.1 min. If the isotope is part of a natural decay chain,
however, then its effective half-life is equal to the longest
half-life of any of its parent isotopes, which in this case is the
isotope 232Th with a half-life of
1.4 1010 y. The
main channel for the production of background events by 208Tl is
the absorption of the 2.61 MeV photon in D2, with another photon
scattering in D1.
It was assumed that 208Tl is distributed like 40K and is
only present in the front glass of the D1 PMTs. This was tested by
recording ![]() -ray spectra of a spare D1 PMT using a Ge
spectrometer. Taking the COMPTEL results for the 40K and
208Tl lines at face value, and assuming that both isotopes are
equally distributed in the D1 PMTs, one expects that the 208Tl
activity is about 10-2 decays s-1 g-1 in the front
window or about 6% of that of 40K, based on the simulated
efficiencies, corresponding to a 232Th mass fraction of a few
10-8. Unfortunately, the laboratory measurement of 208Tl
was inconclusive. The 1.46 MeV 40K line is detected at the
12
-ray spectra of a spare D1 PMT using a Ge
spectrometer. Taking the COMPTEL results for the 40K and
208Tl lines at face value, and assuming that both isotopes are
equally distributed in the D1 PMTs, one expects that the 208Tl
activity is about 10-2 decays s-1 g-1 in the front
window or about 6% of that of 40K, based on the simulated
efficiencies, corresponding to a 232Th mass fraction of a few
10-8. Unfortunately, the laboratory measurement of 208Tl
was inconclusive. The 1.46 MeV 40K line is detected at the
12![]() level above the general background (
level above the general background (
![]() counts). The strongest 208Tl lines at 2.61 MeV and 0.58 MeV,
however, with intensities of 100% and 85.5%, were only detected at
the 0.9
counts). The strongest 208Tl lines at 2.61 MeV and 0.58 MeV,
however, with intensities of 100% and 85.5%, were only detected at
the 0.9![]() (
(![]() counts) and 1.4
counts) and 1.4![]() (
(
![]() counts) level, respectively. Although consistent with
expectations, these numbers are insufficient to test the
assumptions. Much longer integration times are needed.
counts) level, respectively. Although consistent with
expectations, these numbers are insufficient to test the
assumptions. Much longer integration times are needed.
The activity of isotopes contributing to the COMPTEL background (except for the primordial radio-isotopes 40K and 208Tl) in general varies in time. They are produced by interactions of primary and secondary cosmic-ray particles and radiation-belt (SAA) particles within the instrument material. The intensity of each of these particle species, and hence the level of activation, changes in time due to orbit details (e.g. the satellite's altitude, the geomagnetic cut-off rigidity, the SAA radiation dose) and the solar cycle. The activity of a specific radioactive isotope then results from the competing processes of activation (production) and decay.
The variation of the activity of a specific isotope is complex in
general.
If the isotope's half-life T1/2 and the typical time-scale(s)
![]() for the intensity variation of the particle population(s)
producing it are very different, however, the activity variations can
be described rather simply.
For
for the intensity variation of the particle population(s)
producing it are very different, however, the activity variations can
be described rather simply.
For
![]() ,
the isotope's activity approximatly follows
the incident cosmic-ray particle intensity and its orbital variation
(see Sect. 5.2). This is, e.g., the case for
short-lived isotopes (
,
the isotope's activity approximatly follows
the incident cosmic-ray particle intensity and its orbital variation
(see Sect. 5.2). This is, e.g., the case for
short-lived isotopes (
![]() a
few minutes) produced by primary cosmic-ray particles or neutrons,
such as 2D and 28Al. For
a
few minutes) produced by primary cosmic-ray particles or neutrons,
such as 2D and 28Al. For
![]() ,
a long-term
build-up occurs since the activated nuclei do not decay away between
consecutive SAA transits (see Sect. 5.1). This is,
e.g., the case for long-lived isotopes (
,
a long-term
build-up occurs since the activated nuclei do not decay away between
consecutive SAA transits (see Sect. 5.1). This is,
e.g., the case for long-lived isotopes (
![]() min, i.e. the orbital period) produced during SAA passages (which occur 6-8
times each day), such as 22Na and 24Na. Intermediate
half-lifes produce more complicated variability.
min, i.e. the orbital period) produced during SAA passages (which occur 6-8
times each day), such as 22Na and 24Na. Intermediate
half-lifes produce more complicated variability.
The long-term and orbital variations of spectral features are useful in identifying their physical origin. Spectral features arising from primordial radioactivity will show no variation. Prompt and short-lived components will vary with incident cosmic-ray intensity, i.e. on time-scales shorter than an orbital period. In addition, prompt and short-lived components may also vary over long time-scales if their production is sensitive to changes in the cosmic-ray intensity due to the solar cycle or the orbit altitude. Spectral features due to long-lived isotopes will exhibit variations on time-scales that reflect their half-life as well as the changes in SAA dosage. With regard to a spectral feature not yet identified, these long-term variations provide a crude estimate of its half-life. With regard to a tentatively identified isotope, comparison of its time-dependent activity with an empirical model serves as an important cross-check for the correctness of its identification.
The long-term variation of the activity of
long-lived radio-nuclides arises from the combined effects of
the isotopes' decay and the time history of the activation episodes
during SAA transits. Activation outside the SAA by cosmic-ray
particles is negligible (see e.g. Kurfess et al. 1989), since the average daily fluence due to SAA
particles by far exceeds that of cosmic-ray particles.
The count rate in the CAL-units can be used to model the
production of long-lived radio-nuclides (Varendorff et al. 1997, hereafter referred to as "activity model'').
The small plastic scintillators (thickness 3 mm, diameter 12 mm)
of the CAL-units are sensitive to protons and other charged particles,
but insensitive to secondary ![]() -ray photons. They therefore provide a
measure of the charged-particle flux at the instrument (Snelling et
al. 1986).
The trigger rates of the two CAL-units above both a low and a high
threshold value are available for all times, including SAA transits.
Most other instrument systems are switched off during SAA passages,
including the veto shields which therefore cannot be used as charged
particle monitors for the activity model. The high-threshold trigger
rate of CAL-unit B (
-ray photons. They therefore provide a
measure of the charged-particle flux at the instrument (Snelling et
al. 1986).
The trigger rates of the two CAL-units above both a low and a high
threshold value are available for all times, including SAA transits.
Most other instrument systems are switched off during SAA passages,
including the veto shields which therefore cannot be used as charged
particle monitors for the activity model. The high-threshold trigger
rate of CAL-unit B (
![]() )
is most useful because
it is the least affected by noise and long-term efficiency
degradation. Only telemetry data gaps interrupt this measure of the
cosmic-ray intensity.
)
is most useful because
it is the least affected by noise and long-term efficiency
degradation. Only telemetry data gaps interrupt this measure of the
cosmic-ray intensity.
To achieve continuous information on the charged-particle flux during
every SAA passage, the activity model employs a neural net to describe
![]() as a function of orbit
altitude, geographic longitude and latitude, time since launch (to
include variations due to the solar cycle), and orientation (azimuth
and zenith) of the satellite relative to its velocity vector (to
account for asymmetries in the incident SAA-proton flux, see e.g. Watts et al. 1989). The number of nuclei of a
specific isotope as a function of time, N(t), is then given by:
as a function of orbit
altitude, geographic longitude and latitude, time since launch (to
include variations due to the solar cycle), and orientation (azimuth
and zenith) of the satellite relative to its velocity vector (to
account for asymmetries in the incident SAA-proton flux, see e.g. Watts et al. 1989). The number of nuclei of a
specific isotope as a function of time, N(t), is then given by:
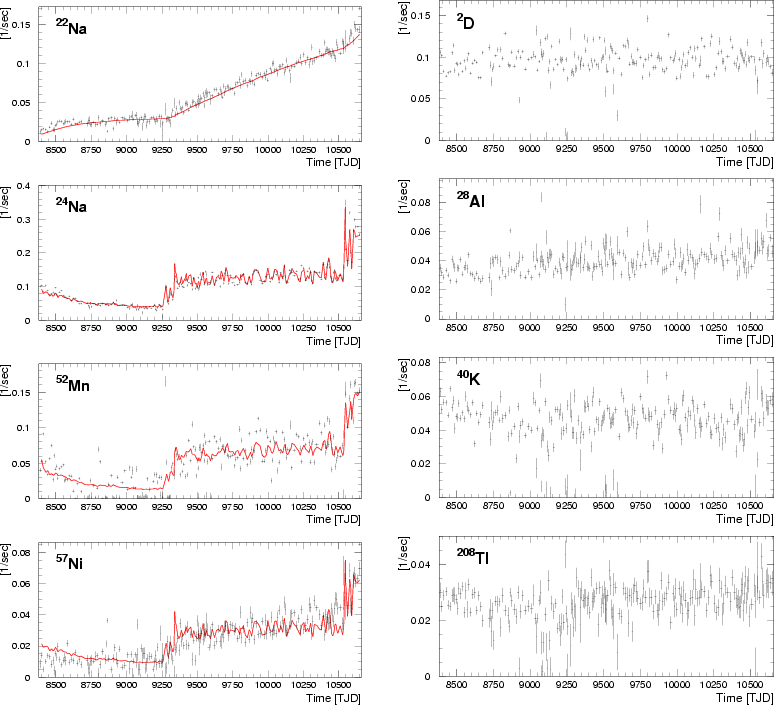 |
Figure 8: The measured event rates due to the long-lived isotopes 22Na, 24Na, 52Mn, and 57Ni, the short-lived isotopes 2D and 28Al, and the primordial isotopes 40K and 208Tl as a function of time for the first 6 years (May 1991 through July 1997) of the CGRO mission for imaging event selections. In addition, the predictions of the normalized activity model for the long-lived isotopes is depicted with solid grey lines |
| Open with DEXTER | |
| |
Figure 9: The altitude of the CGRO orbit as a function of time from May 1991 through July 1997. The two reboosts of the orbit around TJD 9280 (Oct.-Dec. 1993) and TJD 10560 (Apr.-May 1997) are clearly seen. The rapid decay of the orbit at the beginning of the mission results from the increased drag of the expanded atmosphere at solar maximum |
| Open with DEXTER | |
A comparison of the measured event rates due to the long-lived
isotopes 22Na, 24Na, 52Mn, and 57Ni with the
predictions of the normalized activity model from May 1991 through
July 1997 is depicted in the left panels of
Fig. 8. In addition, the long-term variation
determined for the event rates arising from the short-lived isotopes
2D and 28Al, as well as from the primordial radio-nuclides
40K and 208Tl are shown in the right panels of
Fig. 8. These rates were obtained from the
study of the galactic 26Al 1.8 MeV line emission, which requires
a measure of the isotopes' background contributions for each
observation period (see Appendix B.2) under imaging
event selections (see Appendix A.2). The
scatter of the eight sets of event rates, particularly those for the
primordial radio-isotopes 40K and 208Tl, is larger than what
is expected from statistics alone. Part of the additional scatter is
expected from intrinsic inadequacies of the fitting procedure (such as
the correction for the Earth-horizon angle selection, see
Appendix B.2) and of the fit models employed (these
cannot account for all structures in the E2 and
![]() spectra, which particularly affects weak components,
see below and Appendix B). Partly, however, the
additional scatter may be attributed to known physical effects. Due to
the precession of the satellite orbit the radiation dose from SAA
transits may vary considerably between observation periods. In
addition, the orientation of the satellite relative to the anisotropic
SAA-particle flux affects the radiation dose in the D1 detector, which
is the major source of instrumental line background. The resulting
differences in SAA radiation dose between observation periods
contribute to the scatter in the event rates of the long-lived
isotopes. Since the CAL-units are located half-way between the D1 and
D2 detectors, shielding effects due to surrounding spacecraft
materials may result in less variation in
spectra, which particularly affects weak components,
see below and Appendix B). Partly, however, the
additional scatter may be attributed to known physical effects. Due to
the precession of the satellite orbit the radiation dose from SAA
transits may vary considerably between observation periods. In
addition, the orientation of the satellite relative to the anisotropic
SAA-particle flux affects the radiation dose in the D1 detector, which
is the major source of instrumental line background. The resulting
differences in SAA radiation dose between observation periods
contribute to the scatter in the event rates of the long-lived
isotopes. Since the CAL-units are located half-way between the D1 and
D2 detectors, shielding effects due to surrounding spacecraft
materials may result in less variation in
![]() than in the
D1 radiation dose, so that the activity model would underpredict this
variation. Orientation effects may also result in variations of the
effective cosmic-ray particle flux between observation periods and add
some scatter to the event rates of short-lived isotopes.
than in the
D1 radiation dose, so that the activity model would underpredict this
variation. Orientation effects may also result in variations of the
effective cosmic-ray particle flux between observation periods and add
some scatter to the event rates of short-lived isotopes.
The long-term variation of the long-lived isotopes reflects the variation of the SAA radiation dose, which depends, among other parameters, on orbit altitude and solar cycle. 24Na is the best tracer of the changing intensity of the encountered SAA-particle fluxes, as it is the strongest component of the line background and has a half-live of about 15 h. From the beginning of the mission until the first reboost (around TJD 9280), the decay of the orbital altitude (see Fig. 9) results in a monotonic decrease of the incident SAA-particle fluxes. The SAA radiation dose increased after the first reboost; the effect of the slow decrease of the orbital altitude is probably more than compensated by the solar cycle, which proceeded towards solar minimum, resulting in the observed net increase of SAA radiation dose over time. The second reboost (around TJD 10560) again resulted in a significant increase of activation during SAA passages. The long-term variation of the 52Mn and 57Ni event rates is similar to that of 24Na, since the half-lifes of these isotopes are of the same order. The long-term behaviour of the 22Na event rate is quite different. Its 2.6 y half-life is significantly longer than the typical time-scale of the changes in SAA radiation dose. Therefore 22Na never reaches an equilibrium between activation and decay, but is continuously built up, with the two reboosts resulting in increases in the slope of the 22Na activity trend.
The fact that the activity model reproduces the long-term variation of the event rates from long-lived isotopes confirms the model assumptions, in particular that activation predominantly occurs during SAA transits. The model can also verify the isotope identifications, as the activity of an isotope depends, among other parameters, on its half-life (see Eqs. (2) and (3)).
The background produced by the short-lived isotopes 2D and
28Al is not expected to be influenced by SAA radiation dose,
rather, any long-term trends will arise from variations in the average
cosmic-ray intensity. The count rate in the 2.22 MeV line does not
exhibit any significant long-term variation. The orbital variation of
the event rate in the 2.22 MeV line (Weidenspointner et al. 1996) is similar to that of the fast-neutron flux
(
![]() MeV) in the D1 detector (Morris et al. 1995a), as discussed in
Sect. 5.2. In addition, Morris et al. (1995a) demonstrated that the solar cycle
variation of the fast-neutron flux is much less than its orbit
variation. It is therefore expected that the relatively weak solar
cycle dependence of the 2.22 MeV line is dominated by the much greater
orbital variations, which presumably accounts for much of the observed
scatter. Similar to 2D, the isotope 28Al is predominantly
produced by thermal-neutron captures. Hence 28Al is expected to
exhibit the same long-term variation as 2D. However, the low
count rate from 28Al exhibits a slight, increasing trend, hinting
at deficiencies of the fit models and/or contributions from yet
unidentified isotopes.
MeV) in the D1 detector (Morris et al. 1995a), as discussed in
Sect. 5.2. In addition, Morris et al. (1995a) demonstrated that the solar cycle
variation of the fast-neutron flux is much less than its orbit
variation. It is therefore expected that the relatively weak solar
cycle dependence of the 2.22 MeV line is dominated by the much greater
orbital variations, which presumably accounts for much of the observed
scatter. Similar to 2D, the isotope 28Al is predominantly
produced by thermal-neutron captures. Hence 28Al is expected to
exhibit the same long-term variation as 2D. However, the low
count rate from 28Al exhibits a slight, increasing trend, hinting
at deficiencies of the fit models and/or contributions from yet
unidentified isotopes.
The activity of the primordial radio-nuclides 40K and 208Tl is constant over the duration of the mission. Both data sets are consistent with this fact, although a small long-term increase may be present for 208Tl. Again, this apparent increase may be due to deficiencies of the fitting procedure and/or due to yet unidentified line background components.
The activity model can not only be used to predict the number of
nuclei activated during SAA passages, but also to estimate the average
daily SAA-proton fluence from the daily increase in the number of
proton-produced nuclei. For example, based on the measured
22Na event rate a daily average SAA-proton fluence
(
![]() MeV) of 2.3 105 protons cm-2 was
inferred by Varendorff et al. (1997) for the
beginning of the mission during solar maximum at an altitude of
440 km. Considering the uncertainties in this measurement, and the
large altitude gradient of the SAA-proton flux (Stassinopoulos
1989), this value is in good agreement with the
prediction of 5 105 protons cm-2 for an altitude of
462 km (Dyer et al. 1994).
MeV) of 2.3 105 protons cm-2 was
inferred by Varendorff et al. (1997) for the
beginning of the mission during solar maximum at an altitude of
440 km. Considering the uncertainties in this measurement, and the
large altitude gradient of the SAA-proton flux (Stassinopoulos
1989), this value is in good agreement with the
prediction of 5 105 protons cm-2 for an altitude of
462 km (Dyer et al. 1994).
The prompt instrumental background closely tracks the local,
instantaneous cosmic-ray intensity, which can, e.g., be parameterized
by a geomagnetic cut-off rigidity. Another way of parameterizing the
incident cosmic-ray intensity is to use the count rate of the
anti-coincidence domes of the COMPTEL instrument, referred to as
"veto rate'' in the following![]() . To a good
approximation, the prompt background components vary in proportion to
the incident cosmic-ray intensity as monitored by the veto rate. The
best example of this are 2D and 28Al
(Fig. 10), determined for CDG event selections
(see Appendix A.1). In the following discussion,
"veto rate'' and "incident cosmic-ray intensity'' are therefore used
interchangeably.
In contrast to prompt background components, the activity of the
primordial radio-isotopes 40K and 208Tl is independent
of incident cosmic-ray intensity and hence does not vary with veto
rate. The activity variation of long-lived isotopes such as
22Na with veto rate is complex and depends on the isotopes'
half-life as well as on the geophysical environment. Similar to the
study of the long-term variation, the study of the variation of the
event rate of a background component with cosmic-ray intensity can be
helpful in identifying the responsible isotope.
. To a good
approximation, the prompt background components vary in proportion to
the incident cosmic-ray intensity as monitored by the veto rate. The
best example of this are 2D and 28Al
(Fig. 10), determined for CDG event selections
(see Appendix A.1). In the following discussion,
"veto rate'' and "incident cosmic-ray intensity'' are therefore used
interchangeably.
In contrast to prompt background components, the activity of the
primordial radio-isotopes 40K and 208Tl is independent
of incident cosmic-ray intensity and hence does not vary with veto
rate. The activity variation of long-lived isotopes such as
22Na with veto rate is complex and depends on the isotopes'
half-life as well as on the geophysical environment. Similar to the
study of the long-term variation, the study of the variation of the
event rate of a background component with cosmic-ray intensity can be
helpful in identifying the responsible isotope.
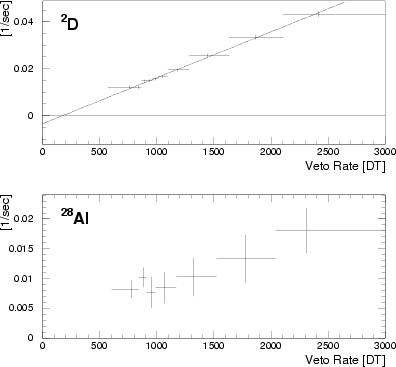 |
Figure 10: The veto rate variation of the count rate due the background isotopes 2D and 28Al as measured for CDG event selections. The dashed line is a linear fit to the measured 2D event rate |
| Open with DEXTER | |
In the following, the physical origin of the complex and - in general - non-linear variation of the event rate of long-lived isotopes with incident cosmic-ray intensity as monitored by veto rate is illustrated with the isotope 22Na, which has a half-life of 2.6 y. To investigate the variation of a line background component with veto rate over a given time period the events are sorted in energy spectra, one for each of a set of veto rate intervals, according to the veto rate value at the time the events were recorded. The event rate due to the background isotope under study is then determined for each veto rate bin in an iterative line fitting procedure described in Appendix B.1. Each of these rates represents the "average'' event rate due to the isotope in a given veto rate interval over a given time period.
The veto rate variation of the event rate due to 22Na over relatively short periods of time, during which the geophysical environment did not change significantly, is illustrated in Fig. 11 for data from 1991-1993 (CGRO Phases I and II) and from 1994-1995 (CGRO Cycle 4). To a good approximation, the 22Na event rate is independent of veto rate, as expected for a half-life of 2.6 years. The average 22Na event rate increased with time due to the build-up of this isotope during successive SAA passages (see Fig. 8). An increasing background contribution is also observed for long-lived isotopes with shorter half-lifes, such as 24Na with T1/2 = 15 h. However, due to a correlation between the encountered geomagnetic cut-off rigidity and the time since the last SAA transit, there is some correlation between the event rate of these isotopes and veto rate, which is generally complex even over relatively short periods of time. Nevertheless, the following conclusions drawn from the veto rate variation of the 22Na event rate apply to long-lived isotopes with shorter half-lifes such as 24Na as well.
![\begin{figure}
\par\includegraphics[width=8.8cm,clip]{H2362F21.ps}\par\includegraphics[width=8.8cm,clip]{H2362F22.ps}
\end{figure}](/articles/aa/full/2001/10/aah2362/img52.gif) |
Figure 11: The count rate from 22Na, determined under CDG event selections, as a function of veto rate for data from 1991-1993 and from 1994-1995 |
| Open with DEXTER | |
| |
Figure 12: The count rate from 22Na, determined under CDG event selections, as a function of veto rate for data from 1991-1996 |
| Open with DEXTER | |
The average variation of the event rate arising from 22Na over
the extended time period from 1991-1996 (CGRO Phase I through
Cycle 5), during which the geophysical environment changed
significantly due to the first reboost (see Fig. 9)
and the solar cycle, is depicted in
Fig. 12. Typically, a bump-like feature, hereafter
referred to as the veto rate bump, appears at low veto rate values
when studying the veto rate variation of the background contribution
of long-lived isotopes over extended periods of time that include at
least one reboost. This is even true for an isotope such as
22Na, whose event rate is independent of veto rate over short
periods of time. It must be emphasized, however, that changes in the
geophysical environment do not always produce a bump-like feature, but
rather result in a complex, non-linear variation of the contribution
from long-lived background components with veto rate.
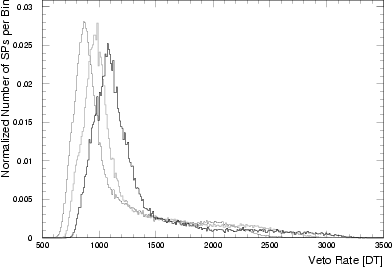 |
Figure 13: The variation of the normalized veto rate frequency distribution with time, exemplified for veto dome 2. Depicted are the normalized veto rate frequency distributions, in units of 16.384 s time intervals (superpackets, SP) per veto rate bin, for the time periods 1991/1992 (thin black line), 1994/1995 (grey line), and 1997/1998 (thick black line) |
| Open with DEXTER | |
To understand the origin of the veto rate bump it is necessary to
realize that the changing geophysical environment not only affects the
activity of long-lived isotopes (see Fig. 8),
but also the veto rate frequency distribution, mostly due to
variations of the incident cosmic-ray intensity with orbit altitude
and solar cycle. This is illustrated in
Fig. 13, depicting the normalized veto rate
frequency distributions for the time periods 1991/1992, 1994/1995, and
1997/1998 (i.e. CGRO Phase I, Cycle 4, and Cycle 7, respectively).
For clarity, the distributions for other Phases/Cycles were omitted as
they are fully consistent with the trend described in the
following. The generic veto rate distribution is characterized by a
pronounced peak at low veto rates, with a flat tail extending to
higher veto rate values. To a good approximation, the time variation
of this generic veto rate frequency distribution can be described by a
slow but steady shift of the peak to higher veto rate values, with
some slight changes of the shape of the distribution such as an
increasing extension of the tail.
![\begin{figure}
\includegraphics[width=8.8cm,clip]{H2362F25.eps}\end{figure}](/articles/aa/full/2001/10/aah2362/img55.gif) |
Figure 14: Illustration of the origin of the veto rate bump. Features such as the veto rate bump result from the combined effects of the time variation of the isotope activity (see Fig. 8) and of the veto rate frequency distribution (see Fig. 13), as explained in detail in the text |
| Open with DEXTER | |
As is illustrated in Fig. 14, the veto rate bump is nothing more than an artifact of the combined effects of the long-term variation in the activity of long-lived isotopes (see Fig. 8) and of the long-term shift of the veto rate frequency distribution (see Fig. 13). For simplicity, let us consider a long-lived isotope whose activity is independent of veto rate over periods of time during which the geophysical conditions do not change, such as 22Na. Let us further consider a combination of two such time intervals of equal duration from early and late in the mission. Late in the mission the isotope activity is higher than early in the mission, and the veto rate distribution is shifted to higher veto rate values. The two sets of data are represented by the two bars in Fig. 14, with the grey-shading indicating the veto rate distribution in terms of the number of 16.384 s sampling intervals (superpackets, see Footnote 4) per veto rate interval, i.e. dark grey indicates that the corresponding veto rate values occurred more often (compare Fig. 13). The average activity (determined as described above) then increases from interval 1 through interval 4 as the late-mission data become relatively more important. In interval 5 both sets of data contribute equally and the average activity is the mean of the individual activities. Finally, only data from the late mission contribute to veto rate interval 6. The net result for the average activity exhibits a general tendency to increase with increasing veto rate with a pronounced bump superimposed - similar to what has been measured for 22Na (compare to Fig. 12). It can easily be demonstrated, following the above example, that the veto rate bump is an almost universal indicator for the presence of radio-isotopes with half-lifes ranging from several minutes to several years when combining data covering extended periods of time during which the geophysical environment inevitably changed. However, the veto rate bump cannot be used to estimate the half-life of an isotope, as can be done with the activity model. Also, it should be noted that non-linear variations of the event rate due to a long-lived isotope with veto rate other than the veto rate bump are to be expected once the isotope activity decreases and/or the veto rate frequency distribution shifts towards lower values as the mission continues.
Among other things, a detailed understanding of the variation of the background contribution of long-lived isotopes with veto rate is necessary for a reliable measurement of the cosmic diffuse gamma-ray background (CDG) at MeV energies. The COMPTEL analyses make use of the variable nature of the instrument background to isolate the CDG signal, which is assumed to be constant (see e.g. Kappadath et al. 2000; Weidenspointner et al. 2001). In particular, above about 4 MeV the instrumental background is exclusively due to prompt processes. These are also present in the background at lower energies, but with large contributions from long-lived radioactive isotopes. Because prompt background components vary, to a good approximation, linearly with incident cosmic-ray intensity as monitored by veto rate, they can be eliminated from the data by an extrapolation technique (Kappadath et al. 1996). In contrast, the event rate of long-lived isotopes does not vary linearly with veto rate. The contributions of long-lived isotopes must therefore be subtracted, as a function of veto rate, before the veto rate extrapolation (Weidenspointner 1999). The validity of a veto rate extrapolation for removing prompt instrumental backgrounds thus depends on the absence of any long-lived background components, since only then can the event rate be assumed to vary linearly with veto rate. Subtraction of non-prompt background components after the veto rate extrapolation is only possible for constant background components, such as primordial radioactivity.
The instrumental line background of an instrument is determined by its
material composition, the radiation environment, and the employed
detection principle. In this respect it is interesting to compare the
COMPTEL instrumental lines with those identified in the data from
other low-energy ![]() -ray experiments on satellite platforms such
as the NaI Gamma-Ray Spectrometer (GRS) onboard the Solar Maximum
Mission (SMM) and the Ge Gamma-Ray Spectrometer (GRS) flown on
HEAO 3. In doing so, one must keep in mind that an instrument's energy
resolution is important for resolving lines. At 1 MeV, the energy
resolution (FWHM) of COMPTEL is 9.8% and 8.8% in
-ray experiments on satellite platforms such
as the NaI Gamma-Ray Spectrometer (GRS) onboard the Solar Maximum
Mission (SMM) and the Ge Gamma-Ray Spectrometer (GRS) flown on
HEAO 3. In doing so, one must keep in mind that an instrument's energy
resolution is important for resolving lines. At 1 MeV, the energy
resolution (FWHM) of COMPTEL is 9.8% and 8.8% in
![]() and E2, respectively (Schönfelder et al. 1993). At the same energy, the resolution of
GRS-SMM was about 5.4% (Forrest et al. 1981), and that
of GRS-HEAO 3 was
and E2, respectively (Schönfelder et al. 1993). At the same energy, the resolution of
GRS-SMM was about 5.4% (Forrest et al. 1981), and that
of GRS-HEAO 3 was
![]() 0.3% (Mahoney
et al. 1980). Therefore, the Ge spectrometer onboard
HEAO 3 is far superior for
0.3% (Mahoney
et al. 1980). Therefore, the Ge spectrometer onboard
HEAO 3 is far superior for ![]() -ray line studies compared to
COMPTEL and GRS-SMM, which have similar resolution. The CGRO
satellite is kept in a circular orbit of 28.5
-ray line studies compared to
COMPTEL and GRS-SMM, which have similar resolution. The CGRO
satellite is kept in a circular orbit of 28.5![]() inclination at
altitudes between about 330 km and 515 km (see
Fig. 9). The SMM and HEAO 3 missions were operated
in circular orbits of 28.5
inclination at
altitudes between about 330 km and 515 km (see
Fig. 9). The SMM and HEAO 3 missions were operated
in circular orbits of 28.5![]() inclination at about 490-570 km
altitude, and 43.6
inclination at about 490-570 km
altitude, and 43.6![]() inclination at about 500 km altitude,
respectively. Similar to COMPTEL, the most abundant element in the
material composition of both GRS-SMM (E. Chupp, priv. comm., 1999)
and GRS-HEAO 3 (Wheaton et al. 1989) is Al in the
instrument structures. Also, all instruments contain significant
amounts of Fe, Ni, Cu, and Cr in, e.g., electronics components.
inclination at about 500 km altitude,
respectively. Similar to COMPTEL, the most abundant element in the
material composition of both GRS-SMM (E. Chupp, priv. comm., 1999)
and GRS-HEAO 3 (Wheaton et al. 1989) is Al in the
instrument structures. Also, all instruments contain significant
amounts of Fe, Ni, Cu, and Cr in, e.g., electronics components.
Five of the eight isotopes identified in the COMPTEL line background, namely 22Na, 24Na, 28Al, 52Mn, and 57Ni, are due to activation of Al and Fe, Ni, Cu, and Cr nuclei in the instrument structure. As expected, each of these isotopes has also been identified in GRS-SMM (Share et al. 1989) and GRS-HEAO 3 (Wheaton et al. 1989) data. For GRS-SMM, however, an additional production channel for 22Na and 24Na were proton and neutron reactions, respectively, on 23Na in the NaI detectors. Other isotopes identified in GRS-SMM and GRS-HEAO 3 that result from activation of the five elements and which have major lines below about 1 MeV should in principle also be present in the COMPTEL background, however, their events are suppressed by the D1 and D2 detector thresholds used in COMPTEL analyses. On the other hand, instrumental lines due to activation of Cs and I (GRS-SMM) or Ge (GRS-HEAO 3) are absent in COMPTEL since they exhibit a ToF value not used in the analysis (I) or since these elements are not present in the instrument (Cs, Ge).
The different detection principles employed in the three instruments
result in significant differences in the relative importance of
specific isotopes, their detectability, and rejectability. COMPTEL
requires coincident interactions in the D1 and D2 detector and
therefore is particularly susceptible to multiple photon events such
as the ![]() -decay of 22Na or the
-decay of 22Na or the ![]() -decay of
24Na (see Sect. 3). Consequently,
multiple photon events are relatively more important than single
photon events. On the other hand, individual photons from these decays
produce photopeaks in E2 that can be used for identifying
individual isotopes and for determining their background
contribution. In addition, the characteristic
E1-E2 signature of multiple photon events
provides a wide range of options for their rejection (or
enhancement). In the SMM and HEAO 3 spectrometers events are triggered
by individual photons.
Unlike the COMPTEL veto system, which consists of plastic scintillator
domes, the anti-coincidence systems of the SMM and HEAO 3
spectrometers were made of CsI crystals and therefore sensitive to
photons at
-decay of
24Na (see Sect. 3). Consequently,
multiple photon events are relatively more important than single
photon events. On the other hand, individual photons from these decays
produce photopeaks in E2 that can be used for identifying
individual isotopes and for determining their background
contribution. In addition, the characteristic
E1-E2 signature of multiple photon events
provides a wide range of options for their rejection (or
enhancement). In the SMM and HEAO 3 spectrometers events are triggered
by individual photons.
Unlike the COMPTEL veto system, which consists of plastic scintillator
domes, the anti-coincidence systems of the SMM and HEAO 3
spectrometers were made of CsI crystals and therefore sensitive to
photons at ![]() -ray line energies. For these two detectors therefore the
probability for a radioactive decay to trigger the detectors is proportional
to the number of emitted photons, as is the probability to trigger the
anti-coincidence systems. To first order, the net probability of a
radioactive decay for generating a background event is therefore
independent of the photon multiplicity for GRS-SMM and GRS-HEAO 3.
As long as the decays occur outside the detectors, individual photons
will give rise to photopeaks in the latter two instruments, and these
backgrounds are harder to suppress by event selections than in
COMPTEL. As far as decays inside the detectors are concerned,
-ray line energies. For these two detectors therefore the
probability for a radioactive decay to trigger the detectors is proportional
to the number of emitted photons, as is the probability to trigger the
anti-coincidence systems. To first order, the net probability of a
radioactive decay for generating a background event is therefore
independent of the photon multiplicity for GRS-SMM and GRS-HEAO 3.
As long as the decays occur outside the detectors, individual photons
will give rise to photopeaks in the latter two instruments, and these
backgrounds are harder to suppress by event selections than in
COMPTEL. As far as decays inside the detectors are concerned,
![]() -decays are particularly hard to identify for GRS-SMM (e.g. activation of Na) and GRS-HEAO 3 (activation of Ge) since the added
-decays are particularly hard to identify for GRS-SMM (e.g. activation of Na) and GRS-HEAO 3 (activation of Ge) since the added
![]() -continuum will broaden
-continuum will broaden ![]() -ray lines beyond recognition. In
COMPTEL, activation in the D2 detector is effectively eliminated by
event (ToF) selection.
-ray lines beyond recognition. In
COMPTEL, activation in the D2 detector is effectively eliminated by
event (ToF) selection.
Since COMPTEL is the first double-scattering Compton telescope
operated in a near-Earth orbit, the instrumental background
experienced during this mission may provide guidance for the design of
future instruments. Below, some implications of the COMPTEL
instrumental line background for conducting ![]() -ray line studies
with this and future instruments are discussed.
-ray line studies
with this and future instruments are discussed.
The by far strongest astrophysical ![]() -ray line signal detected by
COMPTEL is 1.8 MeV line emission from 26Al in the
interstellar medium (Diehl et al. 1995a). When observing
along the galactic plane, the average event rate due to this extended
line source is about 7 10-4 s-1 for imaging
selections (see Appendix A.2). Typical event
rates due to point sources observed by COMPTEL in the light of
-ray line signal detected by
COMPTEL is 1.8 MeV line emission from 26Al in the
interstellar medium (Diehl et al. 1995a). When observing
along the galactic plane, the average event rate due to this extended
line source is about 7 10-4 s-1 for imaging
selections (see Appendix A.2). Typical event
rates due to point sources observed by COMPTEL in the light of ![]() -ray
lines, such as the supernova remnant Cas A (44Ti at 1.12 MeV,
Iyudin et al. 1997), or the type Ia supernova 1991T
(56Co at 0.85 MeV and 1.24 MeV, Morris et al. 1997b), or the Vela region (26Al at
1.8 MeV, Diehl et al. 1995b) are about 3 10-5 s-1. Typical event rates arising from individual
background isotopes are about 10-1 s-1 (see
Fig. 8). Below 3 MeV,
instrumental background lines account for 10-50% of the total
background rate (see Fig. B.8). It follows that
the signal-to-background ratio for astrophysical
-ray
lines, such as the supernova remnant Cas A (44Ti at 1.12 MeV,
Iyudin et al. 1997), or the type Ia supernova 1991T
(56Co at 0.85 MeV and 1.24 MeV, Morris et al. 1997b), or the Vela region (26Al at
1.8 MeV, Diehl et al. 1995b) are about 3 10-5 s-1. Typical event rates arising from individual
background isotopes are about 10-1 s-1 (see
Fig. 8). Below 3 MeV,
instrumental background lines account for 10-50% of the total
background rate (see Fig. B.8). It follows that
the signal-to-background ratio for astrophysical ![]() -ray lines in
general is less than 1%, which can be enhanced to a few percent by
fine-tuning the imaging event selections described in
Appendix A.2 for analyzing a specific
-ray lines in
general is less than 1%, which can be enhanced to a few percent by
fine-tuning the imaging event selections described in
Appendix A.2 for analyzing a specific ![]() -ray
line.
-ray
line.
| Isotope | Efficiency | Material | Activity |
| (Imaging Sel.) | [g-1s-1] | ||
| 2D | 7 10-4 | D1 scintillator | 3.4 10-3 |
| 22Na | 8 10-4 | D1 Al structure | 7 10-4 |
| 24Na | 9 10-4 | D1 Al structure | 9 10-4 |
| 28Al | 2 10-4 | D1 Al structure | 2 10-3 |
| 40K | 2 10-4 | D1 PMT glass | 0.2 |
| 52Mn | 2 10-3 | Fe around D1 | 4 10-4 |
| Cr around D1 | 3 10-4 | ||
| Ni around D1 | 2 10-4 | ||
| Cu around D1 | 7 10-5 | ||
| 57Ni | 5 10-4 | Ni around D1 | 5 10-4 |
| Cu around D1 | 6 10-5 | ||
| 208Tl | 2 10-3 | D1 PMT glass | 10-2 |
In this respect it is interesting to take a look at the efficiency, determined by Monte Carlo simulation, for various isotopes to produce a background event (see Table 2). For imaging selections, this efficiency is about 7 10-4 and 2 10-4 for 2D and 40K, both of which give rise to type A (single photon) background events. A major source of type C multiple photon events is 24Na with an efficiency of about 9 10-4. The efficiency for 208Tl, a minor source of type C events which is assumed to have the same spatial distribution as 40K, is about 2 10-3. This is an order of magnitude larger than the efficiency for 40K and again illustrates that COMPTEL is more susceptible to multiple photon decays than to single photon decays. The more stringent CDG event selections reduce these efficiencies by factors of 4-7 and 2-3 for type A and type C background events, respectively. For comparison, the detection efficiencies for celestial lines around 1-2 MeV are about 2 10-4 using imaging event selections.
A goal for future Compton telescopes is to minimize background production by design. Passive material should be reduced, and manufactured from materials with low activation. Based on simulated efficiencies and the COMPTEL mass model, "mission-averaged'' activities (in decays per g of material per s) were derived for the eight identified isotopes using data representing the first 7 years of the mission (June 1991 to April 1998). These activities, together with the above mentioned simulated efficiencies and the activated materials, are summarized in Table 2. The relative yields for 52Mn and 57Ni were determined in hadron simulations (P. Jean, priv. comm., 1997). The numbers for the average activities are accurate within factors of 2-3. Their major sources of uncertainty are the simulated efficiencies and the mass normalization, which are currently based on the assumption that the activation is homogeneous in a particular material. This may not be accurate for isotopes produced by thermal neutrons, in particular 28Al. As a cross-check, the average activities were compared to simulations of activation of COMPTEL materials, neglecting the contributions of secondary particles, for a solar-maximum radiation environment (P. Jean, priv. comm., 1997). The measured and the simulated activities are generally consistent within factors of a few for isotopes mainly produced by SAA protons. Hence these average activities may be used for estimating the line background rates of future instruments in a similar orbit, taking into account how the mass distribution differs from that of COMPTEL.
We have identified eight different isotopes in the COMPTEL instrumental line background, namely 2D, 22Na, 24Na, 28Al, 40K, 52Mn, 57Ni, and 208Tl. These isotopes can account for the major instrumental background lines. Some minor instrumental lines, however, remain unidentified at this time. In addition, we have studied the variation of the event rate of these isotopes with time and incident cosmic-ray intensity, and determined the average activity of spacecraft materials.
These results provide valuable insight into the physical processes
that give rise to instrumental background lines in ![]() -ray detectors in
low-Earth orbits. Because of their importance for MeV astronomy,
these issues have repeatedly been studied (see, e.g., Dean
et al. 1991 and references therein). Obviously,
each detector has its own, unique instrumental
background. Nevertheless, background investigations such as those reported
in this work add to a growing pool of background experience to be
found in the literature, which will prove to be important for the
design of future instruments and the understanding of their data.
-ray detectors in
low-Earth orbits. Because of their importance for MeV astronomy,
these issues have repeatedly been studied (see, e.g., Dean
et al. 1991 and references therein). Obviously,
each detector has its own, unique instrumental
background. Nevertheless, background investigations such as those reported
in this work add to a growing pool of background experience to be
found in the literature, which will prove to be important for the
design of future instruments and the understanding of their data.
The successful modelling of the time variation of the background
contributions from the long-lived isotopes 22Na, 24Na,
52Mn, and 57Ni in COMPTEL supports the conclusion that
activation occurs predominantly during SAA passages. On average, CGRO
passes through the SAA 6-8 times each day. In 1991 (at solar maximum
and hence at minimum SAA-proton flux) the daily average of the
incident flux of SAA protons with
![]() MeV was about
38 times higher than the corresponding incident galactic cosmic-ray
proton flux (Dyer et al. 1994), illustrating the
importance of SAA passages with respect to the total deposited
radiation dose. The SAA-proton flux varies strongly with altitude and
solar cycle. For example, during its mission the altitude of CGRO
ranged from 350-500 km, which corresponds to a variation of the
SAA-proton flux of a factor
MeV was about
38 times higher than the corresponding incident galactic cosmic-ray
proton flux (Dyer et al. 1994), illustrating the
importance of SAA passages with respect to the total deposited
radiation dose. The SAA-proton flux varies strongly with altitude and
solar cycle. For example, during its mission the altitude of CGRO
ranged from 350-500 km, which corresponds to a variation of the
SAA-proton flux of a factor ![]() 10, while the solar activity
results in a variation by a factor
10, while the solar activity
results in a variation by a factor ![]() 2 at these altitudes
(Stassinopoulos 1989). According to our activity
model (Varendorff et al. 1997) the anisotropy of the
SAA-proton flux at low satellite altitudes (Watts et al. 1989) has an important effect on the radiation
dose and hence on activation. These findings are consistent with
earlier studies of GRS-SMM instrumental lines, in which activation due
to (anisotropic) radiation-belt protons during SAA transits has been
identified as major source of (long-lived) line background and its
variation with time (see Kurfess et al. 1989;
Share et al. 1989, and references therein).
2 at these altitudes
(Stassinopoulos 1989). According to our activity
model (Varendorff et al. 1997) the anisotropy of the
SAA-proton flux at low satellite altitudes (Watts et al. 1989) has an important effect on the radiation
dose and hence on activation. These findings are consistent with
earlier studies of GRS-SMM instrumental lines, in which activation due
to (anisotropic) radiation-belt protons during SAA transits has been
identified as major source of (long-lived) line background and its
variation with time (see Kurfess et al. 1989;
Share et al. 1989, and references therein).
In contrast, the activities of short-lived isotopes are mostly determined by the incident primary cosmic-ray and albedo-neutron fluxes. The enhanced production of these isotopes during SAA transits is of little importance for their background contribution outside the SAA, where astrophysical data are recorded, because of their rapid decay, which precludes build-up.
Two strategies for reducing instrumental line background in future
low-energy ![]() -ray detectors due to activation of long-lived isotopes
present themselves. First, care should be taken to avoid detector
materials which are easily activated by SAA protons (such as aluminium) or
which carry primordial radioactivity. Second, instruments should be
placed in orbits that minimize radiation-belt proton dosage, such as
a low-altitude equatorial orbit below the radiation belts
and outside the SAA, or a high-altitude orbit above the radiation
belts (as scheduled for the INTEGRAL observatory).
The flux of (low-energy) cosmic rays is significantly
lower in a low-altitude orbit as compared to a high-altitude orbit
- at the cost of a much higher albedo-neutron flux.
Another strategy for limiting the impact of remaining instrumental
lines in future instruments is, e.g., to exploit the expected
improvement in energy resolution to identify (and model) a large
number of instrumental background components. A comprehensive
treatment of the implications of the COMPTEL instrumental line (and
continuum) background for future Compton telescopes is beyond the
scope of this paper and will be given in a separate publication.
-ray detectors due to activation of long-lived isotopes
present themselves. First, care should be taken to avoid detector
materials which are easily activated by SAA protons (such as aluminium) or
which carry primordial radioactivity. Second, instruments should be
placed in orbits that minimize radiation-belt proton dosage, such as
a low-altitude equatorial orbit below the radiation belts
and outside the SAA, or a high-altitude orbit above the radiation
belts (as scheduled for the INTEGRAL observatory).
The flux of (low-energy) cosmic rays is significantly
lower in a low-altitude orbit as compared to a high-altitude orbit
- at the cost of a much higher albedo-neutron flux.
Another strategy for limiting the impact of remaining instrumental
lines in future instruments is, e.g., to exploit the expected
improvement in energy resolution to identify (and model) a large
number of instrumental background components. A comprehensive
treatment of the implications of the COMPTEL instrumental line (and
continuum) background for future Compton telescopes is beyond the
scope of this paper and will be given in a separate publication.
Finally, although investigations of background lines are of interest in their own right, they are ultimately motivated by the struggle to eliminate background events in astrophysical analyses. The COMPTEL instrumental background lines, particularly those from long-lived isotopes, are a concern below about 4 MeV. At these energies detailed understanding of the dataspace structure and variability of the instrumental lines is indispensable for optimizing many astrophysical investigations, such as that of the cosmic diffuse gamma-ray background (see e.g. Kappadath et al. 2000; Weidenspointner et al. 2001) or of the galactic 1.8 MeV line emission from 26Al (see e.g. Oberlack 1997; Plüschke et al. 2000).
Comparing event rates due to ![]() -ray line sources and due to
instrumental background it is evident that source fluxes cannot be
derived from global event rates with COMPTEL. This is only possible in
imaging analysis, which exploits the characteristic cone-like
distribution of source events in a three-dimensional data space spanned by
the scatter angle
-ray line sources and due to
instrumental background it is evident that source fluxes cannot be
derived from global event rates with COMPTEL. This is only possible in
imaging analysis, which exploits the characteristic cone-like
distribution of source events in a three-dimensional data space spanned by
the scatter angle
![]() and the direction (zenith and
azimuth) of the scattered photon (see Schönfelder et al. 1993). Instrumental background components
exhibit comparatively smooth distributions in this data space,
allowing for their separation from the signal. Further exploitation of
existing knowledge on the dataspace structure of instrumental lines
will remedy some of the difficulties in the search for
astrophysical
and the direction (zenith and
azimuth) of the scattered photon (see Schönfelder et al. 1993). Instrumental background components
exhibit comparatively smooth distributions in this data space,
allowing for their separation from the signal. Further exploitation of
existing knowledge on the dataspace structure of instrumental lines
will remedy some of the difficulties in the search for
astrophysical ![]() -ray lines (see e.g. Morris et al. 1997b). Nevertheless, data
selections that increase the signal-to-background ratio are clearly of
great value.
-ray lines (see e.g. Morris et al. 1997b). Nevertheless, data
selections that increase the signal-to-background ratio are clearly of
great value.
The importance of instrumental background suppression/rejection can be illustrated with the original report of nuclear de-excitation lines from the Orion region (Bloemen et al. 1994), which would have corresponded to an event rate of about 6 10-4 s-1 spread over a rather broad energy range of 3-7 MeV. As was recognized in our recent analyses, the variations in the 24Na event rate over the different observation periods of this galactic region are capable of producing spatial inhomogeneities in the background of that order, which then can be falsely attributed to a celestial signal. Only correlations of the supposed Orion signal with data space domains where 24Na contamination is strongest provided the hints to suspect an instrumental background artifact as the origin of the claimed detection (Bloemen et al. 1999).
Acknowledgements
It is a pleasure to acknowledge laboratory efforts of J. Macri, and of R. Georgii, C. Wunderer, and W. Plass in measuring primordial radioactivity in D1 PMTs. We are also pleased to acknowledge work on hadron simulations for estimating activation of spacecraft materials by P. Jean. The COMPTEL project is supported by the German government through DARA grant 50 QV 90968, by NASA under contract NAS5-26645, and by The Netherlands Organization for Scientific Research NWO.
The results on the COMPTEL instrumental lines given in the main body of this paper have been derived using two different sets of event selections, described below.
In the COMPTEL analysis of the cosmic diffuse gamma-ray background
(CDG), the intense atmospheric ![]() -ray background is eliminated
by selecting data from times when the Earth was sufficiently far
outside a circular field-of-view defined by event selections. Detailed
descriptions of these selections can be found in, e.g., Kappadath
(1998) and Weidenspointner
(1999).
-ray background is eliminated
by selecting data from times when the Earth was sufficiently far
outside a circular field-of-view defined by event selections. Detailed
descriptions of these selections can be found in, e.g., Kappadath
(1998) and Weidenspointner
(1999).
The standard set of CDG event selections used in this paper are as follows:
In COMPTEL imaging analyses such as that of the 26Al 1.8 MeV
line emission from the galaxy, ![]() -ray albedo photons from the
Earth's atmosphere are rejected by determining for each event the
minimal angular distance between its possible origins in the sky and
the Earth horizon. This angular distance, denoted
-ray albedo photons from the
Earth's atmosphere are rejected by determining for each event the
minimal angular distance between its possible origins in the sky and
the Earth horizon. This angular distance, denoted ![]() below, is
required to exceed a minimum value (see e.g. Schönfelder et
al. 1993). Hence, the effective field-of-view
in imaging analysis changes with time as the instrument orbits the
Earth.
below, is
required to exceed a minimum value (see e.g. Schönfelder et
al. 1993). Hence, the effective field-of-view
in imaging analysis changes with time as the instrument orbits the
Earth.
The standard set of imaging event selections used in this paper are as
follows:
Many astrophysical analyses, such as that of the cosmic diffuse
gamma-ray background (CDG), of the galactic 1.8 MeV line emission
from 26Al, or of ![]() -ray line emission from supernovae, can be
optimized by detailed modelling of the instrumental line
background. Below, the (similar) procedures used to determine the
background event rates due to individual isotopes employed by
Weidenspointner et al. (2001); Oberlack
(1997) and Plüschke et al. (2000) in investigations of the CDG
-ray line emission from supernovae, can be
optimized by detailed modelling of the instrumental line
background. Below, the (similar) procedures used to determine the
background event rates due to individual isotopes employed by
Weidenspointner et al. (2001); Oberlack
(1997) and Plüschke et al. (2000) in investigations of the CDG![]() and of the 26Al emission,
respectively, are described.
and of the 26Al emission,
respectively, are described.
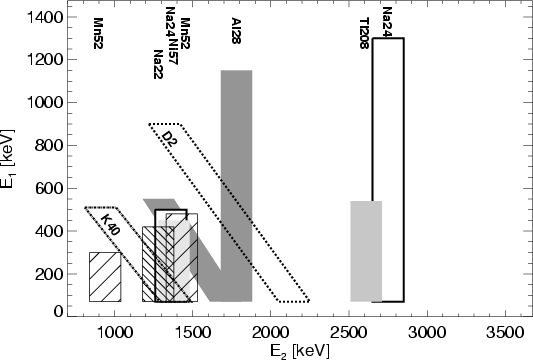 |
Figure B.1: A schematic representation of the simulated E1-E2 distributions of the eight isotopes identified in the instrumental line background for CDG event selections. The "vertical'' and "diagonal'' bands represent multiple photon and single photon events, respectively (compare to the detailed individual diagrams in Sect. 4) |
Accounting for the event rates due to the instrumental line
background, in particular its long-lived components, is important for
measuring the CDG at MeV energies (e.g. Kappadath et al. 2000; Weidenspointner et al. 2001). As explained above, the background
contributions of long-lived isotopes have to be subtracted before
prompt and short-lived backgrounds can be eliminated by veto rate
extrapolation. The event rates due to the eight identified background
isotopes producing the major instrumental lines are determined, as a
function of veto rate, in an iterative procedure by fitting a set of
three E2 spectra and one
![]() spectrum for
each veto rate interval
spectrum for
each veto rate interval![]() .
.
The rationale of the iterative fitting procedure is illustrated in
Figs. B.1 and
B.2. The
E1-E2 distributions of the eight isotopes as
obtained from Monte Carlo simulations are schematically depicted for
CDG event selections in
Fig. B.1. In general, there
is considerable overlap in the
E1-E2distributions of individual isotopes (in particular around 1.3 MeV in
E2), which precludes an independent determination of the
isotopes' background contributions.
Therefore, an iterative procedure was introduced, which starts at the
highest energies in E1 and E2, where
ambiguities are minimal, and then proceeds down to the increasingly
complex structures at lower E1 and E2energies. The
E1-E2 ranges of the three
E2 spectra and the
![]() spectrum, chosen such
as to enhance or suppress individual lines or spectral features, are
indicated in Fig. B.2. The
E1-E2 ranges covered by the second and third
E2 fit and by the
spectrum, chosen such
as to enhance or suppress individual lines or spectral features, are
indicated in Fig. B.2. The
E1-E2 ranges covered by the second and third
E2 fit and by the
![]() fit overlap, hence the
results of these fits are not statistically independent. The overlap
is caused by the
fit overlap, hence the
results of these fits are not statistically independent. The overlap
is caused by the
![]() fit, which was introduced to
properly separate the background events from 2D and
28Al. Inclusion or omission of the
fit, which was introduced to
properly separate the background events from 2D and
28Al. Inclusion or omission of the
![]() fit therefore
is a trade-off between systematic and statistical uncertainty. By
iteratively fitting the second and third E2 spectrum and
the
fit therefore
is a trade-off between systematic and statistical uncertainty. By
iteratively fitting the second and third E2 spectrum and
the
![]() spectrum, both the systematic and the statistical
uncertainty in the 2D and 28Al event rates are minimized
(other isotopes are hardly affected by the overlap, see below). In
additon, the iterative approach ensures the self-consistency of the
determined isotope background contributions.
Also included in Fig. B.2 are
lines of constant
spectrum, both the systematic and the statistical
uncertainty in the 2D and 28Al event rates are minimized
(other isotopes are hardly affected by the overlap, see below). In
additon, the iterative approach ensures the self-consistency of the
determined isotope background contributions.
Also included in Fig. B.2 are
lines of constant
![]() and
and
![]() .
Comparison of
Figs. B.1 and
B.2 provides a first
indication of the many options for fitting individual lines, which can
be enhanced or suppressed through the choice of the fit regions, and
in addition through selections on
.
Comparison of
Figs. B.1 and
B.2 provides a first
indication of the many options for fitting individual lines, which can
be enhanced or suppressed through the choice of the fit regions, and
in addition through selections on
![]() and/or
and/or
![]() .
In
particular, event selections may be used to suppress unidentified,
long-lived spectral features, which cannot be eliminated by veto rate
extrapolation (see Kappadath et al. 2000;
Weidenspointner et al. 2001).
.
In
particular, event selections may be used to suppress unidentified,
long-lived spectral features, which cannot be eliminated by veto rate
extrapolation (see Kappadath et al. 2000;
Weidenspointner et al. 2001).
The
E1-E2 ranges of the three E2spectra and the
![]() spectrum indicated in
Fig. B.2 were chosen for the
iterative fitting procedure for the following reasons.
The first E2 spectrum, covering the
E1-E2region of 950-1250 keV in E1 and 2000-3500 keV in E2(see Figs. B.1 and
B.2), allows us to determine the
event rate from 24Na. The signal from this isotope is optimized
by selecting E1 energies around the Compton edge of the 1.37 MeV
photon interacting in D1 and around the photopeak of the 2.75 MeV
photon interacting in D2 (see Fig. 5).
The 2D event rate is determined from fitting the
spectrum indicated in
Fig. B.2 were chosen for the
iterative fitting procedure for the following reasons.
The first E2 spectrum, covering the
E1-E2region of 950-1250 keV in E1 and 2000-3500 keV in E2(see Figs. B.1 and
B.2), allows us to determine the
event rate from 24Na. The signal from this isotope is optimized
by selecting E1 energies around the Compton edge of the 1.37 MeV
photon interacting in D1 and around the photopeak of the 2.75 MeV
photon interacting in D2 (see Fig. 5).
The 2D event rate is determined from fitting the
![]() spectrum (
spectrum (
![]() 1810-2800 keV, E1 70-950 keV,
and E2 730-2800 keV, see
Figs. B.1 and
B.2). The second
E2 spectrum (E1 500-950 keV, E21500-3500 keV, see Figs. B.1
and B.2) is used to determine
the event rate from 28Al. Finally, the third E2spectrum is intended for determining the background contributions from
the
1810-2800 keV, E1 70-950 keV,
and E2 730-2800 keV, see
Figs. B.1 and
B.2). The second
E2 spectrum (E1 500-950 keV, E21500-3500 keV, see Figs. B.1
and B.2) is used to determine
the event rate from 28Al. Finally, the third E2spectrum is intended for determining the background contributions from
the ![]() -decays of 22Na, 52Mn, and 57Ni, with the
270-350 keV range in E1 being optimized for the Compton
edge of 511 keV photons, and the E2 range covering the
energies 1100-3500 keV (see
Figs. B.1 and
B.2).
To optimize the signal of the instrumental lines, which originate in
the D1 detector material, a ToF range of 2.5-7.5 ns was
selected for the spectra (compare Fig. 3).
-decays of 22Na, 52Mn, and 57Ni, with the
270-350 keV range in E1 being optimized for the Compton
edge of 511 keV photons, and the E2 range covering the
energies 1100-3500 keV (see
Figs. B.1 and
B.2).
To optimize the signal of the instrumental lines, which originate in
the D1 detector material, a ToF range of 2.5-7.5 ns was
selected for the spectra (compare Fig. 3).
The three E2 spectra and the
![]() spectrum are
analyzed in an iterative procedure consisting of eight fits, listed
below. The contributions from the primordial radio-nuclides 40K
and 208Tl are not determined from the fits, but calculated from
their known (40K, see Sect. 4.3) or estimated (208Tl,
see Sect. 4.7) activities based on Monte Carlo
simulations. Similarly, once the background contribution of an isotope
has been determined from any spectrum, the isotope's contribution to
any other spectrum can be predicted based on Monte Carlo simulations.
The eight identified isotopes can account for the major instrumental
lines, however, some weak lines or spectral features remain
unidentified at this time. In the fits, some of these unidentified
lines were described by Gaussians to minimize systematic errors in the
determination of the event rates of the identified components. The
unidentified components are genuinely different from those identified
since their variation with cosmic-ray intensity, as well as their
dependence on event parameter selections, are different (see Kappadath
et al. 2000; Weidenspointner et al. 2001).
The identified isotopes are represented by templates obtained from
Monte Carlo simulation. These templates have not been smoothed
as smoothing inevitably increases the systematic uncertainty due to
distortions of the template shape. The small "spikes'' in the
templates in Figs. B.3-B.6 are
an artifact of the plotting software.
The eight fit steps are:
spectrum are
analyzed in an iterative procedure consisting of eight fits, listed
below. The contributions from the primordial radio-nuclides 40K
and 208Tl are not determined from the fits, but calculated from
their known (40K, see Sect. 4.3) or estimated (208Tl,
see Sect. 4.7) activities based on Monte Carlo
simulations. Similarly, once the background contribution of an isotope
has been determined from any spectrum, the isotope's contribution to
any other spectrum can be predicted based on Monte Carlo simulations.
The eight identified isotopes can account for the major instrumental
lines, however, some weak lines or spectral features remain
unidentified at this time. In the fits, some of these unidentified
lines were described by Gaussians to minimize systematic errors in the
determination of the event rates of the identified components. The
unidentified components are genuinely different from those identified
since their variation with cosmic-ray intensity, as well as their
dependence on event parameter selections, are different (see Kappadath
et al. 2000; Weidenspointner et al. 2001).
The identified isotopes are represented by templates obtained from
Monte Carlo simulation. These templates have not been smoothed
as smoothing inevitably increases the systematic uncertainty due to
distortions of the template shape. The small "spikes'' in the
templates in Figs. B.3-B.6 are
an artifact of the plotting software.
The eight fit steps are:
The analysis of the galactic 1.8 MeV line emission from 26Al
is, similar to that of the CDG, affected by the instrumental line
background and its temporal variation. The galactic 1.8 MeV line
emission is determined in the energy band 1.7-1.9 MeV, using
adjacent energy bands for constructing a model for the
background in this so-called line interval (comprehensive
descriptions of this approach can be found in, e.g., Knödlseder
1997 & Oberlack 1997). In
particular, the scatter angle
![]() distribution of the
1.7-1.9 MeV background model is derived from an
interpolation of the
distribution of the
1.7-1.9 MeV background model is derived from an
interpolation of the
![]() distributions in narrow adjacent
energy intervals (1.6-1.7 MeV and 1.9-2.0 MeV). Due to the
long-term variation of the instrumental line background (see e.g. Fig. 8), the ratio of the number of counts in
the line interval and in the adjacent energy intervals is decreasing
with time (see Fig. B.7), mostly due to the
build-up of 22Na, a major component in the 1.6-1.7 MeV band
in
distributions in narrow adjacent
energy intervals (1.6-1.7 MeV and 1.9-2.0 MeV). Due to the
long-term variation of the instrumental line background (see e.g. Fig. 8), the ratio of the number of counts in
the line interval and in the adjacent energy intervals is decreasing
with time (see Fig. B.7), mostly due to the
build-up of 22Na, a major component in the 1.6-1.7 MeV band
in
![]() (Oberlack 1997). To eliminate the
time dependent contamination of the background reference from adjacent
energies, the number of counts due to each component of the
instrumental line background has to be determined for each individual
observation period, employing a procedure outlined below. After
subtraction of the instrumental line background, the ratio of counts
in the line interval and the adjacent energy intervals to a good
approximation is constant in time (see
Fig. B.7), and data from individual observation
periods can be summed to analyze the galactic 1.8 MeV line emission.
(Oberlack 1997). To eliminate the
time dependent contamination of the background reference from adjacent
energies, the number of counts due to each component of the
instrumental line background has to be determined for each individual
observation period, employing a procedure outlined below. After
subtraction of the instrumental line background, the ratio of counts
in the line interval and the adjacent energy intervals to a good
approximation is constant in time (see
Fig. B.7), and data from individual observation
periods can be summed to analyze the galactic 1.8 MeV line emission.
The procedure used in the 26Al analysis to determine the
background contributions of the eight identified background isotopes
is a modified version of the CDG procedure described in
Appendix B.1. The modifications are motivated by
differences in the event selections applied in the two analyses,
particularly differences in the elimination of atmospheric background
(see Appendix A.1 and
A.2). One of the consequences is that in
the 26Al imaging analysis events with larger
![]() values are accepted than in the CDG analysis. For some isotopes,
notably 24Na, this results in significant changes of the
E1-E2 distribution as compared to that for CDG
event selections. Consequently, the optimal fit regions in
E1-E2 space are somewhat different. Also, in
contrast to the CDG analysis, in the 26Al analysis the
values are accepted than in the CDG analysis. For some isotopes,
notably 24Na, this results in significant changes of the
E1-E2 distribution as compared to that for CDG
event selections. Consequently, the optimal fit regions in
E1-E2 space are somewhat different. Also, in
contrast to the CDG analysis, in the 26Al analysis the
![]() distribution of the accepted events is different for
each observation period due to the orbit dependent rejection of
atmospheric background. The simulated energy distributions for each
background isotope therefore have to be corrected for the specific
distribution of the accepted events is different for
each observation period due to the orbit dependent rejection of
atmospheric background. The simulated energy distributions for each
background isotope therefore have to be corrected for the specific
![]() distribution of each individual observation period
(Oberlack 1997).
The correction for selections to reject atmospheric background has
been calculated assuming a homogeneous illumination of the D1
detector. Since there is a certain edge enhancement in the
illumination of the D1 modules for background produced in the D1
structure, slight differences in these corrections result in small
distortions of the templates, and thus add to the observed scatter in
the determined isotope event rates (see
Fig. 8).
As each observation period is independently analyzed for its
instrumental line background contamination, the background modelling
in the 26Al analysis yields as a welcome by-product the
long-term variation of the event rates due to the eight identified
background isotopes depicted in Fig. 8.
distribution of each individual observation period
(Oberlack 1997).
The correction for selections to reject atmospheric background has
been calculated assuming a homogeneous illumination of the D1
detector. Since there is a certain edge enhancement in the
illumination of the D1 modules for background produced in the D1
structure, slight differences in these corrections result in small
distortions of the templates, and thus add to the observed scatter in
the determined isotope event rates (see
Fig. 8).
As each observation period is independently analyzed for its
instrumental line background contamination, the background modelling
in the 26Al analysis yields as a welcome by-product the
long-term variation of the event rates due to the eight identified
background isotopes depicted in Fig. 8.
The four steps of the iterative line fitting procedure in the
26Al analysis are similar to those in the CDG analysis, hence we
content ourselves with describing only the differences. In the first
step, two
E1-E2 regions are fitted
simultaneously to obtain the 24Na event rate (Oberlack
1997): the
E1-E2 region
depicted in Fig. B.2, and an
additional
E1-E2 region extending from 2000 to
2700 keV in E1 and from 1100 to 2000 keV in
E2. Analogous to the first
E1-E2region, the additional
E1-E2 region optimizes
the 24Na signal from simultaneous interactions of the 1.37 MeV
and 2.75 MeV photons in D2 and D1, respectively, which are no longer
suppressed due to the larger accepted
![]() values for
imaging selections. The
E1-E2 region for the
second step extends down to 700 keV in E1, and is used for
determining the 28Al rate and for obtaining start parameters to
determine the event rates of the remaining isotopes, particularly
22Na, in Fit 3. However, unlike in the CDG analysis, the
contributions of the primordial isotopes 40K and 208Tl are
not fixed in the 26Al analysis, but determined in Fit 3 and 1,
respectively. As far as determining the contributions of each
individual isotope is concerned, the procedure ends here, since it has
been demonstrated in the CDG analysis that one fit cycle is sufficient
to obtain self-consistent isotope rates. This advanced background
treatment provided the basis for the latest COMPTEL 26Al all-sky
maps (e.g. Oberlack 1997; Plüschke et al. 2000).
values for
imaging selections. The
E1-E2 region for the
second step extends down to 700 keV in E1, and is used for
determining the 28Al rate and for obtaining start parameters to
determine the event rates of the remaining isotopes, particularly
22Na, in Fit 3. However, unlike in the CDG analysis, the
contributions of the primordial isotopes 40K and 208Tl are
not fixed in the 26Al analysis, but determined in Fit 3 and 1,
respectively. As far as determining the contributions of each
individual isotope is concerned, the procedure ends here, since it has
been demonstrated in the CDG analysis that one fit cycle is sufficient
to obtain self-consistent isotope rates. This advanced background
treatment provided the basis for the latest COMPTEL 26Al all-sky
maps (e.g. Oberlack 1997; Plüschke et al. 2000).
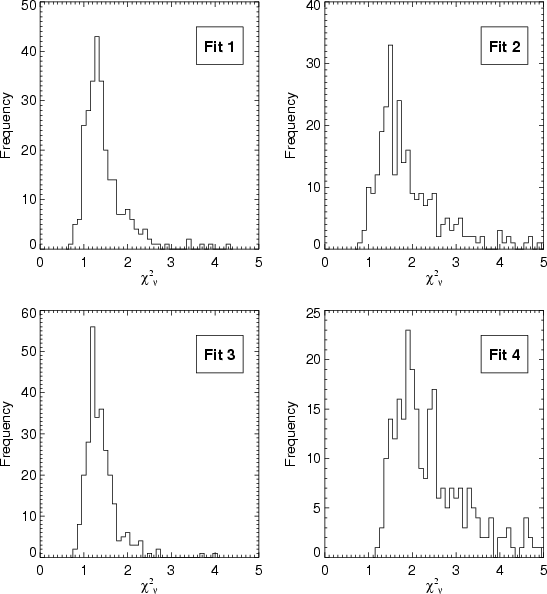 |
Figure B.9:
The distribution of the
|
To investigate the extent to which the identified isotopes can account
for spectral features in
![]() ,
an additional fit is
performed (see Fig. B.8). In this
,
an additional fit is
performed (see Fig. B.8). In this
![]() fit (
E1 > 70 keV,
E2 > 650 keV), the
contributions from the eight background isotopes are fixed at the
values obtained from the three previous E2 fits; only the
continuum background, modelled by a power law with an exponential
turn-over at low energies, is varied. As can be seen, the major
spectral features are accounted for by the eight identified isotopes,
however, some minor features remain unidentified at this time.
fit (
E1 > 70 keV,
E2 > 650 keV), the
contributions from the eight background isotopes are fixed at the
values obtained from the three previous E2 fits; only the
continuum background, modelled by a power law with an exponential
turn-over at low energies, is varied. As can be seen, the major
spectral features are accounted for by the eight identified isotopes,
however, some minor features remain unidentified at this time.
The distribution of the
![]() values for each of the four fit
steps, as obtained in the analysis of Plüschke et al. (2000), is shown in Fig. B.9. The
quality of Fits 1 and 3, in which the event rates of most of the
background isotopes are determined, is acceptable. The
values for each of the four fit
steps, as obtained in the analysis of Plüschke et al. (2000), is shown in Fig. B.9. The
quality of Fits 1 and 3, in which the event rates of most of the
background isotopes are determined, is acceptable. The
![]() distribtion for the
distribtion for the
![]() fit, however, indicates that further
improvement of the instrumental line background modelling is still
possible.
fit, however, indicates that further
improvement of the instrumental line background modelling is still
possible.