For the interpretation of the velocity profiles, it is important to keep in mind that the spectra have been taken along slits parallel and perpendicular to the nuclear bars (respectively named Slit1 and Slit2 hereafter). The major and minor axis of the galaxies do not coincide with that of the bars, so that we do expect some rotation along both axis, due to the inclination effect. The various position angles and inclinations are displayed in Table 1.
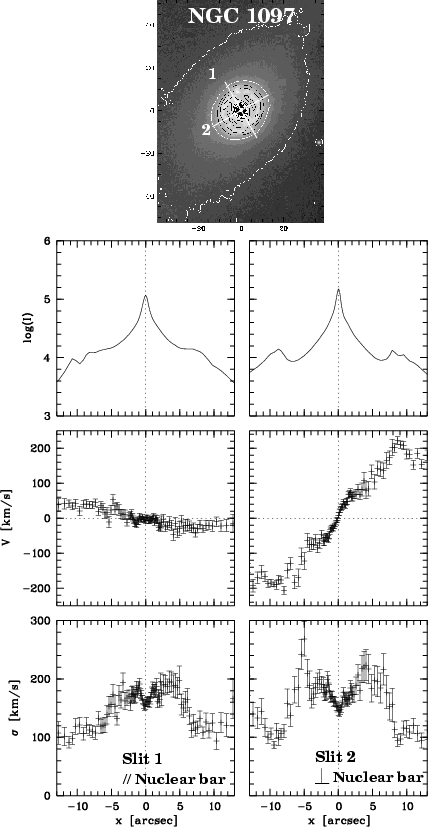 |
Figure 2:
Kinematical profiles of NGC 1097.
From top to bottom: NIR image of the galaxy centre (North is up, East is left),
indicating the
positions and lengths of the two slits, parallel and perpendicular to the nuclear bar
(the labels 1 and 2 overimposed on the image indicate positive abscissa);
luminosity profiles (in log) along the two slits;
velocity and dispersion profiles with error bars representing
|
The velocity profile along Slit1 is quite flat, reflecting the fact that
it is nearly perpendicular to the kinematical line of nodes
(which we assume to be given by the major-axis
photometric position angle of the outer disc of the galaxy). The global shape of the
rotation curve along Slit2 roughly resembles the H![]() velocity curve
derived (along a position angle of
velocity curve
derived (along a position angle of
![]() )
by Storchi-Bergmann et
al. (1996). The maximum stellar velocity along Slit2
(
)
by Storchi-Bergmann et
al. (1996). The maximum stellar velocity along Slit2
(
![]()
![]() 210 km
210 km![]() s-1) is reached in the
circumnuclear ring, similarly to the ionised gas for which Storchi-Bergmann et al. (1996) measures maxima of
s-1) is reached in the
circumnuclear ring, similarly to the ionised gas for which Storchi-Bergmann et al. (1996) measures maxima of
![]() [H
[H![]() ]
]
![]() km
km![]() s-1.
We thus measure a roughly constant stellar velocity gradient of
s-1.
We thus measure a roughly constant stellar velocity gradient of ![]() 290 km
290 km![]() s-1kpc-1. Our good spatial resolution however allows to reveal a richer
velocity structure. Inside
s-1kpc-1. Our good spatial resolution however allows to reveal a richer
velocity structure. Inside
![]() ,
the velocity profile along
Slit2 exhibits an S-shape with nearly flat ends.
Those plateaus in the velocity correspond to maxima in the
dispersion profile (
,
the velocity profile along
Slit2 exhibits an S-shape with nearly flat ends.
Those plateaus in the velocity correspond to maxima in the
dispersion profile (
![]() km
km![]() s-1), whereas the inner part is
characterised by a quite surprising drop in the dispersion (down to
s-1), whereas the inner part is
characterised by a quite surprising drop in the dispersion (down to
![]() km
km![]() s-1 at the centre).
Velocities increase almost linearly from a radius of
s-1 at the centre).
Velocities increase almost linearly from a radius of
![]() reaching a maximum near the edge of the circumnuclear ring at
reaching a maximum near the edge of the circumnuclear ring at ![]()
![]() ,
where they then starts to decrease. Outside
,
where they then starts to decrease. Outside
![]() ,
the dispersion decreases
outwards down to
,
the dispersion decreases
outwards down to ![]() 95 km
95 km![]() s-1. Note that the dispersion
drop and local maxima in the dispersion are also present along Slit1.
s-1. Note that the dispersion
drop and local maxima in the dispersion are also present along Slit1.
NGC 1365, Seyfert 1,
![]() pc:
The Seyfert 1 nucleus of NGC 1365 dominates the light
in the central arcsecond, and thus strongly dilutes the absorption 12CO
bandhead: this prevented us to derive any meaningful kinematics in
this region. We will deal here only with the profiles outward
pc:
The Seyfert 1 nucleus of NGC 1365 dominates the light
in the central arcsecond, and thus strongly dilutes the absorption 12CO
bandhead: this prevented us to derive any meaningful kinematics in
this region. We will deal here only with the profiles outward
![]() .
.
Like in NGC 1097, the flatness of the velocity profile along Slit 2 is
a consequence of the slit orientation with respect to the line of
nodes. The central kpc morphology of this galaxy is disturbed by an
intense star formation (see Lindblad
1999 for a review on this object). It is thus
difficult to see the signature of the bar in the luminosity
profile. Ellipse fitting on H-band isophotes provided by
Jungwiert et al. (1997) gave a rough estimate of the extent
of the presumed secondary bar: ![]()
![]() .
However, high resolution near-infrared images
of the central region of NGC 1365 recently obtained with NICMOS/HST, and
the VLT (ISAAC and FORS1) suggest that the ellipticity of the component
detected in the central 10
.
However, high resolution near-infrared images
of the central region of NGC 1365 recently obtained with NICMOS/HST, and
the VLT (ISAAC and FORS1) suggest that the ellipticity of the component
detected in the central 10
![]() is solely due to the inclination
of the galaxy (the photometric major-axis being thus coincident with
the line of nodes). There are therefore no evidence left for the
presence of a nuclear bar. We then simply interpret the observed
flattened system in the centre as a nuclear disc, well circumvented by a ring-like
(and spiral arm) structure at a radius of
is solely due to the inclination
of the galaxy (the photometric major-axis being thus coincident with
the line of nodes). There are therefore no evidence left for the
presence of a nuclear bar. We then simply interpret the observed
flattened system in the centre as a nuclear disc, well circumvented by a ring-like
(and spiral arm) structure at a radius of ![]()
![]() .
Inside
this radius, the velocity increases up to its
maximum value (
.
Inside
this radius, the velocity increases up to its
maximum value (
![]() km
km![]() s-1 at
s-1 at
![]() )
with a steep gradient (
)
with a steep gradient (![]() km
km![]() s-1kpc-1), and then remains
roughly constant until the end of the disc. The dispersion along both axis
shows no clear structure: it remains nearly constant inside the nuclear disc
with a mean
s-1kpc-1), and then remains
roughly constant until the end of the disc. The dispersion along both axis
shows no clear structure: it remains nearly constant inside the nuclear disc
with a mean
![]() km
km![]() s-1. There may be a slight increase
outwards up to
s-1. There may be a slight increase
outwards up to
![]() km
km![]() s-1, but this is within the
error bars.
s-1, but this is within the
error bars.
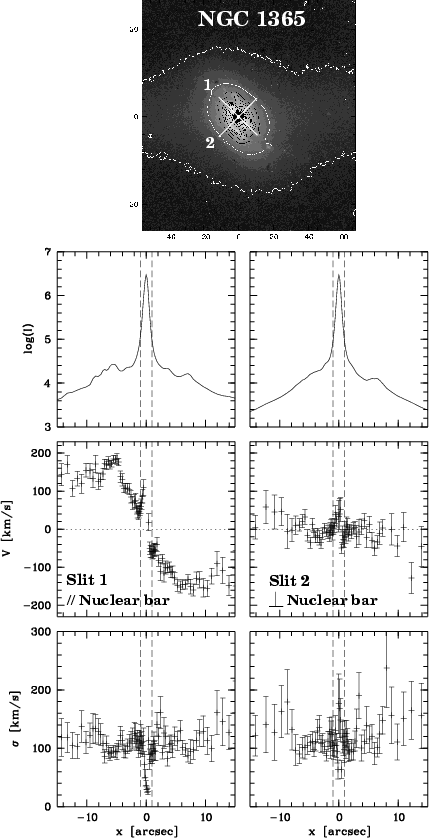 |
Figure 3: Same as Fig. 2 for NGC 1365. The light in the central arcsecond (region marked by the vertical dashed lines) is completely dominated by the non-thermal contribution of the Seyfert 1 nucleus, thus preventing us to derive any meaningful kinematics in this region |
NGC 1808, Seyfert 2,
![]() pc:
The central kpc of this galaxy, disturbed by "hot spots'' of star
formation (e.g. Kotilainen et al. 1996), is the brightest of
our sample in the K-band, hence providing the nicest kinematic profiles.
Again, we estimate the nuclear bar length to be
pc:
The central kpc of this galaxy, disturbed by "hot spots'' of star
formation (e.g. Kotilainen et al. 1996), is the brightest of
our sample in the K-band, hence providing the nicest kinematic profiles.
Again, we estimate the nuclear bar length to be ![]()
![]() from Jungwiert et al. (1997), with an axis ratio
around 0.5. The velocity profiles along both axis
show an increase up to the end of the nuclear bar and then a decrease.
Slit1 velocity profile is significantly asymmetric with respect
to the systemic velocity outside
from Jungwiert et al. (1997), with an axis ratio
around 0.5. The velocity profiles along both axis
show an increase up to the end of the nuclear bar and then a decrease.
Slit1 velocity profile is significantly asymmetric with respect
to the systemic velocity outside
![]() ,
with
,
with
![]() km
km![]() s-1 and
s-1 and
![]() km
km![]() s-1:
this asymmetry is also clearly present
in the surface brighness profile (Fig. 5) but
does not appear in the dispersion curve.
s-1:
this asymmetry is also clearly present
in the surface brighness profile (Fig. 5) but
does not appear in the dispersion curve.
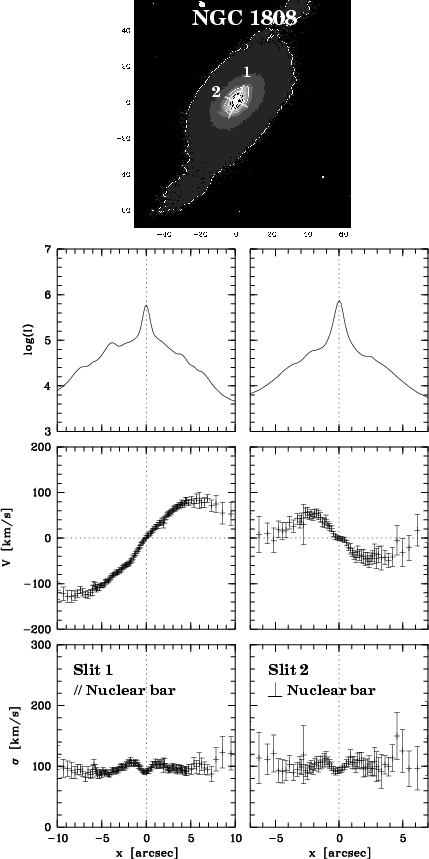 |
Figure 4: Same as Fig. 2 for NGC 1808 |
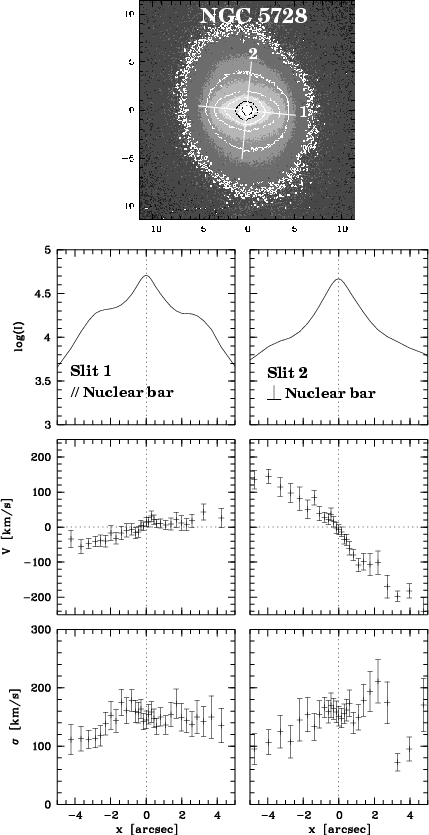 |
Figure 6: Same as Fig. 2 for NGC 5728. Note the different spatial extent of the major and minor axis plots |
NGC 5728, Seyfert 2,
![]() pc:
NGC 5728 is the faintest galaxy in our sample, however the signal-to-noise
is enough to have a good measure of the velocity profiles in the central 5
pc:
NGC 5728 is the faintest galaxy in our sample, however the signal-to-noise
is enough to have a good measure of the velocity profiles in the central 5
![]() .
Once again, there are clear signatures of a decoupled dynamical component in the
central kinematics. The maximum velocity gradient is observed along
Slit2 as expected from the position angle of the line of nodes
(see Table 1), similarly to the case of NGC 1097.
Slit1 for NGC 5728 is very close to the slit used
by Prada & Gutierrez (1999, hereafter PG99; PA
.
Once again, there are clear signatures of a decoupled dynamical component in the
central kinematics. The maximum velocity gradient is observed along
Slit2 as expected from the position angle of the line of nodes
(see Table 1), similarly to the case of NGC 1097.
Slit1 for NGC 5728 is very close to the slit used
by Prada & Gutierrez (1999, hereafter PG99; PA
![]() ),
our velocity profile being consistent with theirs.
The velocity and velocity dispersion profiles are slightly asymmetric
along both slits. The K band surface brightness profile
also exhibits an asymmetry along Slit1 at the edge of the nuclear bar.
There is a dip in the dispersion profiles of NGC 5728,
with a central value of 147 km
),
our velocity profile being consistent with theirs.
The velocity and velocity dispersion profiles are slightly asymmetric
along both slits. The K band surface brightness profile
also exhibits an asymmetry along Slit1 at the edge of the nuclear bar.
There is a dip in the dispersion profiles of NGC 5728,
with a central value of 147 km![]() s-1, although it is less convincing than in the cases
of NGC 1097 and NGC 1808. This value is slightly smaller than but within the error bar of
the one derived by PG99. We do not detect any double component in our LOSVDs,
in apparent contradiction with the data of PG99. We observe
a high excitation [Ca VIII] emission line, burried within the second 12CO absorption
feature. The emitting region is restricted to the central spectra, and is consistent
with an unresolved point-like source, thus certainly linked with the AGN.
This point will be examined in details in a forthcoming paper (Paper II).
s-1, although it is less convincing than in the cases
of NGC 1097 and NGC 1808. This value is slightly smaller than but within the error bar of
the one derived by PG99. We do not detect any double component in our LOSVDs,
in apparent contradiction with the data of PG99. We observe
a high excitation [Ca VIII] emission line, burried within the second 12CO absorption
feature. The emitting region is restricted to the central spectra, and is consistent
with an unresolved point-like source, thus certainly linked with the AGN.
This point will be examined in details in a forthcoming paper (Paper II).
The first striking result of those observations is that, in all 4 observed targets,
the rotational velocity reveals a maximum inside the nuclear bar (or disc for NGC 1365)
and then decreases![]() , showing that the nuclear region is a well decoupled dynamical
component of the galaxies. For the three cases with nuclear bars
(NGC 1097, NGC 1808 and NGC 5728), this follows suggestions made from
photometric studies as no preferential angle was observed
between the two bars (Greusard et al. 2000 and references therein).
The existence of such structures could be doubted when
dealing with a galaxy like NGC 1808, where there are numerous
clumps of star forming systems within the central arcseconds.
But even in that case, the NIR photometric elongation
embedded within the ring present in the WFPC2/HST (archival) images strongly
suggests the presence of a nuclear bar. This point is further examined
in the light of dynamical models (Sect. 5).
This is therefore the first direct confirmation of the dynamically
decoupled nature of nuclear bars.
, showing that the nuclear region is a well decoupled dynamical
component of the galaxies. For the three cases with nuclear bars
(NGC 1097, NGC 1808 and NGC 5728), this follows suggestions made from
photometric studies as no preferential angle was observed
between the two bars (Greusard et al. 2000 and references therein).
The existence of such structures could be doubted when
dealing with a galaxy like NGC 1808, where there are numerous
clumps of star forming systems within the central arcseconds.
But even in that case, the NIR photometric elongation
embedded within the ring present in the WFPC2/HST (archival) images strongly
suggests the presence of a nuclear bar. This point is further examined
in the light of dynamical models (Sect. 5).
This is therefore the first direct confirmation of the dynamically
decoupled nature of nuclear bars.
The second surprising result comes from the dispersion profiles: they exhibit a significant drop at the centre (but again we cannot say anything concerning NGC 1365). This is particularly clear in the cases of NGC 1097 and NGC 1808. We have checked that the dilution of the lines by any featureless continuum component does not affect the dispersion (and velocity) as long as the 12CO lines remain strong enough. We do indeed see some dilution and changes in the 12CO line strength, but this does not affect our result. We have also checked that the observed central dispersion drop is not due to a template mismatching effect (Paper II).
Copyright ESO 2001