

Up: The ATCA/VLA OH 1612
In Table 2 all narrow-line OH sources found are listed.
In total there are 286 sources,
125 of which have been identified with known OH-1612-MHz masers.
Ten sources have only one spectral peak.
A reliable (see Sect. 5.5 for definition)
IRAS identification is found for 207 sources.
The median "residual" rms-noise level is 25 mJy (Fig. 3, Sect. 5.1.1).
 |
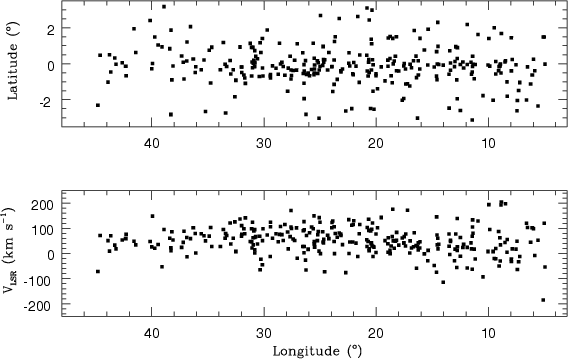
Figure 4:
a) and b)
The longitude-latitude diagram and longitude-velocity diagram for the 286 sources of Table 2.
The central velocities (Col. 10) are plotted |
 |
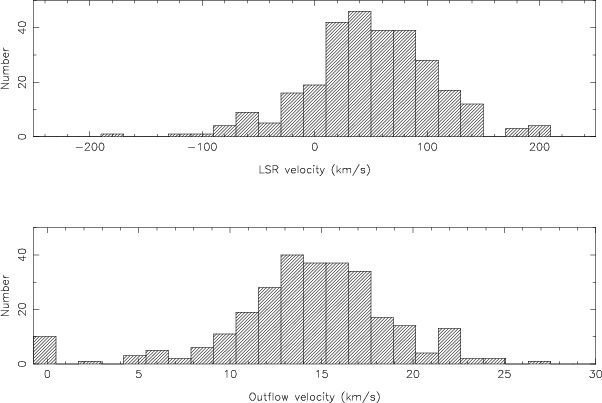
Figure 5:
a) and b)
The histograms of the central velocities and outflow velocities
for the 286 sources of Table 2 |
For each source the table gives an entry number (Col. 1),
the OH name (Col. 2), observing date (Col. 3, see Table 1),
position in J2000 coordinates (Cols. 4, 5),
the formal positional error (Col. 6) - much smaller than the actual
error (Sect. 5.2) -, the distance from the source
to the pointing centre (Col. 7), the peak, stellar and
outflow velocities (Cols. 8 to 11), the peak fluxes (Cols. 12, 13),
calibration flag (see Sect. 5.3) and
error in the peak flux density (Col. 14; see Sect. 5.3),
the empirical residual noise in the
field where the source was detected (Col. 15),
presence of previous OH detection and
the name of the nearest IRAS point source (Col. 16)
and the distance to this nearest IRAS point source expressed as a
fraction of the corresponding IRAS error ellipse (Col. 17).
name (Col. 2), observing date (Col. 3, see Table 1),
position in J2000 coordinates (Cols. 4, 5),
the formal positional error (Col. 6) - much smaller than the actual
error (Sect. 5.2) -, the distance from the source
to the pointing centre (Col. 7), the peak, stellar and
outflow velocities (Cols. 8 to 11), the peak fluxes (Cols. 12, 13),
calibration flag (see Sect. 5.3) and
error in the peak flux density (Col. 14; see Sect. 5.3),
the empirical residual noise in the
field where the source was detected (Col. 15),
presence of previous OH detection and
the name of the nearest IRAS point source (Col. 16)
and the distance to this nearest IRAS point source expressed as a
fraction of the corresponding IRAS error ellipse (Col. 17).
The spectra for all sources are shown in Fig. 10.
They are displayed with 50kms-1 on either side of the
velocity range of each object.
The spectra were extracted from cleaned (1282 1
 pixels around
the source position) and restored cubes, summing
over
pixels around
the source position) and restored cubes, summing
over
 pixels around the peak pixel. Only
spectra #237 and #280 were extracted from raw cubes,
as cleaning was impossible due to the awkward beam shape.
No "continuum fitting" other than the described RFI
excision (Sect. 3.1) was applied (cf. spectra #097, 104, 253, 275, 280).
pixels around the peak pixel. Only
spectra #237 and #280 were extracted from raw cubes,
as cleaning was impossible due to the awkward beam shape.
No "continuum fitting" other than the described RFI
excision (Sect. 3.1) was applied (cf. spectra #097, 104, 253, 275, 280).
![\begin{figure}
\par\parbox[t]{9cm}{\vspace*{-5.25cm}\includegraphics[angle=-90,w...
...}
\parbox[t]{5cm}{\includegraphics[width=5cm,clip]{ms10125f6b.eps}}
\end{figure}](/articles/aa/full/2001/05/aa10125/Timg36.gif) |
Figure 6:
A source (solid black circle in right panel)
in the field of pointing centre A will create
sidelobes in that field, as well as that of B (42 away from A).
The furthest strong (30%) sidelobe of
a typical synthesized beam in the VLA survey
is at
away from A).
The furthest strong (30%) sidelobe of
a typical synthesized beam in the VLA survey
is at  500
(small hatched circles).
In the left panel, the response to a unity-flux-density source
is given in the main lobe (solid curve) and in this furthest sidelobe,
which we take to be on a spoke of the beam that runs through A and
B, to calculate the extreme case.
The dashed curves, from top to bottom at offset < 12)
give the response in the lobe offset towards A (1), away from A (2)
and the latter seen from B (3), all using
the known VLA primary-beam attenuation.
The vertical line indicates the largest possible offset of sources
detected in fields that are not on the boundary of the survey region.
Only for sources on the very
edge of a field, the main lobe of the synthesized beam is no longer observed
to be brightest point 500
(small hatched circles).
In the left panel, the response to a unity-flux-density source
is given in the main lobe (solid curve) and in this furthest sidelobe,
which we take to be on a spoke of the beam that runs through A and
B, to calculate the extreme case.
The dashed curves, from top to bottom at offset < 12)
give the response in the lobe offset towards A (1), away from A (2)
and the latter seen from B (3), all using
the known VLA primary-beam attenuation.
The vertical line indicates the largest possible offset of sources
detected in fields that are not on the boundary of the survey region.
Only for sources on the very
edge of a field, the main lobe of the synthesized beam is no longer observed
to be brightest point |
Dots over peaks in the
spectra give an indication of the velocity range of the
detections; note eg. the sidelobe from spectrum #223 in
spectrum #219.
Sidelobes are still present in the spectra,
as most confusing sources would be outside the cleaned area.
Negative sidelobes are obvious in e.g. spectra #127 (from #132),
#150 (from #149) and in an unfortunate way in #222 (from #223).
Note the extreme
velocity coincidence of #159 and #172, as well as #242 and #244.
In Fig. 4 the longitude-latitude diagram and longitude-velocity diagram are shown and in Fig. 5 the histograms
of central- and outflow velocity.
Table 2 Compact OH-maser sources in the northern
galactic Disk region (This table is only available in electronic
form at the CDS via anonymous
ftp to cdsarc.u-strasbg.fr
(130.79.128.5)
or via
http://cdsweb.u-strasbg.fr/cgi-bin/qcat?J/A+A/366/481
The columns of Table 2 contain the following information:
- 1. Sequence number (coincident with spectra in Fig. 10).
- 2. Name in the OH
convention.
- 3. Date of observation. Date "000000" means data were taken
during more than one observing run
(see Table 1 for parameters).
- 4. Right ascension of the brightest peak
for epoch J2000 (typical error 2
,
Sect. 5.2).
- 5. Declination of the brightest peak
for epoch J2000 (typical error 2
,
Sect. 5.2).
- 6. Formal measurement error in position
from IMFIT (determined in the channel of the brightest
peak) in arcsec (Sect. 5.2).
- 7. Radial offset of the source from pointing centre in arcmin.
- 8. Line-of-sight velocity with respect to the LSR of the
blue-shifted (L) peak.
For single-peaked
spectra the velocity of the peak is always given as blue-shifted
for reasons of tabulation (typical error 1kms-1, Sect. 5.4).
- 9. Same for the red-shifted (H) peak (typical error 1kms-1, Sect. 5.4).
- 10. Stellar velocity (typical error 1kms-1/14kms-1, Sect. 5.4).
- 11. Outflow velocity; zero for single-peaked sources
(typical error 1kms-1, Sect. 5.4).
- 12. Flux density in image domain at peak pixel of cleaned, restored
image (IMSPEC),
corrected for primary-beam attenuation, but not for any "continuum"
of the blue-shifted (L) peak (typical error 20%, Sect. 5.3).
- 13. Same for the red-shifted (H) peak (typical error 20%, Sect. 5.3).
- 14. Formal measurement error in flux density, determined in the channel
of the brightest peak (IMFIT). An asterisk
indicates that the corresponding field was not calibrated properly (Sect. 5.3).
- 15. Empirical noise in "empty" cube for the present
field (Sect. 5.1.1, channel width 2.27 kms-1).
- 16. A "+", "
 " or "x" for a, or "-" for no,
OH identification within 1
in
the Simbad database (Sect. 5.6), and the IRAS PSC position with highest
identification probability (i.e. smallest N, see Col. 17, Sect. 5.5).
" or "x" for a, or "-" for no,
OH identification within 1
in
the Simbad database (Sect. 5.6), and the IRAS PSC position with highest
identification probability (i.e. smallest N, see Col. 17, Sect. 5.5).
- 17. Ratio between the size of the error ellipse of, and
and the distance to, the IRAS PS of Col. 16,
in the direction of the OH position (Sect. 5.5).
Up: The ATCA/VLA OH 1612
Copyright ESO 2001
![\begin{figure}
\par\parbox[t]{9cm}{\vspace*{-5.25cm}\includegraphics[angle=-90,w...
...}
\parbox[t]{5cm}{\includegraphics[width=5cm,clip]{ms10125f6b.eps}}
\end{figure}](/articles/aa/full/2001/05/aa10125/img36.gif)