

Obviously, the measurements also need a careful calibration among the wavebands. A large erroneus offset can be disastrous for the photometric classification of narrow class structures in color space. If, e.g., true stars were measured with shifted colors, the classification would potentially find it rather in the location of library galaxies or quasars, and vice versa. Also, the redshift estimates would be thrown off by color offsets.
Calibration problems are of greatest concern, when rare objects are searched and their class gets contaminated. Especially, when class volumes are almost touching in color space, already small calibration errors can push objects into the wrong class. E.g., in many filter sets the quasar class is not well separated from stars and galaxies. In the presence of a calibration error, abundant galaxies can be pushed into the quasar class potentially making up the largest population among the precious candidates. The shape of class volumes is likely to cause quite some redshift dependence for the contamination. Then objects in some redshift range can become virtually unidentifiable, if they are overwhelmed by contaminants.
If calibration errors were known and quantified, they could as well be removed. If
they were present but not realized, the measurements would look too accurate and a
seemingly faithful classification would be derived, which is potentially wrong. Thus,
as long as the calibration errors are unknown, it is still important to take their
potential size into account for the error estimates on which the classification is
based. As a result, the performance of the classification for bright objects is
indeed limited by the calibration error.
We assume calibration errors on the order of 3% for the colors in our surveys, which
implies that the quality of the classification saturates for objects that are more
than
 brighter than the 10-
 -limits of the survey. On the other hand,
if we assume for the moment poor data reduction or uncorrected galactic reddening
changing the colors by, e.g., 10%, this would turn an entire survey catalog into a
collection of "less-than-10--objects'' -- a devastating effect for the
survey quality.
-limits of the survey. On the other hand,
if we assume for the moment poor data reduction or uncorrected galactic reddening
changing the colors by, e.g., 10%, this would turn an entire survey catalog into a
collection of "less-than-10--objects'' -- a devastating effect for the
survey quality.
An accurate relative calibration among many wavebands is best ensured by establishing a few spectrophotometric standard stars in each of the survey fields, a successful approach that we have made into a standard procedure in CADIS. This task can be carried out in a photometric night by taking spectra of the new standards and connecting these to published standard stars (Oke 1990). This way, spectrophotometric standards are available in every one of the survey exposures, which will not require any further calibartion efforts regardless of the conditions under which the regular imaging is carried out. Obviously, standard star spectra are supposed to cover the entire filter set, but if a mixture of (e.g. optical and infrared) instruments is used, the calibration will involve different procedures to be matched.
The most basic result of our study on the performance of different multi-color
surveys is, that even for small systematic errors in the color indices of
 ,
a survey with 17 bands performs better in classification and redshift
estimation than one with only few bands. For the 17 band case we found that the
limiting magnitude for reasonable performance is reached when the typical
statistical (i.e. photon noise) errors are on the order of 10%. It is obvious, that
larger systematic errors will worsen the performance and will allow even higher
statistical errors before the survey deteriorates significantly. For the survey
strategy this implies that pushing the statistical errors in each band well below the
systematic errors will add nothing to the survey performance. When
,
a survey with 17 bands performs better in classification and redshift
estimation than one with only few bands. For the 17 band case we found that the
limiting magnitude for reasonable performance is reached when the typical
statistical (i.e. photon noise) errors are on the order of 10%. It is obvious, that
larger systematic errors will worsen the performance and will allow even higher
statistical errors before the survey deteriorates significantly. For the survey
strategy this implies that pushing the statistical errors in each band well below the
systematic errors will add nothing to the survey performance. When
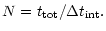
 is the integration time required to reach
 ,
the optimum
number of bands N for a given amount of total time
,
the optimum
number of bands N for a given amount of total time
 is roughly
 |
(31) |
Although our present study has been confined to the wavelengths region attainable by optical CCDs and did not address the total wavelength coverage of the survey explicitely, it is predictable that further bands extending the wavenlength coverage (e.g. by adding NIR bands) will have a larger effect than splitting the optical bands. In particular, the maximum redshift for a reliable galaxy classification will be extended.
As the color indices are the prime observables entering the classification and redshift estimation process, it is clear that any multi-color survey has to be processed such, that these indices are measured in an optimum way. For ground-based observations it is of great importance to avoid that variable observing conditions introduce systematic offsets between bands when the observations are taken sequentially. First of all, this requires to assess the seeing point spread function on every dataset very carefully. Second, one has to correct for the effect of variable seeing which might influence the flux measurement of star-like and extended objects in a different way.
In CADIS, we essentially convolve each image to a common effective point spread function and measure the central surface brightness of each object (see Paper II for details). This has the disadvantage, that the spatial resolution (i.e. the minimum separation of objects neighboring each other) is limited by the data with the worst seeing. However, it is not clear whether the obvious alternative -- deconvolution techniques -- can be optimized such that the systematic errors can be kept below a few percent for a wide variety of objects.
The performance of the MEV estimator depends critically on the assumption that not only the color indices but also their errors are determined correctly. For the survey strategy this implies, that an optimization of the photon noise errors under the expense that an accurate estimation of these errors is no longer possible may lead to worse performance than slightly larger errors which are known accurately.
In this section, we want to mention examples for survey applications using this method and comment on the usefulness of our classification approach. A number of multi-color surveys have been conducted, where filters and exposure times were chosen to match some primary survey strategy. Although, none of these might have been optimal choices in terms of a general classification, we used or intend to use our approach to extract class and redshift data on the objects contained. These surveys are in chronological order of their beginning:
 ,
to search for quasars at all visible redshifts and
to use the observed faint stellar population to check models of the Galactic
structure and the stellar luminosity function
(Meisenheimer et al. 1998; Wolf et al. 1999; Fried et al. 2000;
Phleps et al. 2000; Paper II);
,
to search for quasars at all visible redshifts and
to use the observed faint stellar population to check models of the Galactic
structure and the stellar luminosity function
(Meisenheimer et al. 1998; Wolf et al. 1999; Fried et al. 2000;
Phleps et al. 2000; Paper II);
 and the background population. The galaxy luminosity function in the
background of the cluster is compared to a control field taken from CADIS, and the
cluster mass is estimated from weak lensing effects on the apparent luminosities
(Dye et al. 2000);
and the background population. The galaxy luminosity function in the
background of the cluster is compared to a control field taken from CADIS, and the
cluster mass is estimated from weak lensing effects on the apparent luminosities
(Dye et al. 2000);
 and
galaxy-quasar correlation at
,
as well as weak lensing effects in the
cluster group Abell 901/2 and in the open galaxy field (Wolf et al. 2000);
and
galaxy-quasar correlation at
,
as well as weak lensing effects in the
cluster group Abell 901/2 and in the open galaxy field (Wolf et al. 2000);
From simulations of the classification scheme presented in this paper, we expect in all these projects, that we should be able to classify virtually all objects above some magnitude limit purely by color, and that especially the medium-band surveys should have selection functions which are not very dependent of redshift. This way, we can omit morphological criteria for defining catalogs of the stellar vs. galaxy vs. quasar population. This conclusion leads to a number of advantages for our method, we like to state explicitely here:
 is much reduced in the color space;
 are searched for.
Copyright ESO 2001