| Issue |
A&A
Volume 563, March 2014
|
|
|---|---|---|
| Article Number | A141 | |
| Number of page(s) | 12 | |
| Section | Cosmology (including clusters of galaxies) | |
| DOI | https://doi.org/10.1051/0004-6361/201322029 | |
| Published online | 25 March 2014 | |
Online material
Appendix A: The cluster-mass bias
The ratios rν(L)
defined in Sect. 2.4.1 can be predicted under the
assumption that, on large scales, dark matter halos of a given mass M are biased tracers of
the underlying dark matter distribution. In the so-called local bias model, to zeroth
order in perturbation theory (e.g., Cooray &
Sheth 2002), this is expressed as P(k;M) = b2(M)Pmat(k),
where Pmat(k) denotes the
power spectrum of the dark matter and b(M) is a scale-independent
halo-mass bias. Given a halo mass function n(M)dM (i.e.,
the number of dark matter halos with masses between M and M + dM
per unit comoving volume) and a selection function
 (i.e., the probability of having a cluster with mass M given some selection
criteria), the real-space marked power spectra can be written as
(i.e., the probability of having a cluster with mass M given some selection
criteria), the real-space marked power spectra can be written as
 (e.g., Cooray & Sheth 2002; Sheth 2005), where
 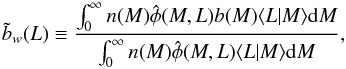 (A.1)and
 (A.2)is the
effective cluster-matter bias. For a given bin of X-ray luminosity, the selection
function φ(M,L) can be expressed as the
average of the scaling relation
(A.2)is the
effective cluster-matter bias. For a given bin of X-ray luminosity, the selection
function φ(M,L) can be expressed as the
average of the scaling relation  given by Eq. (1) in that luminosity bin.
The ratios r1, 2, 3(L)
in real space can therefore be interpreted as estimates of b(L)/b(Lref),
bw(L)b(L) /(b(Lref)bw(Lref)),
and bw(L)/bw(Lref)
respectively. Also, the information contained in the ratio r4(L) is the same as
contained in the ratio r5(L), since these
are estimates of the ratio (bw(L) /b(L))1/2
and bw(L)/b(L)
respectively. Accordingly, the luminosity power spectrum can be written as
given by Eq. (1) in that luminosity bin.
The ratios r1, 2, 3(L)
in real space can therefore be interpreted as estimates of b(L)/b(Lref),
bw(L)b(L) /(b(Lref)bw(Lref)),
and bw(L)/bw(Lref)
respectively. Also, the information contained in the ratio r4(L) is the same as
contained in the ratio r5(L), since these
are estimates of the ratio (bw(L) /b(L))1/2
and bw(L)/b(L)
respectively. Accordingly, the luminosity power spectrum can be written as 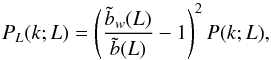 (A.3)from which the
predictions for the ratios r6, 7(L)
can be readily obtained. According to Eq. (1), the moments of the luminosity L are linked to the scaling relation via
(A.3)from which the
predictions for the ratios r6, 7(L)
can be readily obtained. According to Eq. (1), the moments of the luminosity L are linked to the scaling relation via
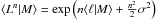 .
Therefore, the bias
.
Therefore, the bias  is directly sensitive to the mean of the scaling relation, yet indirectly (only through
)
to the intrinsic scatter.
is directly sensitive to the mean of the scaling relation, yet indirectly (only through
)
to the intrinsic scatter.
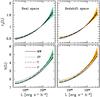 |
Fig. A.1
Ratio r3(L) (top panels) defined in Eq. (7), and luminosity bias b(L) (bottom panels) obtained in the range 0.02 ≤ k/(h Mpc-1) ≤ 0.08. Results are shown in real (right panel) and redshift (left panel) space. For readability, we only show the standard deviation obtained from the N-body simulations with shaded regions. The lines represent the predictions presented in Sect. 2.4.1 using expressions for the halo-mass bias as reported by different authors, MW: Mo & White (1996); ST: Sheth & Tormen (1999); T: Tinker et al. (2010); and P: Pillepich et al. (2010). |
| Open with DEXTER | |
The redshift-space estimates of the ratios rν(L)
can be obtained in a similar way. Under the plane-parallel approximation, the
large-scale signal of the redshift-space cluster power spectrum Ps(k;L)
can be described by the so-called Kaiser effect (e.g., Kaiser 1987; Hamilton 1998)
Ps(k;L) = (1 + 2β/3 + β2/5)P(k;L), where
 and
f ≡ dlnD(a)/dlna
is the growth index (D(a) represents the growth
factor) (e.g., Peebles 1980). Given the cosmology
and redshift output of the L-BASICC simulations that we used, f = 0.44. The Kaiser
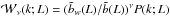
effect can be generalized to the marked power spectra (e.g., Skibba et al. 2006) as
and
f ≡ dlnD(a)/dlna
is the growth index (D(a) represents the growth
factor) (e.g., Peebles 1980). Given the cosmology
and redshift output of the L-BASICC simulations that we used, f = 0.44. The Kaiser
effect can be generalized to the marked power spectra (e.g., Skibba et al. 2006) as 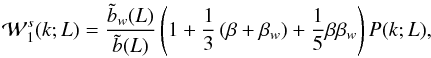 (A.4)and
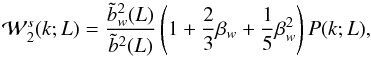 (A.5)where
 . We
have checked whether these expressions describe the ratios rν(L).
To this end, the halo abundance n(M) is taken to be described by
the fitting formulae of Jenkins et al. (2001),
which is suitable for simulations such as the L-BASICC. A crucial step is to choose the
halo-mass bias b(M). In Fig. A.1 we show predictions for the ratio r3(L), obtained using
some examples of prescriptions for this quantity: Mo
& White (1996), Sheth & Tormen
(1999), Tinker et al. (2010). and Pillepich et al. (2010). To witness the performance
of these prescriptions, the bottom panels in Fig. A.1 show the luminosity bias obtained similar to what is described by Eq.
(7), using the estimates of the matter
power spectrum of the L-BASICC II simulation. This figure shows that i) as established
by a number of studies, a scale-independent halo-mass bias is a fair modeling of the
cluster power spectrum on large scales; ii) the Kaiser effect is a good description of
the redshift-space power spectra, at least within the range of masses and scales probed
by our analysis (see, e.g., Bianchi et al. 2012,
for a broader discussion on this subject); iii) when assessing the ability of a model to
retrieve either cosmological or astrophysical information from one or two-point
statistics, extreme caution is required in view of the discrepancies observed between
models and the simulations. In particular, more accurate models of halo-mass function
and halo-mass bias are demanded, given the small statistical errors expected from
forthcoming surveys (see, e.g., Cunha & Evrard
2010; Wu et al. 2010; Smith et al. 2012) with volumes comparable to that of
the L-BASICC simulation. The differences between the different fitting formulae
presented in Fig. A.1 can be caused by several
effects, namely, the difference cosmological models and/or parameters used in the
N-body
simulations used to fit each of them, the characteristics of the halo-identification
algorithm (which introduces systematic effects both in the mass function and the
halo-mass bias), and the way the biases are measured (i.e, either from the correlation
function, the power spectrum, or by means of count-in cells experiments). It is beyond
the scope of this work to analyze these differences in detail; however, we note that
different fitting formulae can provide a good description of the measured luminosity
bias at different ranges of X-ray luminosity. In particular, the results from Tinker et al. (2010) generate a fair description for
luminosities above ~3 × 1043 h-2 erg s-1.
Lower luminosities correspond to halos defined by a relatively low number of dark matter
particles, where resolution effects can be relevant. Finally, iv) the discrepancies
between the different prescription of halo-mass bias are slightly diminished when we
work with estimates of relative biases instead of absolute biases.
. We
have checked whether these expressions describe the ratios rν(L).
To this end, the halo abundance n(M) is taken to be described by
the fitting formulae of Jenkins et al. (2001),
which is suitable for simulations such as the L-BASICC. A crucial step is to choose the
halo-mass bias b(M). In Fig. A.1 we show predictions for the ratio r3(L), obtained using
some examples of prescriptions for this quantity: Mo
& White (1996), Sheth & Tormen
(1999), Tinker et al. (2010). and Pillepich et al. (2010). To witness the performance
of these prescriptions, the bottom panels in Fig. A.1 show the luminosity bias obtained similar to what is described by Eq.
(7), using the estimates of the matter
power spectrum of the L-BASICC II simulation. This figure shows that i) as established
by a number of studies, a scale-independent halo-mass bias is a fair modeling of the
cluster power spectrum on large scales; ii) the Kaiser effect is a good description of
the redshift-space power spectra, at least within the range of masses and scales probed
by our analysis (see, e.g., Bianchi et al. 2012,
for a broader discussion on this subject); iii) when assessing the ability of a model to
retrieve either cosmological or astrophysical information from one or two-point
statistics, extreme caution is required in view of the discrepancies observed between
models and the simulations. In particular, more accurate models of halo-mass function
and halo-mass bias are demanded, given the small statistical errors expected from
forthcoming surveys (see, e.g., Cunha & Evrard
2010; Wu et al. 2010; Smith et al. 2012) with volumes comparable to that of
the L-BASICC simulation. The differences between the different fitting formulae
presented in Fig. A.1 can be caused by several
effects, namely, the difference cosmological models and/or parameters used in the
N-body
simulations used to fit each of them, the characteristics of the halo-identification
algorithm (which introduces systematic effects both in the mass function and the
halo-mass bias), and the way the biases are measured (i.e, either from the correlation
function, the power spectrum, or by means of count-in cells experiments). It is beyond
the scope of this work to analyze these differences in detail; however, we note that
different fitting formulae can provide a good description of the measured luminosity
bias at different ranges of X-ray luminosity. In particular, the results from Tinker et al. (2010) generate a fair description for
luminosities above ~3 × 1043 h-2 erg s-1.
Lower luminosities correspond to halos defined by a relatively low number of dark matter
particles, where resolution effects can be relevant. Finally, iv) the discrepancies
between the different prescription of halo-mass bias are slightly diminished when we
work with estimates of relative biases instead of absolute biases.
Appendix B: Halo exclusion
Dark matter halos are not point-like objects. As a consequence, the idea that their
spatial distribution can be described as a Poisson-point process drawn from a
realization of an underlying continuous field with a positive correlation function
(Peebles 1980) is, strictly speaking, not a
realistic assumption. So far, a statistical description of halo distribution that takes
their finite size into account is not fully accomplished. Instead, simple geometrical
approaches have been developed to empirically model the exclusion effect within the
context of the two-point correlation function. Here we briefly illustrate how this model
works. Assuming that we can assign a radius to each spherical halo, the correlation
function can be written as (e.g., Porciani &
Giavalisco 2002) 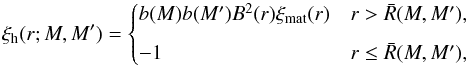 (B.1)where
 ,
with ⟨R|M ⟩ denoting the expected
radius of a cluster with mass M. In this expression, b(M)
denotes the dark-matter halo scale-independent bias, B(r)
denotes a possible scale-dependency in the halo-matter bias (e.g., Tinker et al. 2005), while ξmat(r) is the full
nonlinear matter correlation function. For halos with masses within an infinitesimally
narrow range, this expression predicts a sharp transition towards ξh(r) = −1 at a scale
equal to twice the radius of the halo. This transition becomes smoother when halos with
different masses (and thus sizes) are included. In Fourier space, the exclusion is
translated to a lack of power on small scales, which goes counter to the effect of the
nonlinear clustering. Since the exclusion effect is more evident when more massive halos
are considered, such lack of power displays a clear trend with the characteristic mass
(or X-ray luminosity) of the sample. The halo power spectrum from Eq. (B.1) can be separated into three components:
,
with ⟨R|M ⟩ denoting the expected
radius of a cluster with mass M. In this expression, b(M)
denotes the dark-matter halo scale-independent bias, B(r)
denotes a possible scale-dependency in the halo-matter bias (e.g., Tinker et al. 2005), while ξmat(r) is the full
nonlinear matter correlation function. For halos with masses within an infinitesimally
narrow range, this expression predicts a sharp transition towards ξh(r) = −1 at a scale
equal to twice the radius of the halo. This transition becomes smoother when halos with
different masses (and thus sizes) are included. In Fourier space, the exclusion is
translated to a lack of power on small scales, which goes counter to the effect of the
nonlinear clustering. Since the exclusion effect is more evident when more massive halos
are considered, such lack of power displays a clear trend with the characteristic mass
(or X-ray luminosity) of the sample. The halo power spectrum from Eq. (B.1) can be separated into three components:
 (B.2)The first term
 is the halo power
spectrum with a scale-independent bias. The second term is the Fourier transform of the
−1 in Eq. (B.1), where j1(x) denotes the
spherical Bessel function of first order. The third contribution can be written as
is the halo power
spectrum with a scale-independent bias. The second term is the Fourier transform of the
−1 in Eq. (B.1), where j1(x) denotes the
spherical Bessel function of first order. The third contribution can be written as
 (B.3)
(B.3)
where the kernel  is
given by
is
given by  , with
 (B.4)and
 (B.5)In the limit
 (i.e., no halo exclusion), both the second term on the right hand side of Eq. (B.3) and the kernel G2 go to zero.
In that case a nonlinear contribution to the cluster power spectrum relies on the
behavior of the scale-dependent halo-mass bias B(r). In
the limit of an homogeneous distribution, we end up with a power spectrum of the form
(i.e., no halo exclusion), both the second term on the right hand side of Eq. (B.3) and the kernel G2 go to zero.
In that case a nonlinear contribution to the cluster power spectrum relies on the
behavior of the scale-dependent halo-mass bias B(r). In
the limit of an homogeneous distribution, we end up with a power spectrum of the form
 . Thus, to obtain an
unbiased estimation of the cluster power spectrum (of spherically symmetric
nonoverlapping clusters), this last term would need to be subtracted from the raw
estimates (as in Eq. (3)), together with
the white shot noise
. Thus, to obtain an
unbiased estimation of the cluster power spectrum (of spherically symmetric
nonoverlapping clusters), this last term would need to be subtracted from the raw
estimates (as in Eq. (3)), together with
the white shot noise  .
The combination of these two effects can be regarded as scale-dependent shot-noise.
.
The combination of these two effects can be regarded as scale-dependent shot-noise.
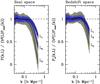 |
Fig. B.1
Halo exclusion: ratio between the measured cluster power spectrum described in Sect. 2.3 and the expected linear cluster power spectrum b2(L)Pmat(k), for clusters in four different bins of X-ray luminosity characterized by a luminosity Li, with L3 > L2 > L1. The luminosity bias b2(L) is that measured from the simulations. The shaded regions and the solid line represent the standard deviation and the mean, respectively, obtained from the N-body simulations. |
| Open with DEXTER | |
Figure B.1 depicts the halo exclusion effect as measured from the ensemble of halos presented in Sect. 2.1. As pointed out above, the strength of the effect scales with the luminosities (or masses) of the objects considered in the analysis. Therefore, this signal can be used to retrieve information on the underlying scaling relation (e.g., mass-X-ray luminosity when analyzing cluster samples or the mass-number of hosted galaxies when analyzing a galaxy redshift survey) (e.g., Porciani & Giavalisco 2002). Finally, the exclusion effect is attenuated when observed in redshift space, simply because pairs of halos are observed to be closer due to their peculiar velocities. For instance, exploring the power spectrum obtained from the full luminosity sample shows that in real space exclusion sets in at k ~ 0.2 h Mpc-1, while this value shifts to ~0.3 h Mpc-1 in redshift space.
© ESO, 2014
Current usage metrics show cumulative count of Article Views (full-text article views including HTML views, PDF and ePub downloads, according to the available data) and Abstracts Views on Vision4Press platform.
Data correspond to usage on the plateform after 2015. The current usage metrics is available 48-96 hours after online publication and is updated daily on week days.
Initial download of the metrics may take a while.