Fig. 1
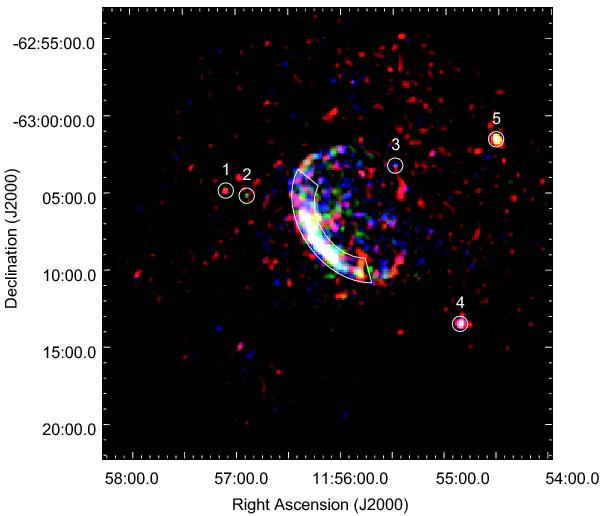
30′ × 30′ XMM-Newton MOS1/2 color image of G296.7–0.9 (red 0.5–0.9 keV, green 0.9–1.3 keV, and blue 1.3–2 keV). The superimposed images are binned with 6″ per pixel and smoothed by a Gaussian kernel of σ = 30″ to enhance the visibility of the diffuse emission. The photons detected in the annular sector shown in white were used for spectral analysis of the SNR.
Current usage metrics show cumulative count of Article Views (full-text article views including HTML views, PDF and ePub downloads, according to the available data) and Abstracts Views on Vision4Press platform.
Data correspond to usage on the plateform after 2015. The current usage metrics is available 48-96 hours after online publication and is updated daily on week days.
Initial download of the metrics may take a while.