| Issue |
A&A
Volume 510, February 2010
|
|
|---|---|---|
| Article Number | A102 | |
| Number of page(s) | 16 | |
| Section | Galactic structure, stellar clusters, and populations | |
| DOI | https://doi.org/10.1051/0004-6361/200912818 | |
| Published online | 18 February 2010 | |
Disc and halo kinematic populations from HIPPARCOS and Geneva-Copenhagen surveys of the solar neighbourhood
R. Cubarsi1 - S. Alcobé1 - S. Vidojevic2,3,4 - S. Ninkovic4,5
1 - Dept. Matemàtica Aplicada IV,
Universitat Politècnica de Catalunya, 08034 Barcelona, Catalonia, Spain
2 -
Faculty of Mathematics, University of Belgrade, Studentski trg 16, 11000 Beograd, Serbia
3 -
Observatoire de Paris, Section de Meudon, 5 Place Jules Janssen, 92195 Meudon, France
4 -
Institute Isaac Newton of Chile, Yugoslavia Branch, Yugoslavia
5 -
Astronomical Observatory, Volgina 7, 11060 Beograd 38, Serbia
Received 3 July 2009 / Accepted 18 November 2009
Abstract
Discontinuities in the local velocity distribution associated with stellar populations are studied
using the Maximum Entropy of the Mixture Probability from HIerarchical Segregation (MEMPHIS) improved
statistical method, by combining a sampling parameter,
an optimisation of the mixture approach, and a maximisation of the partition entropy for the constituent
populations of the stellar sample. The sampling parameter is associated with isolating integrals
of the stellar motion and is used to build a hierarchical family of subsamples.
We provide an accurate characterisation of the entropy graph, in which a local maximum of entropy
takes place simultaneously with a local minimum of the ![]() error.
By analysing different sampling parameters, the method is applied to samples from
the HIPPARCOS and Geneva-Copenhagen survey (GCS)
to determine the kinematic parameters and the stellar population mixture of the thin disc, thick disc, and halo.
The sampling parameter
P=|(U,V,W)|, which is the absolute heliocentric velocity, allows us to build an optimal subsample
containing both thin and thick disc stars, omitting most of the halo population.
The sampling parameter P=|W|, which is absolute perpendicular velocity, allows us to create an optimal subsample
of all disc and halo stars,
although it does not allow an optimal differentiation of thin and thick discs.
Other sampling parameters, such as P=|(U,W)| or P=|V|, are found to provide less information about the populations.
By comparing both samples, HIPPARCOS provides more accurate estimates for the thick disc and halo,
and GCS for the total disc.
In particular, the radial velocity dispersion of the halo fits perfectly into the empirical Titius-Bode-like
law
error.
By analysing different sampling parameters, the method is applied to samples from
the HIPPARCOS and Geneva-Copenhagen survey (GCS)
to determine the kinematic parameters and the stellar population mixture of the thin disc, thick disc, and halo.
The sampling parameter
P=|(U,V,W)|, which is the absolute heliocentric velocity, allows us to build an optimal subsample
containing both thin and thick disc stars, omitting most of the halo population.
The sampling parameter P=|W|, which is absolute perpendicular velocity, allows us to create an optimal subsample
of all disc and halo stars,
although it does not allow an optimal differentiation of thin and thick discs.
Other sampling parameters, such as P=|(U,W)| or P=|V|, are found to provide less information about the populations.
By comparing both samples, HIPPARCOS provides more accurate estimates for the thick disc and halo,
and GCS for the total disc.
In particular, the radial velocity dispersion of the halo fits perfectly into the empirical Titius-Bode-like
law
![]() ,
previously proposed for discrete kinematical components,
where the values n=0,1,2,3 represent early-type stars, thin disc, thick disc, and halo populations, respectively.
The kinematic parameters are used to segregate thin disc, thick disc, and halo stars, and to obtain a more
accurate Bayesian estimation of the population fractions.
To check the reliability of our results, an alternative segregation approach is used. GCS stars are
classified into different kinematical populations in terms of their orbital parameters.
The population fractions and velocity moments obtained by both methods are in excellent agreement.
,
previously proposed for discrete kinematical components,
where the values n=0,1,2,3 represent early-type stars, thin disc, thick disc, and halo populations, respectively.
The kinematic parameters are used to segregate thin disc, thick disc, and halo stars, and to obtain a more
accurate Bayesian estimation of the population fractions.
To check the reliability of our results, an alternative segregation approach is used. GCS stars are
classified into different kinematical populations in terms of their orbital parameters.
The population fractions and velocity moments obtained by both methods are in excellent agreement.
Key words: stars: kinematics and dynamics - stars: population II - Galaxy: kinematics and dynamics
1 Introduction
Observations in velocity space are particularly useful in identifying Galactic structures that have long since dispersed in configuration space (Freeman & Bland-Hawthorn 2002), and could provide near-field cosmology with some clues as to how individual stellar populations can be associated with elements of the protocloud from which the Galaxy was formed. However, the way in which a stellar sample is selected may obviously yield very different parameter estimates for classifying stellar populations. In general, a sample may contain stars belonging to the principal Galactic components of bulge, disc, and halo, although each component can be decomposed into several subcomponents or stellar populations related to various astrophysical properties and, in particular, kinematics. Usually the so-called population representative samples are drawn from large catalogues, such as the Geneva-Copenhagen survey (GCS) of the Solar neighbourhood (Nordtröm et al. 2004), where the stars are chosen or rejected by means of individual inspection to obtain a sample that corresponds, for example, to particular disc features. However, star selection based on astrophysical criteria, such as metalicity, may produce kinematically biased samples and population estimates, which would then match what theoretically we believe is a disc sample, but may then lead to the error described by the well known Conan Doyle's character, ``Insensibly one begins to twist the facts to suit theories, instead to theories to suit facts''.
To avoid this interactive inspection of star catalogues Alcobé & Cubarsi (2005) (hereafter Paper I) developed a purely statistical method called the MEMPHIS algorithm (Maximum Entropy of Mixture Probability from HIerarchical Segregation), which is based on the principle of insufficient reason. Our objective was to obtain population-representative subsamples, in terms of kinematics, and to segregate them. In Paper I, for a local sample drawn from the HIPPARCOS catalogue (ESA 1998), that contained a full set of space velocities, the neighbourhood stars were classified as belonging to either the thin or thick discs, although within the thin disc it was also possible to distinguish between early-type, young-disc, and old-disc stars. The possibility of an intermediate population between the major disc components was rejected, since the appearance of a continuous transition between them was proven to be caused by the overlapping wings of the major disc components. However, since halo stars are scarce in the solar neighbourhood, it would have anyway been impossible to identify such a Galactic component.
In the current paper, the MEMPHIS algorithm is analysed further and improved to characterise the local halo. We compare the population estimates obtained from the GCS disc-representative catalogue, compiled from improved radial velocity data, with the non-preselected HIPPARCOS sample used in Paper I. Furthermore, the resulting population samples drawn from the GCS catalogue are checked using an alternative kinematical method, based on the computation of the Galactocentric orbits of the stars.
Hereafter, the paper is organised as follows. In Sect. 2, the segregation
algorithm is briefly reviewed. The reader interested in the kinematical description of the local
populations can go directly to Sect. 4.
In Sect. 3, the main definitions and procedures of the maximum entropy method are revised.
Although the main concepts are the same as in Paper I, some
new details have been added to the interpretation of the sampling parameter, as well as the
description of the entropy graph, which allows us to improve the algorithm.
In Sect. 4, the ![]() error of the mixture approach and its relationship
with the partition entropy are studied. This is a totally new statistical analysis focusing on the
sampling parameter interval where a segregation between populations becomes meaningful.
The combination of both criteria is used in Sect. 5 to analyse two local samples,
from which kinematical estimates of thin disc, thick disc, and halo are obtained. Several sampling parameters
are compared and a precise estimation of the mixture proportions is carried out.
In Sect. 6, an improved method based on the Galactocentric orbits of stars is used to check the GCS
sample moments and fractions of the populations.
Finally, in Sect. 7, the kinematic results, sampling parameters,
and stellar composition of the samples are discussed.
error of the mixture approach and its relationship
with the partition entropy are studied. This is a totally new statistical analysis focusing on the
sampling parameter interval where a segregation between populations becomes meaningful.
The combination of both criteria is used in Sect. 5 to analyse two local samples,
from which kinematical estimates of thin disc, thick disc, and halo are obtained. Several sampling parameters
are compared and a precise estimation of the mixture proportions is carried out.
In Sect. 6, an improved method based on the Galactocentric orbits of stars is used to check the GCS
sample moments and fractions of the populations.
Finally, in Sect. 7, the kinematic results, sampling parameters,
and stellar composition of the samples are discussed.
2 Methods
MEMPHIS allows us to identify more representative mixtures of populations among a number of feasible mixtures. It relies on the entropy of the partition induced by two statistical populations, assumed to be contained in the whole sample: Pop-I, for the population of greater size and Pop-II, the smaller one. Instead of adapting the velocity distribution function to the whole sample, we choose the stellar subsample that is more accurately described by a two-normal trivariate mixture, that is ``a priori'' less informative distributions (from a Bayesian viewpoint). For more than two populations, the process is iterated with a cumulative component in Pop-I. Therefore, in the current approach, a stellar population is identified with a trivariate Gaussian distribution as a consequence of the adopted mixture model, which attempts to describe a superposition of populations using a simple and plausible basis of functions. To describe the major Galactic components, the Schwarzschild density function remains a good approximation, although a minor number of coeval stars could be erroneously assigned to the more likely population. However, with our model it is impossible to identify the individual subpopulations of the thin disc (it is possible to distinguish between sufficiently large subpopulations, but these are not well fitted by normal distributions). For these stars, other approaches are more suitable. For example, we can employ a more complex distribution function that makes no distinction between populations, such as the Shu distribution function (Shu 1969), other modified Schwarzschild distributions for non-cold discs (e.g., Dehnen 1999; Bienaymé 1999), or a single maximum entropy density function obtained by fitting a set of moment constraints (Cubarsi 2010). Non-parametric mixture models with a free number of Gaussian distributions to describe relevant moving groups (e.g., Bovy et al. 2009 and references therein) are also usual approaches.
2.1 How the segregation works
We provide a brief outline of the procedure, explained in detail in Paper I and reviewed in Sect. 3. Firstly, a sampling parameter is defined to introduce a hierarchy into the sample, so that a set of nested subsamples can be recursively drawn from the total sample, each one containing at least the same or an increasing number of stellar populations than previous subsamples. Some properties, which are associated with isolating integrals of the star motion (such as the velocity component perpendicular to the Galactic plane, the rotational velocity, or the absolute value of the total velocity) can be used as sampling parameters to sort or to discriminate between populations. The bimodal pattern of two Gaussian distributions is then applied to identify the different kinematic behaviours within the selected subsample, by associating them with Pop-I and Pop-II populations. The segregation method is applicable where, by entering stars of a third population into the subsample, the populations are recursively redefined by joining both previously existing populations into Pop-I, and by reserving Pop-II for the newer population. This redistribution produces a discontinuity in the entropy of the mixture probability, which is seen as a steep decline in the entropy graph. The subsample corresponding to a sampling parameter providing the maximum entropy of the partition is taken as the more representative subsample to describe the true population mixture among all the set of nested subsamples containing the same number of stellar populations. In general, the criterion of maximum entropy of the population mixture can be applied in a way that is independent of the segregation method.
The algorithm was proposed as a more accurate alternative to choosing the partition that
minimises the ![]() fitting error of the mixture approach, as in Cubarsi & Alcobé (2004),
hereafter Paper II. The
fitting error of the mixture approach, as in Cubarsi & Alcobé (2004),
hereafter Paper II. The ![]() error basically provides the uncertainty in expressing the whole sample as a
mixture of two Gaussian distributions, and allows us to describe mixtures of populations that are close to
being in statistical equilibrium, such as the main disc components, in contrast to other subpopulations,
such as early and young-disc stars, which have greater
error basically provides the uncertainty in expressing the whole sample as a
mixture of two Gaussian distributions, and allows us to describe mixtures of populations that are close to
being in statistical equilibrium, such as the main disc components, in contrast to other subpopulations,
such as early and young-disc stars, which have greater ![]() errors.
errors.
The segregation method that we used in Papers I and II was a
variant of the moments method, which considered the entire space of the
heliocentric velocities ![]() ,
employing no additional hypotheses
about the symmetry of the distribution.
We review the way in which the
,
employing no additional hypotheses
about the symmetry of the distribution.
We review the way in which the ![]() error was computed. For two normal populations
with mixture proportions n' and n'', such that n'+n''=1, and normalised probability density functions f' and f'', the total velocity distribution is given by
error was computed. For two normal populations
with mixture proportions n' and n'', such that n'+n''=1, and normalised probability density functions f' and f'', the total velocity distribution is given by
The elements of the p-order tensor of moments are evaluated accordingly to the expected value of the p-tensor powers of the velocity as
where Mk are data computed from a working sample with known sampling errors, and the right-hand side contains the moment estimates of both populations assumed to be contained in the sample. The partial moments are computed from a set of
The random variable
For either or both criteria, i.e., maximum entropy or minimum ![]() error, the procedure for obtaining population
representative subsamples can be recursively applied under some minimal conditions.
By continuously increasing the sampling parameter until the whole sample is exhausted,
more than two populations can be segregated.
error, the procedure for obtaining population
representative subsamples can be recursively applied under some minimal conditions.
By continuously increasing the sampling parameter until the whole sample is exhausted,
more than two populations can be segregated.
2.2 Optimal samples
For any subsample, mixture proportions and population kinematical parameters are computed. They
can differ slightly between subsamples, even when describing the same mixture of populations.
Therefore, we must choose an optimal subsample between them.
If this subsample is selected according to the minimum ![]() error of the fit, we then adhere to
the best mixture approach, which has two disadvantages. When increasing the size of the sample,
the quadratic error dramatically decreases, which, in a natural way, blinds other feasible and
perhaps more accurately determined
mixtures with minor subsample size. On the other hand, the quadratic error may have several
local minima from which to choose. If the selection is performed using the maximum partition entropy,
the optimal subsample is then the most representative of those containing similar populations,
i.e., the least informative subsample that is consistent with the partition induced by
the stellar populations. However, the entropy criterion can also cause problems. For example,
if the means of the partial distributions are too close in value, or their wings
overlap too much, the inclusion of a new population in the nested subsamples does not produce a significant decline in
entropy. In addition, the entropy graph may also have several local maxima.
Fortunately, by combining both of these preceding criteria it is possible to obtain an optimal segregation sample.
We consider optimal conditions in which the new stars that are merged to produce the subsamples with increasing
sampling parameter introduce no significant variation in the population parameters and, therefore,
the newly entering stars only contribute to build a more representative mixture. In these conditions, it is possible to obtain
simultaneous local extremes of fitting error and entropy. Of course, both criteria work on the basis of
an appropriate sampling parameter. Moreover, it is possible to use different sampling parameters
depending on the populations that are segregated.
error of the fit, we then adhere to
the best mixture approach, which has two disadvantages. When increasing the size of the sample,
the quadratic error dramatically decreases, which, in a natural way, blinds other feasible and
perhaps more accurately determined
mixtures with minor subsample size. On the other hand, the quadratic error may have several
local minima from which to choose. If the selection is performed using the maximum partition entropy,
the optimal subsample is then the most representative of those containing similar populations,
i.e., the least informative subsample that is consistent with the partition induced by
the stellar populations. However, the entropy criterion can also cause problems. For example,
if the means of the partial distributions are too close in value, or their wings
overlap too much, the inclusion of a new population in the nested subsamples does not produce a significant decline in
entropy. In addition, the entropy graph may also have several local maxima.
Fortunately, by combining both of these preceding criteria it is possible to obtain an optimal segregation sample.
We consider optimal conditions in which the new stars that are merged to produce the subsamples with increasing
sampling parameter introduce no significant variation in the population parameters and, therefore,
the newly entering stars only contribute to build a more representative mixture. In these conditions, it is possible to obtain
simultaneous local extremes of fitting error and entropy. Of course, both criteria work on the basis of
an appropriate sampling parameter. Moreover, it is possible to use different sampling parameters
depending on the populations that are segregated.
In the present work, two new aspects of MEMPHIS algorithm are analysed.
First, we study the use of several isolating integrals of the stellar motion as sampling parameters.
The integrals of motion univocally determine the orbit of each star in the phase space, so that we may expect
that stars of the same stellar population have integrals that smoothly vary within a characteristic range of
values, which may sensibly differ from stars belonging to other populations. However, when continuously scanning a
stellar sample in terms of an integral of motion,
discontinuities can only be observed if we are able to create a discrete partition of stellar populations.
Second, joint variations in entropy and ![]() error are studied.
Once a new population is merged with the cumulative subsample, there is an interval of the sampling
parameter where the entropy smoothly increases and, sometimes, remains nearly constant until the complete
incorporation of the new population. We call this the ``plateau region'' of the entropy graph. It occurs
when the core distribution of the new entering population has already merged with the subsample.
This nearly constant entropy allows a good estimation of the population
parameters, since their computation is very stable. In this plateau region, it is shown that a local
maximum of entropy occurs simultaneously with a local minimum of
error are studied.
Once a new population is merged with the cumulative subsample, there is an interval of the sampling
parameter where the entropy smoothly increases and, sometimes, remains nearly constant until the complete
incorporation of the new population. We call this the ``plateau region'' of the entropy graph. It occurs
when the core distribution of the new entering population has already merged with the subsample.
This nearly constant entropy allows a good estimation of the population
parameters, since their computation is very stable. In this plateau region, it is shown that a local
maximum of entropy occurs simultaneously with a local minimum of ![]() .
Moreover, while for large
samples the minimum fitting error can be nearly undetectable, the entropy maximum is much more visible.
.
Moreover, while for large
samples the minimum fitting error can be nearly undetectable, the entropy maximum is much more visible.
Therefore, a principle of insufficient reason is now converted into a complementary criterion for choosing a significant local minimum of the quadratic fitting error. Similarly, to refine the selection of the more representative subsample within the plateau region, we choose the sampling parameter with the minimum fitting error.
3 Maximum partition entropy
We define P to be a sampling parameter associated with a property defining a stellar sample, in the sense that it determines the boundary for the constituent stars of the sample. Thus, it can then be obtained from the basic isolating integrals of motion (e.g., Gilmore et al. 1989), i.e., the energy integral, the integral for the axial component of the angular momentum, and the third integral or so-called Oort's integral. For example, in a particular volume of the Galaxy we may consider the maximum absolute value of the perpendicular velocity to the Galactic plane; this in turn depends on the third integral, or the greatest absolute value of the Galactocentric star velocity, which is computed from the energy integral. Similarly, we may work with local quadratic integrals, referred to the local standard of rest (LSR) of the population mixture, which are obtained as a combination of energy and angular momentum integrals, or, depending on the dynamical model, from the above three isolating integrals. Specific requirements for this parameter are discussed later.
3.1 Entropy of the mixture
By scanning the entire stellar sample with a sampling parameter P, a subsample S(P) may be drawn,
with a number of stars given by ![]() .
We assume that a finite number c of stellar populations is
present in S(P), according to a population partition
.
We assume that a finite number c of stellar populations is
present in S(P), according to a population partition
![]() .
.
For fixed time and position, the velocity density function f(v) is therefore expressed as a mixture
of c-partial density functions
f(i)(v|X), which are associated with stellar populations depending on a
set of mixture constants, namely X. In Cubarsi (1992), it was proven that the mixture proportions and the
kinematic parameters of each population depend on some mixture constants, which are obtained in terms of
the total cumulants of the sample. Thus, we can write
where p(Ai|X) is the mixture proportion of the ith population. Obviously
Then, the entropy H(A) of the partition
The above equation can be interpreted as the expected value of the uncertainty
Indeed, only a two-component mixture model is needed, since the entropy-based algorithm detects
entropy discontinuities every time that a new population is merged with the sample.
In a two-component partition
![]() ,
for a fixed sampling parameter P and by writing
,
for a fixed sampling parameter P and by writing
![]() ,
n( 2) =1-n, we can express the entropy as
,
n( 2) =1-n, we can express the entropy as
We assume hereafter that the first population A1 is the more prominent one,
In the following section, we examine the behaviour of H in the case of a three-component partition.
3.2 Sampling parameter
The sampling parameter, associated with an isolating integral, induce an order into the velocity space so that, as its value is increased, a set of new stars are merged with the sample. However, the new stars may belong to a single population or, in most cases, may be a mixture of several populations. Although it is not possible to find a sampling parameter that always distinguishes between different populations, based on minor assumptions it is feasible to use a parameter that, depending on its value, gives higher priority to stars of some particular populations than of others. Thus, we wish to use sampling parameters that contain, in some way, population information. These parameters must fulfil some properties, which we tried to synthesise in Paper I in the four following conditions, which we now reproduce and improve to provide a clearer explanation of the entropy graph.
If a stellar sample consists of a set of populations
![]() ,
then a hierarchical family of
subsamples S(P) should progressively incorporate the populations
A1, A2, and so on - by preserving an order - as continuously increasing the parameter P.
For a two-component partition
,
then a hierarchical family of
subsamples S(P) should progressively incorporate the populations
A1, A2, and so on - by preserving an order - as continuously increasing the parameter P.
For a two-component partition
![]() ,
the sampling parameter P should satisfy the following properties:
,
the sampling parameter P should satisfy the following properties:
- (I)
- the number of stars in the subsample S(P) increases with P without losing a single star.
In other words, for two parameter values P1 and P2, we have
(9)
- (II)
- P should incorporate stars in order into the subsample S(P), so that,
as P increases, stars of population A1 are firstly included into the sample and, afterwards,
stars of population A2 are progressively merged with it. Hence, the mixture proportion of the first
population satisfies
This condition may also be fulfilled if stars of both populations are merged simultaneously with the subsample S(P). Obviously, while the A1-population alone represents the subsample S(P), there exists a constant population fraction n(P)=1; - (III)
- if we assume that the transition between populations is smooth enough, then
n(P) is a continuous and differentiable function of P.
Thus Eq. (10) is equivalent to
 ,
n(P) being
a non-increasing function.
Based on the previous assumptions and taking Eq. (8) into account, the entropy H(n(P)),
or simply H(P), is a non-decreasing function of P in the interval
,
n(P) being
a non-increasing function.
Based on the previous assumptions and taking Eq. (8) into account, the entropy H(n(P)),
or simply H(P), is a non-decreasing function of P in the interval
 :
:
Therefore, the entropy evolves, in terms of the parameter P, accordingly to the property
(12)
![\begin{figure}
\par\mbox{\includegraphics[height=5.5cm,width=8cm,clip]{12818fig1...
...m}
\includegraphics[height=5.5cm,width=8cm,clip]{12818fig2.eps} }\end{figure}](/articles/aa/full_html/2010/02/aa12818-09/img31.png)
|
Figure 1: ( Left) Stellar density N(P) in terms of the sampling parameter for a simulated univariate distribution, consisting of a superposition of four Gaussian populations. ( Right) Entropy graph of the mixture produced by scanning the whole sample. |
| Open with DEXTER | |
However, for a sample with three populations
![]() the behaviour of the function H(P)
is as follows. We assume that stars are continuously incorporated into the subsample S(P)
by increasing P. We also assume that all of the A1-population has been completely merged with the subsample
and that the A2-population is partially present in the subsample. Then, if a number of new stars is added to
S(P), one of the following situations may occur:
either the stars belong (or are very similar) to the population A2, in agreement with the situation described
above; or, obviously, the new stars belong to a new A3-population. In the latter case, when the number of stars
belonging to the new population is sufficiently significant and their kinematic parameters are significantly different
from those of the A2 and A1-populations, the bimodal segregation model should mix the two closest populations
A1 and A2 into the first component Pop-I, and should reserve the second component Pop-II
for the population A3. Therefore, a fourth condition for an ideal sampling parameter is required:
the behaviour of the function H(P)
is as follows. We assume that stars are continuously incorporated into the subsample S(P)
by increasing P. We also assume that all of the A1-population has been completely merged with the subsample
and that the A2-population is partially present in the subsample. Then, if a number of new stars is added to
S(P), one of the following situations may occur:
either the stars belong (or are very similar) to the population A2, in agreement with the situation described
above; or, obviously, the new stars belong to a new A3-population. In the latter case, when the number of stars
belonging to the new population is sufficiently significant and their kinematic parameters are significantly different
from those of the A2 and A1-populations, the bimodal segregation model should mix the two closest populations
A1 and A2 into the first component Pop-I, and should reserve the second component Pop-II
for the population A3. Therefore, a fourth condition for an ideal sampling parameter is required:
- (IV)
- a partition
 is reduced to the two-component partition
 ,
for a cumulative population
,
for a cumulative population
 .
In this case the relationship Eq. (10) is no more fulfilled.
Instead, the initial values n=1 and H(P)=0 are reset.
.
In this case the relationship Eq. (10) is no more fulfilled.
Instead, the initial values n=1 and H(P)=0 are reset.
3.3 Entropy graph
![\begin{figure}
\par\mbox{\includegraphics[height=7cm,width=4.8cm,angle=-90]{1281...
...includegraphics[height=7cm,width=4.8cm,angle=-90]{12818fig4.ps} }
\end{figure}](/articles/aa/full_html/2010/02/aa12818-09/img35.png)
|
Figure 2:
( Left) Detailed entropy graph for a HIPPARCOS sample (Paper I).
( Right) In a logarithmic plot, total dispersion |
| Open with DEXTER | |
The entropy may be plotted in terms of the sampling parameter so that, each time that a new population
enters the increasing subsamples S(P), a characteristic behaviour may be recognised in the graph.
This can be easily explained with an example of a three-population partition,
![]() .
There
exist a couple of values PA and PB corresponding to sampling parameter values for which the
second and third populations are recognised, respectively. Then, according to the conditions of the
preceding section, the following characteristic shapes are produced:
.
There
exist a couple of values PA and PB corresponding to sampling parameter values for which the
second and third populations are recognised, respectively. Then, according to the conditions of the
preceding section, the following characteristic shapes are produced:
- (a)
- if P<PA, then H(P)=0. The subsample S(P) then consists only of A1 stars;
- (b)
- if
 ,
then H(P)>0 and
,
then H(P)>0 and
 .
Thus, during the mixture of two populations A1 and A2, there is an interval with continuously
increasing entropy;
.
Thus, during the mixture of two populations A1 and A2, there is an interval with continuously
increasing entropy;
- (c)
- if P= PB, then H(P)=0 and n(P)=1. An entropy decline occurs when the cumulative
population
forms, that is when the new A3-population, which is different enough
from previous populations, is recognised.
If the above process occurs smoothly, increasing the size of the sample within the interval R defined in case (b), we should also be able to identify two specific behaviours that are associated with the following two regions:
- (R1)
- an interval of the sampling parameter for which H(P) is rapidly increasing, with a
relatively high slope.
This occurs for values of the sampling parameter that allow stars to be incorporated up to the core of the A2-population distribution. Therefore, in this region the mixing proportion varies significantly. Similarly, the kinematic estimates of the A2-population, Pop-II, will probably be unstable, since this population is just being detected, while those of Pop-I will remain mostly stable;
- (R2)
- an interval of the sampling parameter where H(P) slowly increases, or has a nearly vanishing slope. It resembles a plateau, where, towards the end, H(P) reaches a local maximum. This occurs when the sampling parameter scans the farther wing of the A2-population distribution. In this region, the mixing proportions may vary slightly depending on the width of the wings. For example, for very flattened distributions we could expect significant variations in the mixing proportion. In general, after incorporating the core distribution of the A2-population we obtain some stable kinematic parameters for Pop-I as well as for Pop-II within the plateau region.
This behaviour for a true stellar sample drawn from the HIPPARCOS catalogue is shown in Fig. 2. A detailed view of the entropy graph and the population kinematical parameters are displayed in terms of the sampling parameter, in this case the absolute heliocentric velocity. The plots are similar to those obtained for the segregation of thin and thick discs in Paper I. The plateau region allowing an optimal segregation of thin and thick discs (left plot) takes place for a sampling parameter between P=160 and 270 km s-1 (absolute heliocentric velocity). The total velocity dispersion (trace of the covariance matrix) for both disc populations is displayed (right plot). For 160< P <270, the thin disc (dashed line) exhibits an almost constant dispersion (in logarithmic scale), while the thick disc (continuous line) shows a slightly increasing rate, which is far more stable and smooth than before and after the plateau region of the entropy graph. In addition, the entropy H(P) exhibits several relative maxima along the plateau region, which are caused by the non-absolute continuity of the merging process.
The foregoing features can be easily extended to a greater number of populations, so that each entropy decline indicates a newly emerging population. For more than two populations, the information containing population is the entering one, which produces the entropy drop, while the previous populations become indistinguishable in the cumulative component Pop-I.
4 Minimum  error of the mixture approach
As explained in the introduction, a ![]() test, according to Eq. (3), may be used to
estimate the goodness of the approximation of the total moments in terms of the mixture obtained for each
set of values of the sampling parameter. The segregation method adopted in this study works with velocity moments of up to
fourth order (3 first-order moments, 6 second moments, 10 third moments, and 15 fourth moments, which consists of
34 relationships in total). The total moments are represented by a vector Mi of R=34
components, and are fitted with the kinematic parameters of populations (
test, according to Eq. (3), may be used to
estimate the goodness of the approximation of the total moments in terms of the mixture obtained for each
set of values of the sampling parameter. The segregation method adopted in this study works with velocity moments of up to
fourth order (3 first-order moments, 6 second moments, 10 third moments, and 15 fourth moments, which consists of
34 relationships in total). The total moments are represented by a vector Mi of R=34
components, and are fitted with the kinematic parameters of populations (![]() means and
means and ![]() covariances) together with the mixture proportions, to fulfil the overdeterminate set of
relationships in Eq. (2). Thus, an amount of
covariances) together with the mixture proportions, to fulfil the overdeterminate set of
relationships in Eq. (2). Thus, an amount of
![]() mixture parameters have to be estimated.
If
mixture parameters have to be estimated.
If
![]() denotes the error of moment Mi, the approximation can be calibrated
using the weighted mean of the squared errors, so that, when defining
denotes the error of moment Mi, the approximation can be calibrated
using the weighted mean of the squared errors, so that, when defining
![]() ,
we can write
,
we can write
The quadratic error
To apply the ![]() test, we assume that the total error has a 34-Gaussian probability distribution,
so that the random variate expressed in Eq. (13) is expected to be a
test, we assume that the total error has a 34-Gaussian probability distribution,
so that the random variate expressed in Eq. (13) is expected to be a ![]() distribution with
distribution with
![]() degrees of freedom. Also, if the errors are not represented by a Gaussian but
by a Poisson distribution, Eq. (13) obeys the
degrees of freedom. Also, if the errors are not represented by a Gaussian but
by a Poisson distribution, Eq. (13) obeys the ![]() distribution anyway in the large
limit q. It is then known that, if
distribution anyway in the large
limit q. It is then known that, if
![]() denotes its probability distribution,
the relevant quantity for making decisions about the goodness of the fit is the
denotes its probability distribution,
the relevant quantity for making decisions about the goodness of the fit is the ![]() probability,
given by the integral
probability,
given by the integral
which infers the probability that a function describing a set of q data points would give a value of
4.1 Fitting error
Our objective is to establish how the total quadratic error
![]() depends on the sampling
variances of the mixture parameters, that is, on the quadratic errors associated with either the mixture
proportions or the partial moment estimates. It is first studied in two simple cases, depending on
whether the parameter P scanning the sample S(P)
provides a sequence of subsamples that (a) maintain a nearly
constant mixture proportion, but produce some slightly unstable
kinematical estimates of populations, or (b) produce some
constant kinematic parameters, although the mixture proportion may
slightly vary.
depends on the sampling
variances of the mixture parameters, that is, on the quadratic errors associated with either the mixture
proportions or the partial moment estimates. It is first studied in two simple cases, depending on
whether the parameter P scanning the sample S(P)
provides a sequence of subsamples that (a) maintain a nearly
constant mixture proportion, but produce some slightly unstable
kinematical estimates of populations, or (b) produce some
constant kinematic parameters, although the mixture proportion may
slightly vary.
We recall that just after detecting a new population, we may expect in the region R1 of the entropy graph to see a significant variation in both mixture proportion and population kinematical parameters. Thus, the above cases may be expected in particular in the plateau region R2 of the entropy graph.
- (a)
- We assume that a sample consists of a mixture of N stars, of constant population sizes
N'=N n' and N''=N n'', where
 .
The sample partial moments M'i and M''i of each population may differ from their true distribution
moments
.
The sample partial moments M'i and M''i of each population may differ from their true distribution
moments  and
and  accordingly to the approximate sampling variances
![$V[M'_i]=\frac{{{\sigma'_i}}^2}{N'}$](/articles/aa/full_html/2010/02/aa12818-09/img61.png) and
and
![$V[M''_i]=\frac{{\sigma''_i}^{2}}{N''}$](/articles/aa/full_html/2010/02/aa12818-09/img62.png) ,
respectively, for large enough N' and N''.
Those quantities are the sampling variances of each partial moment, and the values
,
respectively, for large enough N' and N''.
Those quantities are the sampling variances of each partial moment, and the values
 and
and
 could be computed from higher-order distribution cumulants, if known.
Hence, as in the complete sample, the quantities
and
may be interpreted as
population standard deviations, which are associated with the mean values
and
of the real
populations, whose sample estimates are M'i and M''i.
Total sampling variance
could be computed from higher-order distribution cumulants, if known.
Hence, as in the complete sample, the quantities
and
may be interpreted as
population standard deviations, which are associated with the mean values
and
of the real
populations, whose sample estimates are M'i and M''i.
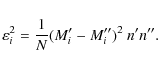
Total sampling variance
![$\varepsilon_i^{2}=V[M_i]$](/articles/aa/full_html/2010/02/aa12818-09/img65.png) may be obtained by writing Eq. (2) in the form
may be obtained by writing Eq. (2) in the form
and by taking the variances,
By using the proportions n', n'', and by writing![${\rm cov}[M'_i,M''_i]=\frac{\rho_i~{\sigma'_i}{\sigma''_i} }{\sqrt{N'N''}}$](/articles/aa/full_html/2010/02/aa12818-09/img67.png) in terms of
the corresponding correlation factor
in terms of
the corresponding correlation factor  ,
we have
,
we have
Hence, the calibration of the quadratic error obtained in Eq. (15) distributes the total error in terms of the population variances of the partial moments. Furthermore, it takes the likely dependence on each other into account.We point out a particular situation applying to our algorithm procedure. We assume that the variates M'i and M''i are independent, as happens in the plateau region R2 of the entropy graph, where M'i is nearly constant and M''i varies depending on the Pop-II stars entering the sample S(P). We then have
 .
Thus, we can simply write
.
Thus, we can simply write
 .
It is however useful to obtain an approximate expression of this error in terms of the product n' n'',
which takes values in the interval
.
It is however useful to obtain an approximate expression of this error in terms of the product n' n'',
which takes values in the interval
![$[0,\frac14]$](/articles/aa/full_html/2010/02/aa12818-09/img72.png) (when assuming that
(when assuming that
 ). Obviously,
we can write
). Obviously,
we can write
 and
and
 .
The square root can be approximated by a first degree
polynomial in terms of n' n'', so that
.
The square root can be approximated by a first degree
polynomial in terms of n' n'', so that
 ,
corresponding to the two
first terms of a McLaurin series
,
corresponding to the two
first terms of a McLaurin series![[*]](/icons/foot_motif.png) .
We then derive the calibration error,
.
We then derive the calibration error,
On the other hand, Eq. (2) can be interpreted in terms of the true distribution moments, instead of sample moments, with constant mixture proportions. The exact total distribution moments are estimated from their partial values as
Therefore, the value
must be considered to be constant, although there may be some uncertainty between
the partial moments. In addition, the partial moments are assumed to be independent. Hence,
distributing the error between both populations may be achieved by differentiating Eq. (18), so that
 ,
and by taking the variances,
,
and by taking the variances,
Thus, the population variance of the moment ,
corresponding to the major
population Pop-I, has a smaller error, while the population variance
of the moment ,
corresponding to the major
population Pop-I, has a smaller error, while the population variance
 of
the moment ,
corresponding to the minor population Pop-II, is expected to have a
greater uncertainty
.
Therefore, we may assume that the
following relationship is satisfied
of
the moment ,
corresponding to the minor population Pop-II, is expected to have a
greater uncertainty
.
Therefore, we may assume that the
following relationship is satisfied
- (b)
- We now assume some constant partial moment estimates, but a varying mixture proportion
along the plateau region. The calibration error
 may then be estimated in terms of
the variance of mixture proportion as follows.
By increasing the sampling parameter, we select a number of stars to produce a sample S(P).
If the sample is large enough, for the ith entering star, we can define a Bernoulli random
variate Ii with two possible outcomes, 1 or 0, depending on whether the star belongs
to either Pop-I, the major population, or Pop-II, the minor population.
Obviously, the expected value of Ii is n' and the variance is n' n''. The cumulative
frequency of stars belonging to Pop-I,
may then be estimated in terms of
the variance of mixture proportion as follows.
By increasing the sampling parameter, we select a number of stars to produce a sample S(P).
If the sample is large enough, for the ith entering star, we can define a Bernoulli random
variate Ii with two possible outcomes, 1 or 0, depending on whether the star belongs
to either Pop-I, the major population, or Pop-II, the minor population.
Obviously, the expected value of Ii is n' and the variance is n' n''. The cumulative
frequency of stars belonging to Pop-I,
 ,
then follows a binomial distribution with
mean
E[XN]=N n'=N' and variance
V[XN]=N n' n''.
Similarly, for stars belonging to Pop-II, the random variate
YN=N-XN=N'' verifies that
E[YN]=N n''=N'',
V[YN]=N n' n'', and
,
then follows a binomial distribution with
mean
E[XN]=N n'=N' and variance
V[XN]=N n' n''.
Similarly, for stars belonging to Pop-II, the random variate
YN=N-XN=N'' verifies that
E[YN]=N n''=N'',
V[YN]=N n' n'', and
![${\rm cov}[X_N,Y_N]=-N n' n'' $](/articles/aa/full_html/2010/02/aa12818-09/img87.png) .
.
We note that this is not exactly as stated, since the sample is finite. The true distribution of the variate XN should be of hypergeometric type, but since the size N is large we can assume the binomial hypothesis in nearly all the continuous regions of the entropy graph. In any case, when all the population Pop-II stars are merged with the subsample, the variances V[XN] and V[YN] are null.
Thus, in a region of the entropy graph where the kinematic population parameters remain approximately constant, if the error associated with Eq. (15) is caused only by the uncertainty in the mixture proportion, by applying the law of the combination of errors, we obtain
which may be written as
Hence
By dividing the above equation by N2 and rearranging the terms, we obtain the calibration error
In this case, we also obtain a sampling variance that is proportional to the inverse of the sample size, but, in addition, this calibration error depends on two factors, one of them involving the sample estimates of the mixture. It increases as both partial moments become more differentiated. Another factor is, again, the product n' n''. At the end of the plateau region,
vanishes since n''=0.
![\begin{displaymath}N^2 V[M_i]\!=\!N'^2 V[M'_i]+ N''^2 V[M''_i]+ 2 N'\!N'' {\rm cov}[M'_i,\!M''_i].
\end{displaymath}](/articles/aa/full_html/2010/02/aa12818-09/img66.png)
![\begin{displaymath}\varepsilon_i^{2}= \frac{1}{N}\left[n' {\sigma'_i}^{2}+ n'' {...
..._i}^{2}+ 2 \sqrt{n'n''}\rho_i~{\sigma'_i}{\sigma''_i} \right].
\end{displaymath}](/articles/aa/full_html/2010/02/aa12818-09/img69.png)
![\begin{displaymath}\varepsilon_i^{2}= \frac{1}{N}\left[{\sigma'_i}^{2}+ \left({\sigma''_i}^{2}- {\sigma'_i}^{2}\right)~ n'n''\right].
\end{displaymath}](/articles/aa/full_html/2010/02/aa12818-09/img79.png)

4.2
graph
In the plateau region of the entropy graph, we may assume that
- (i)
- the mixture proportion and the kinematic parameters are independent variables, where both population parameters and mixture proportion may vary separately, depending on the randomly entering stars;
- (ii)
- the kinematic parameters of the major population Pop-I are nearly constant, while the Pop-II kinematic parameters may vary slightly and smoothly, as shown in Fig. 2 for the HIPPARCOS sample. Therefore, both M'i and M''i are also independent variates, with vanishing covariances.
![\begin{displaymath}\varepsilon_i^{2}= \frac{1}{N} \left({\sigma'_i}^{2} + \left[...
...right) + \left(M''_i - M'_i\right)^2 \right] ~ n' n'' \right).
\end{displaymath}](/articles/aa/full_html/2010/02/aa12818-09/img91.png)
To express the calibration error in terms of the entropy, the factor n' n''can be written in the following form. If the entropy H(n') of Eq. (7) is approximated by a Lagrange polynomial L(n') with matching values at points (0,H(0)),
then allows Eq. (26) to be approximated in terms of the entropy H(n'). In this case, the calibration error in Eq. (15) becomes
![\begin{displaymath}\varepsilon_i^{2}= \frac{1}{N} \left({\sigma'_i}^{2} + \frac{...
...igma'_i}^{2}\right) + (M''_i - M'_i)^2 \right] ~H(n') \right).
\end{displaymath}](/articles/aa/full_html/2010/02/aa12818-09/img95.png)
By taking into account Eq. (21) and the positiveness of the terms in Eq. (28), we can write the above equation in terms of the entropy associated with the sampling parameter P in the simpler form
![\begin{displaymath}\varepsilon_i^{2}= \frac{1}{N} \left[{A}_i^{2} + {B}_i^{2} ~H(P)\right].
\end{displaymath}](/articles/aa/full_html/2010/02/aa12818-09/img96.png)
The above quantities defined as
Therefore, based on those assumptions, and after combining Eqs. (13) and (29) in the region R2, the behaviour of ![]() as a function of
either the sampling parameter P or the entropy H can be explained.
Thus, by taking the derivative of Eq. (13) and considering Eq. (29), we have
as a function of
either the sampling parameter P or the entropy H can be explained.
Thus, by taking the derivative of Eq. (13) and considering Eq. (29), we have
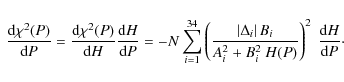
Since the summation terms are always positive, we then have the relationship
Therefore, while varying the sampling parameter P in a plateau region, an increasing entropy is always associated with a decreasing
Outside the plateau region, different results are obtained. At the beginning of the region R1, where there is a sudden influx of a new population, the above assumptions may not be valid.
Therefore, the optimal sampling parameter should provide:
(1) one or several local maxima of entropy within the plateau region of the entropy graph,
which are indicative of the least informative subsamples associated with the more representative mixture parameters;
and (2) one or several simultaneous minimums of the ![]() fitting error, associated with the optimal
segregations. Thus, in the preceding circumstances, the ``more representative'' subsample
is also the one providing the least error in the mixture approach.
fitting error, associated with the optimal
segregations. Thus, in the preceding circumstances, the ``more representative'' subsample
is also the one providing the least error in the mixture approach.
5 Application
The described procedure is first applied to the HIPPARCOS sample used in Paper I to illustrate the improvement that it provides in the results. Furthermore, it is also applied to the disc-representative GCS sample, which has a similar number of stars to the HIPPARCOS sample, but with more accurate estimations of the radial velocities.
5.1 HIPPARCOS sample
Table 1:
Optimal mixture parameters![]() for the HIPPARCOS (HIP) and GCS samples.
for the HIPPARCOS (HIP) and GCS samples.
The application of the MEMPHIS algorithm to the HIPPARCOS sample in Paper I provided a precise kinematic description of the thin and thick disc populations. The absolute value of the total space motion referred to either the Sun or the centroid of the major population were used as sampling parameters, although the qualitative results were similar. Within the thin disc, two non-Gaussian subpopulations, early-type and young-disc stars, were found to have a strong asymmetry in their radial velocity distribution. These populations, in addition to the background old disc stars, represent the entire thin disc with a nearly Gaussian distribution. Since no previous selection to exclude non-typical disc stars was attempted, the total thin disc population represented stars affected by several different phenomena over its stars, such as moving groups originating in other Galactic regions, produced cluster evaporation, disc heating, spiral bar perturbations, so that its final normal distribution provides a good example of what the Central Limit Theorem predicts.
5.1.1 Sampling parameters P=|(U,V,W)| and P=|W|
By using the heliocentric velocity
P=|(U,V,W)| as a sampling parameter, from the value
P=145 km s-1 onward, both disc populations were described well by a mixture of two
Gaussian populations, where the thin disc velocity dispersions become saturated around
![]() km s-1. For those subsamples, increasing the sampling parameter leads to
new stars entering contribute only to increase the dispersion in the thick disc. An entropy maximum at
P=209 provides an optimal mixture consisting of about
km s-1. For those subsamples, increasing the sampling parameter leads to
new stars entering contribute only to increase the dispersion in the thick disc. An entropy maximum at
P=209 provides an optimal mixture consisting of about ![]() of thick disc stars with dispersions of
of thick disc stars with dispersions of
![]() .
However, we were unable to detect the halo population.
.
However, we were unable to detect the halo population.
![\begin{figure}
\par\includegraphics[angle=-90,width=5cm,clip]{12818fig5.ps}
\end{figure}](/articles/aa/full_html/2010/02/aa12818-09/img126.png)
|
Figure 3:
Entropy graph (continuous line) and |
| Open with DEXTER | |
![\begin{figure}
\par\mbox{\includegraphics[width=5cm,angle=-90,clip]{12818fig6.ps...
...ce{4mm}
\includegraphics[width=5cm,angle=-90,clip]{12818fig8.ps} }\end{figure}](/articles/aa/full_html/2010/02/aa12818-09/img127.png)
|
Figure 4: Diagonal central velocity moments (in logarithmic plots) in terms of the sampling parameter P=|(U,V,W)| for populations segregated from several nested HIPPARCOS subsamples (dashed line for Pop-I and continuous line for Pop-II). The diagonal moments correspond to the velocity components U ( left), V ( centre), and W ( right). The value P=230 km s-1 (squares) provides optimal mixture estimates for thin and thick discs. |
| Open with DEXTER | |
By combining both optimal criteria, the whole sample can be scanned with the improved algorithm up
to P=600 km s-1. We identify local extremes of ![]() and entropy at P=230,
just before a steep decline in entropy, and we also find a local minimum of
and entropy at P=230,
just before a steep decline in entropy, and we also find a local minimum of ![]() at P=410, as shown
in Fig. 3. We note the opposite trend of
at P=410, as shown
in Fig. 3. We note the opposite trend of ![]() and entropy around those values, mainly around P=230,
in what can be considered a plateau region of the entropy graph.
Nevertheless, after P=300 there is no plateau region, since the entropy mostly decreases.
For P>230, stars originating in the new halo population are merged with the increasingly large subsamples, an
entropy decline occurring around P=280, in accordance with a peak of
and entropy around those values, mainly around P=230,
in what can be considered a plateau region of the entropy graph.
Nevertheless, after P=300 there is no plateau region, since the entropy mostly decreases.
For P>230, stars originating in the new halo population are merged with the increasingly large subsamples, an
entropy decline occurring around P=280, in accordance with a peak of ![]() .
Afterwards, the
component Pop-I wraps around the entire disc, while halo stars are confined to Pop-II.
Therefore, the value P=230 provides an improved optimal mixture estimate for thin and thick discs.
The mixture proportion, dispersions, differential mean velocity, and vertex deviation are shown in
Table 1. The value P=410 might represent a first estimate for a total disc and halo mixture.
The variation in the diagonal central velocity moments with sampling parameter is shown in Fig. 4
(in a logarithmic plot), where we see that the disc heating process remains nearly constant
after P=410 (Pop-I, dashed line). The halo moments do not reach steady values.
.
Afterwards, the
component Pop-I wraps around the entire disc, while halo stars are confined to Pop-II.
Therefore, the value P=230 provides an improved optimal mixture estimate for thin and thick discs.
The mixture proportion, dispersions, differential mean velocity, and vertex deviation are shown in
Table 1. The value P=410 might represent a first estimate for a total disc and halo mixture.
The variation in the diagonal central velocity moments with sampling parameter is shown in Fig. 4
(in a logarithmic plot), where we see that the disc heating process remains nearly constant
after P=410 (Pop-I, dashed line). The halo moments do not reach steady values.
If we use the alternative sampling parameter P=|W|, which is the absolute value of the star velocity
perpendicular to the Galactic plane, we obtain the entropy and ![]() plots displayed in Fig. 5. There is a small
plateau region in the entropy graph with a small local minimum of
plots displayed in Fig. 5. There is a small
plateau region in the entropy graph with a small local minimum of ![]() around P=65 km s-1,
although no significant corresponding trend in both graphs. The
around P=65 km s-1,
although no significant corresponding trend in both graphs. The ![]() graph mainly
decreases up to P=90. For P=65, the velocity moments measure the typical perpendicular velocity dispersion
of thin and thick disc stars, whereas the other velocity dispersions have values that correspond to a
mixture of disc stars, Pop-I, and halo stars Pop-II. On the other hand, contrasting behaviour is evident in both
plots around P=170, where a plateau region in the entropy graph clearly begins. In this region,
both graphs become stable, and around P=180 and P=250 small local extrema are evident.
The diagonal central moments plotted in terms of the sampling parameter (not shown) indicate that halo
and disc velocity dispersions clearly reach asymptotic values. Therefore, we can take P=180, and its
minimum
graph mainly
decreases up to P=90. For P=65, the velocity moments measure the typical perpendicular velocity dispersion
of thin and thick disc stars, whereas the other velocity dispersions have values that correspond to a
mixture of disc stars, Pop-I, and halo stars Pop-II. On the other hand, contrasting behaviour is evident in both
plots around P=170, where a plateau region in the entropy graph clearly begins. In this region,
both graphs become stable, and around P=180 and P=250 small local extrema are evident.
The diagonal central moments plotted in terms of the sampling parameter (not shown) indicate that halo
and disc velocity dispersions clearly reach asymptotic values. Therefore, we can take P=180, and its
minimum ![]() error, to be the optimal sampling parameter characterising the mixture of disc and halo
stars (Table 1), although there is no significant difference in our results when other neighbouring values
are used instead.
error, to be the optimal sampling parameter characterising the mixture of disc and halo
stars (Table 1), although there is no significant difference in our results when other neighbouring values
are used instead.
Thus, P=|W| is inappropriate for distinguishing between thin and thick discs but is suitable for discriminating between total disc and halo stars. This behaviour is also observed for the differential mean velocities, where the estimation provided by the parameter P=|W| is completely stable from P=80 onward.
5.1.2 Titius-Bode-like law for the halo
It is interesting that the estimate of the radial velocity dispersion of the halo
obtained from the HIPPARCOS sample confirms the Titius-Bode-like law (TBLL)
proposed in Paper I (Table 6) for the same sample. This empirical law was written there as
![]() .
The value x=2 corresponds to the radial velocity dispersion of the early-type stars, 12 km s-1,
the value x=5 to the radial velocity dispersion of the
thin disc, 28 km s-1, which has now been verified, the value x=8 to the radial velocity
dispersion of the thick disc, 66 km s-1, which has also been confirmed, and the value
x=11 to the radial velocity dispersion of the halo, 156 km s-1, which is exactly the value
presented in Table 1. We are still unable to provide any additional comment to those of Paper I about a physical
explanation of this empirical law, but we may certainly certify this relationship, and associate the discrete
local stellar populations with the radial dispersions expressed by the equation
.
The value x=2 corresponds to the radial velocity dispersion of the early-type stars, 12 km s-1,
the value x=5 to the radial velocity dispersion of the
thin disc, 28 km s-1, which has now been verified, the value x=8 to the radial velocity
dispersion of the thick disc, 66 km s-1, which has also been confirmed, and the value
x=11 to the radial velocity dispersion of the halo, 156 km s-1, which is exactly the value
presented in Table 1. We are still unable to provide any additional comment to those of Paper I about a physical
explanation of this empirical law, but we may certainly certify this relationship, and associate the discrete
local stellar populations with the radial dispersions expressed by the equation
![\begin{figure}
\par\includegraphics[width=5cm,angle=-90,clip]{12818fig9.ps}
\end{figure}](/articles/aa/full_html/2010/02/aa12818-09/img130.png)
|
Figure 5:
Entropy (continuous line) and |
| Open with DEXTER | |
5.2 GCS sample
We compare the previous results with those of the Geneva-Copenhagen survey catalogue (Nordtröm et al. 2004). The same cartesian heliocentric coordinates system (U,V,W) is used. The sample represents the velocity space of 13 240 F and G dwarf stars, which are considered to be optimal tracer populations for studying the stellar evolutionary history of the disc. According to its authors, the GCS catalogue might be a kinematically unbiased sample, containing about 97% of stars in the thin disc and 3% in the thick disc. Nevertheless, according to Famaey et al. (2007), some contamination by the halo may exist, which could be removed by considering only stars with [Fe/H]>-0.5. For our purposes, and as for the HIPPARCOS sample, this contamination could be useful when measuring the kinematic parameters of the three populations.
We now comment on the composition of the sample. At first, the selection of stars of only
specific spectral types could be indicative of kinematical bias in the sample.
The velocity distribution in the V component is not as bell-shaped and bimodal
as it is in the HIPPARCOS sample. In contrast, the U and W velocity distributions are quite
bell-shaped, although the HIPPARCOS distributions have higher peaks.
In any case, the MEMPHIS method may provide a good approximation for slightly non-Gaussian partial
distributions and robust estimates of the mixture proportions and velocity moments of populations.
For the GCS samples, it is also possible to recognise the substructure of early-type and young disc stars
within the thin disc, as described in Paper I for the HIPPARCOS sample.
The discontinuity between these populations also occurs at
![]() km s-1, although the subpopulations are
strongly non-Gaussian, mainly in the radial direction. However, once the number of thin disc stars that has been
added to the nested subsamples
is sufficiently high for it to resemble a Gaussian distribution, and the number of thick disc
stars is also enough high to allow us to identify an independent population, the segregation can be reliably performed.
km s-1, although the subpopulations are
strongly non-Gaussian, mainly in the radial direction. However, once the number of thin disc stars that has been
added to the nested subsamples
is sufficiently high for it to resemble a Gaussian distribution, and the number of thick disc
stars is also enough high to allow us to identify an independent population, the segregation can be reliably performed.
5.2.1 Sampling parameters P=|(U,V,W)| and P=|W|
If we use the sampling parameter
P=|(U,V,W)|, we identify a local minimum of ![]() at P=230 km s-1,
that coincides with a local maximum of entropy. An opposite trend in both graphs
does not appear until P=300. After the initial high entropy levels there is not any plateau region in
the entropy graph. For the diagonal moments, by comparing with HIPPARCOS results
we find that at P=230 the algorithm really detects, but not in the same stable way,
a mixture of thin (96%) and thick (4%) discs (Table 1),
while for P>350 the algorithm indeed detects continuously merging of halo stars in the Pop-II component,
up to the end of the whole sample (ca. 1% of halo stars).
at P=230 km s-1,
that coincides with a local maximum of entropy. An opposite trend in both graphs
does not appear until P=300. After the initial high entropy levels there is not any plateau region in
the entropy graph. For the diagonal moments, by comparing with HIPPARCOS results
we find that at P=230 the algorithm really detects, but not in the same stable way,
a mixture of thin (96%) and thick (4%) discs (Table 1),
while for P>350 the algorithm indeed detects continuously merging of halo stars in the Pop-II component,
up to the end of the whole sample (ca. 1% of halo stars).
If the absolute velocity perpendicular to the Galactic plane P=|W| is used as sampling parameter,
improvements are achievable. The entropy graph shows a peak at P=60 km s-1 and a clear
plateau region for P>140, with simultaneous extrema ![]() and entropy at P=170,
where both plots exhibit opposite trends. As for the HIPPARCOS sample, the value
P=60 only separates thin and thick disc stars in terms of the W-velocity component,
while in other velocity components it assigns a mixture of thick disc and halo to the second population Pop-II.
In contrast, for P=170 and higher values, the algorithm provides an optimal segregation
of disc (99%) and halo (1%). The optimal estimates are listed in Table 1.
This segregation is consistent with the measured differential mean velocities, where the stability
of estimates for P=|W| contrasts with those of
P=|(U,V,W)|.
and entropy at P=170,
where both plots exhibit opposite trends. As for the HIPPARCOS sample, the value
P=60 only separates thin and thick disc stars in terms of the W-velocity component,
while in other velocity components it assigns a mixture of thick disc and halo to the second population Pop-II.
In contrast, for P=170 and higher values, the algorithm provides an optimal segregation
of disc (99%) and halo (1%). The optimal estimates are listed in Table 1.
This segregation is consistent with the measured differential mean velocities, where the stability
of estimates for P=|W| contrasts with those of
P=|(U,V,W)|.
Table 2:
Segregation of populations![]() for HIPPARCOS and
GCS samples.
for HIPPARCOS and
GCS samples.
5.2.2 Sampling parameters P=|(U,W)| and P=|V|
We present the results obtained by using alternative sampling parameters. The sampling parameter
P=|(U,W)|, which is related to a combination of the two basic integrals.
Around P=200 km s-1 and for P>250, the entropy and the ![]() error exhibit opposite trends, although there is no clear plateau region in the entropy graph.
The two local extrema, at P=200 and 280, reflect the mixture of thin disc stars in Pop-I and
thick disc plus halo stars in Pop-II. This is consistent with the diagonal central moments.
On the other hand, the rotation differential mean velocities between populations is typical of halo
stars in all of the plateau region of the entropy graph. Around P=320,
there are some moving groups with antigalactic rotation (the null rotation would correspond to
error exhibit opposite trends, although there is no clear plateau region in the entropy graph.
The two local extrema, at P=200 and 280, reflect the mixture of thin disc stars in Pop-I and
thick disc plus halo stars in Pop-II. This is consistent with the diagonal central moments.
On the other hand, the rotation differential mean velocities between populations is typical of halo
stars in all of the plateau region of the entropy graph. Around P=320,
there are some moving groups with antigalactic rotation (the null rotation would correspond to
![]() km s-1). This is similar to the behaviour that we find when we use the perpendicular
velocity as a sampling parameter between P=80 and 100. Once more, for the greatest values of the
sampling parameter, the halo is approximately at rest.
km s-1). This is similar to the behaviour that we find when we use the perpendicular
velocity as a sampling parameter between P=80 and 100. Once more, for the greatest values of the
sampling parameter, the halo is approximately at rest.
Alternatively, the sampling parameter P=|V|, which is related to the angular momentum integral, provides a
![]() error that decreases, while the entropy has a distinctive local maximum at P=100 km s-1.
Hereafter, both plots exhibit the same decreasing trend. There is no clear plateau region in the entropy
graph. In terms of the velocity moments, the segregation obtained from this maximum entropy value
corresponds to a mixture of thin and thick disc, similar to that obtained when using the
sampling parameter
P=|(U,V,W)|. Moments that are typical of a disc and halo mixture are obtained for the entire
scanned sample. A similar interpretation applies to the differential mean velocities.
The differential rotation velocity basically increases up to a typical value of about 220 km s-1, or closer to values such as 235 km s-1 (Orlov et al. 2006).
error that decreases, while the entropy has a distinctive local maximum at P=100 km s-1.
Hereafter, both plots exhibit the same decreasing trend. There is no clear plateau region in the entropy
graph. In terms of the velocity moments, the segregation obtained from this maximum entropy value
corresponds to a mixture of thin and thick disc, similar to that obtained when using the
sampling parameter
P=|(U,V,W)|. Moments that are typical of a disc and halo mixture are obtained for the entire
scanned sample. A similar interpretation applies to the differential mean velocities.
The differential rotation velocity basically increases up to a typical value of about 220 km s-1, or closer to values such as 235 km s-1 (Orlov et al. 2006).
5.3 Precise determination of mixture proportions
Determining the relative importance of the different kinematical
components has an intrinsic uncertainty caused by the segregation
method itself. For mixtures of pure normal populations, the segregation
is performed with a high degree of accuracy, of about ![]() ,
as tested by using simulated samples in Paper II.
In general, the error depends on the Gaussianity of the components. Otherwise, if a non-pure normal
population is approximated by a Gaussian distribution alone, as in the case of a cumulative population
Pop-I, containing thin and dick discs, the uncertainty in the mixture proportion may increase.
Once the kinematic parameters of the three populations have been determined, to ascertain mixture proportions
more accurately we apply an iterative method based on the Bayesian probability of a
star belonging to any particular population.
,
as tested by using simulated samples in Paper II.
In general, the error depends on the Gaussianity of the components. Otherwise, if a non-pure normal
population is approximated by a Gaussian distribution alone, as in the case of a cumulative population
Pop-I, containing thin and dick discs, the uncertainty in the mixture proportion may increase.
Once the kinematic parameters of the three populations have been determined, to ascertain mixture proportions
more accurately we apply an iterative method based on the Bayesian probability of a
star belonging to any particular population.
By using the mixture proportions given in Table 1 as initial values, we describe
the total velocity distribution function as the mixture
where the populations
By applying Bayes' theorem, we then compute the probability for each star of the sample of belonging to any of these populations, on the basis of its actual velocity,
and then evaluate the expected value y=E(i|v) of the index i representing the populations,
which takes continuous values in the interval [1,3].
We may assume that the value y is uniformly distributed within the interval [1,3]. Then, if
![]() the star has a higher probability of belonging to the halo population A1,
if
the star has a higher probability of belonging to the halo population A1,
if
![]() the star should belong to the thin disc A2, and if
the star should belong to the thin disc A2, and if
![]() it is
assigned to the thin disc A3. Thus, the stars are now labelled according to their most likely population.
We then determine the mixture proportions. These values are substituted into Eqs. (33) and (35), and the process is iterated up to convergence.
it is
assigned to the thin disc A3. Thus, the stars are now labelled according to their most likely population.
We then determine the mixture proportions. These values are substituted into Eqs. (33) and (35), and the process is iterated up to convergence.
For both samples, the mixture proportions become stable after 4 iterations, by leading to the values Table 2. Figure 6 displays the expected value y in terms of the number of stars on a logarithmic scale, where three clearly defined levels can be discerned that correspond to the classification of most of the stars into three discrete populations.
![\begin{figure}
\par\mbox{\includegraphics[width=5.8cm,clip]{12818fig10.ps}\hspace{4mm}
\includegraphics[width=5.8cm,clip]{12818fig11.ps} }
\end{figure}](/articles/aa/full_html/2010/02/aa12818-09/img191.png)
|
Figure 6: Expected value y in terms of the number of stars (in logarithmic scale). HIPPARCOS on the left and GCS on the right. |
| Open with DEXTER | |
The resulting thin disc, thick disc, and halo components are shown in Fig. 7 for the HIPPARCOS sample. We obtain similar plots for the GCS sample. This classification of stars into population samples allows us to compute the sample moments of thin disc, thick disc, and halo according to Table 2, which provide very similar values of kinematic parameters to those found for population samples drawn from both catalogues.
We note that the resulting population samples depend on the way of assigning the population
representative range to the expected value y. Thus, if instead of assuming that the boundaries between
populations are given by 1, 1.67, 2.33, and 3, which correspond to a uniform distribution of y, we had assumed
boundaries corresponding to equidistant points from 1, 2 and 3, i.e.,
ranges between 1, 1.5, 2.5, and 3, we would have obtained population fractions of t ![]() ,
T
,
T ![]() ,
and H
,
and H ![]() for
HIPPARCOS, and t
for
HIPPARCOS, and t ![]() ,
T
,
T ![]() ,
and H
,
and H ![]() for GCS. However, we propose that the former
choice is more plausible.
for GCS. However, we propose that the former
choice is more plausible.
We note the differences between Tables 1 and 2. Table 1 describes the population distribution parameters that are consistent with the mixture model. In particular, the rotation velocity dispersions have greater uncertainties because they are constrained by the differential rotation velocity between populations. Therefore, the uncertainties are the consequence of applying error propagation techniques to the mixture model. On the other hand, Table 2 lists the population sample moments, which are obtained by segregating the whole samples according to the population distribution moments of Table 1. Thus, the standard errors are sampling variances that do not reflect the mixture model.
![\begin{figure}
\par\mbox{\includegraphics[width=5cm,clip]{12818fig12.ps}\hspace{...
....ps}\hspace{4mm}
\includegraphics[width=5cm,clip]{12818fig17.ps} }\end{figure}](/articles/aa/full_html/2010/02/aa12818-09/img198.png)
|
Figure 7: Distribution of thin disc ( left), thick disc ( centre), and halo ( right) for the HIPPARCOS sample. The distribution on the plane UV of heliocentric velocities is shown in the first row, and on the plane VW in the second row. |
| Open with DEXTER | |
6 Method of Galactocentric orbits
A good way of describing the motion of a star belonging to the Milky Way is to calculate its Galactocentric orbit. This approach has been used by various authors (e.g., Altmann 2006 and references therein). Galactocentric orbits have often been used to classify stars into Galactic subsystems such as the bulge, the thin disc, the thick disc, and the halo (e.g., Pauli et al. 2006; Vidojevic & Ninkovic 2008, 2009).
In our calculation of Galactocentric orbits, we use the model of the Milky Way proposed by one of us (Ninkovic 1992). This model assumes three contributors to the potential of the Milky Way: the bulge, the disc, and the corona (the subsystem consisting of dark matter). The contributions to the Galactic potential of the former two are described by the same formula, that of Miyamoto & Nagai (1975). The only difference concerns the values of the parameters. The potential of the Milky Way, represented by the sum of its three contributors, must not be applied beyond the distance of 70 kpc. Outside the Galactocentric sphere of 70 kpc radius, the formula describing the contribution of the corona to the Galactic potential is different: it becomes the point-mass potential with one parameter only, the total mass of the corona. It should be said that in Nordström et al. (2004) the Galactocentric orbits of the GCS sample were computed, but the Galactic potential and the parameters are different from those used here.
For a stationary and axially symmetric potential, the two classical integrals of motion are
valid: those of energy and angular momentum component along the symmetry axis. This circumstance is
taken into account by including the expression for the angular momentum in the Lagrange second-order
differential equation describing the motion in R (distance to the symmetry axis). We have to solve two
second-order differential equations in R and in Z (Z axis is that of symmetry). To
obtain the initial conditions, we convert the heliocentric space coordinates and the corresponding
velocity components, given in the standard frame along the directions
![]() and
and
![]() ,
,
![]() and
and
![]() ,
and
,
and
![]() ,
into the corresponding Galactocentric ones. We assume that
the Sun is situated at
,
into the corresponding Galactocentric ones. We assume that
the Sun is situated at
![]() kpc,
kpc,
![]() kpc. As for the velocity components,
it is assumed that in the adopted frame the solar motion with respect to the LSR is given by
10.00 km s-1, 5.23 km s-1, and 7.17 km s-1, respectively (Dehnen & Binney 1998).
For the LSR speed around the Galactic centre, it is assumed to be equal to 220 km s-1 (local circular
speed) according to the model developed following the IAU recommendation (Kerr & Lynden-Bell 1986).
kpc. As for the velocity components,
it is assumed that in the adopted frame the solar motion with respect to the LSR is given by
10.00 km s-1, 5.23 km s-1, and 7.17 km s-1, respectively (Dehnen & Binney 1998).
For the LSR speed around the Galactic centre, it is assumed to be equal to 220 km s-1 (local circular
speed) according to the model developed following the IAU recommendation (Kerr & Lynden-Bell 1986).
To solve numerically the two differential equations, we apply the Dormand-Prince algorithm (Dormand &
Prince 1980) based on the fourth-order Runge-Kutta method. The other integral of motion, that of
energy, is used to maintain the precision of the numerical procedure at
![]() .
The numerical integration covers a time interval of ten billion years.
The output data are the moments of time, the corresponding values of the two coordinates R and Z,
and the values of the energy per unit mass.
.
The numerical integration covers a time interval of ten billion years.
The output data are the moments of time, the corresponding values of the two coordinates R and Z,
and the values of the energy per unit mass.
The sequence of R, Z values taken for the same time yields the projection of an orbit onto the
meridional plane. As a dimensionless measure of deviations from the plane of symmetry in the motion of a
test particle, one can use the so-called vertical eccentricity (see Vidojevic & Ninkovic 2009)
where
The planar eccentricity,
![]() ,
a dimensionless measure of deviations from circular motion in
the plane of symmetry, is defined as
,
a dimensionless measure of deviations from circular motion in
the plane of symmetry, is defined as

6.1 Detachment of halo stars and separation between the thick disc and the thin disc
We assume that any star crossing the boundary of 70 kpc adopted in the model of the Galaxy is a halo
star. There are 13 such stars in the sample, of which 5 have angular momentum that differs from that of
the Galactic rotation. Also, 26 other sample stars with a Galactocentric V component of opposite sign
to that of the Galactic rotation are classified as halo stars. Stars of the Galactic disc
are expected to move around the Galactic centre in nearly planar orbits so their vertical eccentricities
should not be significant. For this reason, 25 stars in the sample with
![]() are classified as
halo stars. In the case of nearly planar orbits, stars of the disc are not expected to have a very high
interval of R so a limit to the planar eccentricity should also exist. So 10 sample stars with
are classified as
halo stars. In the case of nearly planar orbits, stars of the disc are not expected to have a very high
interval of R so a limit to the planar eccentricity should also exist. So 10 sample stars with
![]() are classified halo stars. There is one sample star (HD 80258 = HIP 44800) that,
despite belonging to the halo according to any criterion given above, is assigned to the halo
because its highest Z amplitude takes place almost in the middle of the interval in R. Therefore,
we finally identify 75 (about 0.5%) halo stars.
are classified halo stars. There is one sample star (HD 80258 = HIP 44800) that,
despite belonging to the halo according to any criterion given above, is assigned to the halo
because its highest Z amplitude takes place almost in the middle of the interval in R. Therefore,
we finally identify 75 (about 0.5%) halo stars.
The remaining stars belong to the Galactic disc. The variations in the shape and size of Galactocentric
orbits for stars of the Galactic disc are correlated with their eccentricities, and for sufficiently high values of both
![]() and
and
![]() ,
the sides of the orbital trapezia become curvilinear. We identified an
approximate border where curving of the sides of orbital trapezia begins. We present this border as a
broken line in the
,
the sides of the orbital trapezia become curvilinear. We identified an
approximate border where curving of the sides of orbital trapezia begins. We present this border as a
broken line in the
![]() versus
versus
![]() plot for the disc stars (Fig. 8).
The equations of the straight lines containing the segments are
plot for the disc stars (Fig. 8).
The equations of the straight lines containing the segments are
![\begin{displaymath}\begin{array}{ll}
e_{\rm {p}} \in [0, 0.2]: & e_{\rm {v}}=-0....
...n [0.2, 0.5]: & e_{\rm {v}}=-0.33~e_{\rm {p}}+0.17.
\end{array}\end{displaymath}](/articles/aa/full_html/2010/02/aa12818-09/img217.png)
|
(39) |
The vertex occurs at (0.2, 0.1). The points lying inside this broken line, 12,566 (95%), represent the stars of the thin disc, those lying outside it, 599 (4.5%), the thick-disc ones. The elements of the velocity ellipsoid, the mean heliocentric velocity components, dispersions, and the vertex deviation with their uncertainties for the halo, thick disc and thin disc are given in Table 3. In the case of the mean values and dispersions, the uncertainties correspond to the 95% confidence intervals, whereas the uncertainty in the vertex deviation is determined following the formula for error propagation.
There is no clear boundary between the thin and thick disc. No abrupt change in the shape and size of their Galactocentric orbits is found. From a small well-defined trapezium, the orbits change gradually towards a large, especially in the R coordinate, curvilinear trapezium. Therefore, the separation between the two discs seems to be more difficult than the separation between the thick disc and halo. The reason is that the thick disc belongs to the Galactic disc, and is the disc population with the highest velocity dispersion, unlike the halo, which is a separate subsystem of the Milky Way.
![\begin{figure}
\par\includegraphics[width=12cm,clip]{12818fig18.ps}
\end{figure}](/articles/aa/full_html/2010/02/aa12818-09/img218.png)
|
Figure 8: Vertical eccentricity versus planar eccentricity for total disc (D) stars. The broken line (red) separates stars of the thin disc (green) from those of the thick disc (blue). The black asterisk is the vertex point (0.2, 0.1). |
| Open with DEXTER | |
Table 3: Segregation of populations for GCS sample from the Galactic orbits of the stars.
7 Conclusions
We have described the properties of a sampling parameter used to build a set of hierarchical subsamples.
It has been related to isolating integrals of the star motion, which take similar values for stars of a
specific population but that however differs from those of other populations. However, no isolating integral alone is
capable of describing single populations, since true population distributions overlap.
In most situations, it is possible to use a sampling parameter to allow us to build a family of nested
subsamples, each one containing, at most, one additional population to the others. Thus, by continuously
increasing the sampling parameter, the new stars entering the subsample either belong to a single
population or are a mixture of two nearby populations.
Hence, in addition to the sampling parameter, a segregation algorithm is
needed to identify the constituent populations of the mixture.
The entropy of the population partition was studied as a function of
the sampling parameter, so that within a particular interval of its graph,
which we referred to as the plateau region,
it is possible to obtain a stable estimate of the mixture parameters. The optimal estimation is associated
with a local maximum of entropy. Alternatively, the ![]() error of the mixture approach may also be
used to obtain an optimal segregation. The relationship between the fitting error and the population
entropy was analysed in detail. By using an appropriate sampling parameter, we have proven that
within a plateau region of the entropy graph, a local entropy maximum occurs simultaneously with a
local minimum of the
error of the mixture approach may also be
used to obtain an optimal segregation. The relationship between the fitting error and the population
entropy was analysed in detail. By using an appropriate sampling parameter, we have proven that
within a plateau region of the entropy graph, a local entropy maximum occurs simultaneously with a
local minimum of the ![]() error. Therefore, the combined statistical method provides the optimal
approximation mixture as well as the least informative partition for estimating the kinematic parameters of
populations.
error. Therefore, the combined statistical method provides the optimal
approximation mixture as well as the least informative partition for estimating the kinematic parameters of
populations.
Several sampling parameters have been tested for stellar populations of the solar neighbourhood. The sampling parameter P=|(U,V,W)|, which is the absolute value of the heliocentric velocity and a combination of the three basic integrals of motion, allows us to build an optimal subsample containing thin and thick disc stars, by removing, for P=230 km s-1, most of the halo population. The sampling parameter P=|W| is the absolute value of the perpendicular velocity and depends on the so called Oort's third integral, which is valid close the Galactic plane. It can be used to build, for P=180 km s-1, an optimal subsample containing a clearly defined mixture of total disc and halo stars, although without allowing an optimal segregation of thin and thick discs. The sampling parameter P=|(U,W)|, which is related to a combination of energy and angular momentum integrals, is far less stable than the others in estimating kinematic populations, and allows us to isolate the thin disc component from a component containing thick disc and halo stars altogether. Finally, P=|V|, which is related to the angular momentum integral, is effective in a similar way as the absolute value of the heliocentric velocity, but with lower accuracy.
The application of the method to the HIPPARCOS sample with the sampling parameter
P=|(U,V,W)| has been carried out
to compare with previous results of Paper I. The application of our combined statistical method to true
samples leads to more accurate results. The optimal sample, obtained for P=230 km s-1,
contains nearly all the local disc, while beyond 370 km s-1 the samples include a significant part
of the halo. We mention that, according to Papers I and II, the thick disc began to be included in
the nested subsamples at an absolute heliocentric velocity of about 85 km s-1, although the
core of its distribution started at around a velocity of 125 km s-1.
Although they may slightly vary depending on the sample, these values are consistent with
those obtained by Vidojevic & Ninkovic (2008) for a different stellar sample.
According to MEMPHIS, the optimal sample consists of about ![]() of thin disc stars with velocity
dispersions
of thin disc stars with velocity
dispersions
![]() km s-1 and vertex deviation
km s-1 and vertex deviation
![]() ,
and
,
and ![]() thick disc stars with velocity dispersions
thick disc stars with velocity dispersions
![]() and nearly null vertex deviation,
and nearly null vertex deviation,
![]() .
The differential rotation mean velocity is
.
The differential rotation mean velocity is
![]() km s-1. On the other hand, the sampling parameter
P=|W| relates to a subsample containing stars with
km s-1. On the other hand, the sampling parameter
P=|W| relates to a subsample containing stars with ![]() km s-1 that includes nearly all
the local disc population, while beyond 120 km s-1 the samples contain a significant part of the
halo. The optimal sample is obtained for P=180 km s-1, which represents a mixture of total disc and halo.
It consists of about
km s-1 that includes nearly all
the local disc population, while beyond 120 km s-1 the samples contain a significant part of the
halo. The optimal sample is obtained for P=180 km s-1, which represents a mixture of total disc and halo.
It consists of about ![]() disc stars, with velocity dispersions
disc stars, with velocity dispersions
![]() and
and
![]() of vertex deviation, and
of vertex deviation, and ![]() halo stars, with velocity dispersions
halo stars, with velocity dispersions
![]() and vanishing vertex deviation,
and vanishing vertex deviation,
![]() .
The shape of the halo velocity ellipsoid is radially dominated, as expected near the Sun
(Battaglia et al. 2005; Thom et al. 2005). The differential rotation mean velocity is
.
The shape of the halo velocity ellipsoid is radially dominated, as expected near the Sun
(Battaglia et al. 2005; Thom et al. 2005). The differential rotation mean velocity is
![]() km s-1. These population fractions have an uncertainty of about
km s-1. These population fractions have an uncertainty of about ![]() ,
which should be improved.
,
which should be improved.
The use of the GCS sample had two motivations. First, the sample has new and more accurate radial
velocity data than the HIPPARCOS sample. Second, while the HIPPARCOS sample is unconstrained, in the
sense that all available neighbouring stars are included, the GCS sample should only contain disc
representative stars. For the sampling parameter
P=|(U,V,W)|,
the optimal sample for a thin and thick disc mixture is also obtained for P=230 km s-1, and
consists mostly of disc stars, while beyond 375 km s-1 the samples include a significant part of the
halo. The optimal sample consists of about ![]() thin disc stars, with velocity dispersions
thin disc stars, with velocity dispersions
![]() and
and
![]() of vertex deviation,
and of
of vertex deviation,
and of ![]() of thick disc stars, with velocity dispersions
of thick disc stars, with velocity dispersions
![]() and vertex deviation
and vertex deviation
![]() .
The differential rotation mean velocity is
.
The differential rotation mean velocity is
![]() km s-1.
For the sampling parameter P=|W|, a subsample with P= 60 km s-1 contains nearly all the disc
population, while beyond 120 km s-1 the samples contain a significant part of the halo.
This values are very similar to those derived for data from HIPPARCOS.
The optimal sample is obtained for P=170 km s-1. It consists of a mixture of disc and halo
populations, i.e., has a composition of
km s-1.
For the sampling parameter P=|W|, a subsample with P= 60 km s-1 contains nearly all the disc
population, while beyond 120 km s-1 the samples contain a significant part of the halo.
This values are very similar to those derived for data from HIPPARCOS.
The optimal sample is obtained for P=170 km s-1. It consists of a mixture of disc and halo
populations, i.e., has a composition of ![]() disc stars, with velocity dispersions
disc stars, with velocity dispersions
![]() and vertex deviation
and vertex deviation
![]() ,
and
,
and ![]() halo stars, with velocity dispersions
halo stars, with velocity dispersions
![]() and vanishing vertex deviation,
and vanishing vertex deviation,
![]() .
The differential rotation mean velocity is
.
The differential rotation mean velocity is
![]() km s-1.
km s-1.
By comparing the analysis of those results, the HIPPARCOS sample appears to provide a more robust estimation of thick disc and halo populations, although GCS provides more accurate estimates for the total disc and the thin disc. However, the larger thin disc velocity dispersions inferred for the GCS sample suggest that there may be a slight kinematic bias in the sample towards older disc stars, as expected from the selection of stars of F and K spectral types. Therefore, by working from the GCS sample we do not achieve a dramatic improvement in measuring the local kinematic parameters, and we preferred to use the moment estimates obtained from HIPPARCOS data to characterise the local populations. We now attempt to justify this decision.
First, we note that the errors in the estimates corresponding to the rotation velocity are greater than those of other components. For GCS samples they are also greater than for HIPPARCOS samples. There are basically two reasons. On the one hand, when performing a disc-halo segregation, thin and thin disc stars are combined into the population Pop-I, while halo stars remain in Pop-II. Since thin and thick disc stars have a significantly different rotation mean velocity, the Gaussian approach given by Pop-I produces error in this velocity component. This is not so evident for the other velocity components because they have almost the same mean values. In addition, the GCS sample lags a part of the wing of the thin disc distribution, mainly in the rotation direction, which leads to a greater error in the Gaussian mixture approach. Holmberg et al. (2007) remark that the velocity distribution is not similar to a two normal mixture, although we are using a three normal mixture. We also note that estimates for minor populations always have greater uncertainties, leading, in this case, to poorer thick disc and halo kinematic estimates.
For the same reason, the partial lag of early-type or younger stars within the thin disc component of the
GCS sample leads to slightly greater thin-disc velocity dispersions than for the HIPPARCOS sample.
For the HIPPARCOS sample, those stars had mostly been included (Paper I) in the nested subsamples up to an
absolute heliocentric velocity P<51 km s-1. In total, there are 10 128 stars, from which 10 124 stars are
contained within the thin disc component (12 516 stars, Table 2). Therefore, they represent ![]() of the
total thin disc. For the GCS sample, there are instead 9568 stars with P < 51, from which 9564 stars
are also contained within the thin disc component (12 415 stars, Table 2). This is only
of the
total thin disc. For the GCS sample, there are instead 9568 stars with P < 51, from which 9564 stars
are also contained within the thin disc component (12 415 stars, Table 2). This is only ![]() of the
thin disc. Hence, the younger stars, which are responsible for the lower value of the thin disc velocity
dispersions, are not weighted sufficiently highly in the GCS catalogue,
causing some characteristic dispersions to be biased
towards older disc stars.
of the
thin disc. Hence, the younger stars, which are responsible for the lower value of the thin disc velocity
dispersions, are not weighted sufficiently highly in the GCS catalogue,
causing some characteristic dispersions to be biased
towards older disc stars.
If we consider only the total disc and halo segregation obtained either for HIPPARCOS or GCS samples by selecting the subsamples from the absolute perpendicular velocity P=|W|, we see that both populations become saturated when enlarging the velocity samples, by increasing the sampling parameter. This happens for Pop-I, which contains thin and thick disc stars, as well as for Pop-II, containing halo stars. This is also quite evident for disc stars when using from the absolute heliocentric velocity P=|(U,V,W)|, although, with this parameter, the halo then exhibits a continuously increasing estimate of velocity dispersion. Therefore, it seems that the likely disc unsaturation identified by Holmberg et al. (2007) has now been explained: the apparent unsaturation was probably caused by some contamination by halo stars. By segregating the halo from the disc, we obtain a stable estimate of the kinematical parameters for both local Galactic components.
The above kinematical parameters are estimates of the distribution moments of each stellar population.
They have been used to classify the stars into disjoint samples, thin disc, thick disc and halo, and to
compute their sample moments. For this purpose, the previously determined mixture proportions were taken as
initial values of an iterative method, which is based on the Bayesian probability of a star belonging to
a particular population, leading to a more accurate estimation of the population fractions.
Although the initial and final fractions are quite similar for the HIPPARCOS sample
(final thin disc 91.5%, thick disc 7.3%, halo 1.2%), for the GCS sample (final thin disc 93.8%,
thick disc 5.7%, halo 0.5%) a small difference is significant, because the halo fraction is less
than a half of that determined for HIPPARCOS' data. The resulting sample
moments from both catalogues are very similar. Thus,
for the HIPPARCOS sample the velocity dispersions are: thin disc
![]() km s-1, thick disc
km s-1, thick disc
![]() ,
and halo
,
and halo
![]() .
For the GCS sample they are:
thin disc
.
For the GCS sample they are:
thin disc
![]() ,
thick disc
,
thick disc
![]() ,
and halo
,
and halo
![]() .
The HIPPARCOS sample data set provides more accurate estimates of the
different population parameters for thick disc and halo stars.
To check the reliability of the MEMPHIS algorithm results, the GCS sample has
also been segregated by using a totally different kinematical approach accordingly to Vidojevic & Ninkovic (2009).
The stars have been classified into kinematic populations in terms of their orbital parameters. They
are derived in a similar way from the sampling parameters, and are also
related to the integrals of the star
motion. Each orbital parameter cannot be used in isolation to assign a star to a specific population,
and they must be based on a prior characterisation of the kinematic populations.
The results are found to be mostly consistent, although, for the thin disc, the mixture model tends to
infer smaller values of
.
The HIPPARCOS sample data set provides more accurate estimates of the
different population parameters for thick disc and halo stars.
To check the reliability of the MEMPHIS algorithm results, the GCS sample has
also been segregated by using a totally different kinematical approach accordingly to Vidojevic & Ninkovic (2009).
The stars have been classified into kinematic populations in terms of their orbital parameters. They
are derived in a similar way from the sampling parameters, and are also
related to the integrals of the star
motion. Each orbital parameter cannot be used in isolation to assign a star to a specific population,
and they must be based on a prior characterisation of the kinematic populations.
The results are found to be mostly consistent, although, for the thin disc, the mixture model tends to
infer smaller values of ![]() ,
which are balanced by higher values of the rotation differential
velocity between thin and thick discs. Our mixture proportions and kinematic
parameters represent our attempts to improve
the currently accepted values for the main Galactic components (e.g., Reddy et al. 2006;
Freeman & Bland-Hawthorn 2002; Helmi 2008), in particular, those of the halo.
,
which are balanced by higher values of the rotation differential
velocity between thin and thick discs. Our mixture proportions and kinematic
parameters represent our attempts to improve
the currently accepted values for the main Galactic components (e.g., Reddy et al. 2006;
Freeman & Bland-Hawthorn 2002; Helmi 2008), in particular, those of the halo.
The mixture proportions for the GCS sample are also consistent with those of Nordtröm et al. (2004),
Holmberg et al. (2007), and Famaey et al. (2007). We find that the halo represents about
![]() ,
and the thick disc would have a contribution of about
,
and the thick disc would have a contribution of about
![]() of the whole sample
(these authors suggest about
of the whole sample
(these authors suggest about ![]() and
and ![]() ,
respectively). Then, according to our kinematical
estimates, some assumed halo stars are found to be instead thick disc stars. This may be caused by the exclusion
of halo stars from
,
respectively). Then, according to our kinematical
estimates, some assumed halo stars are found to be instead thick disc stars. This may be caused by the exclusion
of halo stars from
![]() (Famaey et al. 2007). Our accurate estimation of the population
fractions has labelled 62 halo stars, from which 60 stars have
(Famaey et al. 2007). Our accurate estimation of the population
fractions has labelled 62 halo stars, from which 60 stars have
![]() ,
1 star (Hipp.
number 103 311) has
,
1 star (Hipp.
number 103 311) has
![]() ,
and 1 star has no metalicity value
at all (Hipp. number 24 186).
However, we emphasise that within the thick disc component a fraction of
,
and 1 star has no metalicity value
at all (Hipp. number 24 186).
However, we emphasise that within the thick disc component a fraction of
![]() stars have
stars have
![]() ,
and, within the thin disc, a fraction of
,
and, within the thin disc, a fraction of ![]() stars have this metalicity yet.
stars have this metalicity yet.
Finally, for the multivariate mixture model, it appears that the results for the HIPPARCOS sample have provided a more complete kinematical description of the local stellar populations than those of the GCS sample, despite the greater accuracy of radial velocities in the latter sample. The preselection of the GCS sample, to derive a representative disc sample, may have partially masked the true characteristics of the velocity distribution, or, at least, has weakened the MEMPHIS working hypothesis of less informative partial distributions. In contrast, the unconstrained HIPPARCOS sample has enabled our algorithm to perform its statistical analysis and achieve a more robust estimation of the various population kinematical parameters.
When applying Conan Doyle's suggestion ``Some facts should be suppressed, or, at least, a just sense of proportion should be observed in treating them'', the first question arisingmight be ``which ones of the facts?''. In our present approach, our response may well have been: let the statistics do the work.
AcknowledgementsFor one of us (SN) this research has been supported by the Serbian Ministry of Science and Technological Development (Project No 146004; Dynamics of Celestial Bodies, Systems and Populations). The authors wish to thank the anonymous referee for the extremely constructive suggestions for improving the readability of the paper.
References
- Alcobé, S., & Cubarsi, R. 2005, A&A, 442, 929 [NASA ADS] [CrossRef] [EDP Sciences] [Google Scholar]
- Altmann, M. 2006, RevMexAA (Serie de Conferencias), 25, 91 [Google Scholar]
- Battaglia, G., Helmi, A., Morrison, H., et al. 2005, MNRAS, 364, 433 [NASA ADS] [CrossRef] [Google Scholar]
- Bienaymé, O. 1999, A&A, 341, 86 [NASA ADS] [Google Scholar]
- Bovy, J., Hogg, D. W., & Roweis, S. T. 2009, ApJ, 700, 1794 [NASA ADS] [CrossRef] [Google Scholar]
- Cubarsi, R. 1992, AJ, 103, 1608 [NASA ADS] [CrossRef] [Google Scholar]
- Cubarsi, R. 2010, A&A, 510, A103 [NASA ADS] [CrossRef] [EDP Sciences] [Google Scholar]
- Cubarsi, R., & Alcobé, S. 2004, A&A, 427, 131 [NASA ADS] [CrossRef] [EDP Sciences] [Google Scholar]
- Dehnen, W. 1999, AJ, 118, 1201 [NASA ADS] [CrossRef] [Google Scholar]
- Dehnen, W., & Binney, J. J. 1998, MNRAS, 298, 387 [NASA ADS] [CrossRef] [Google Scholar]
- Dormand, J. R., & Prince, P. J. 1980, JCoAM, 6, 19 [Google Scholar]
- ESA 1992, The Hipparcos Input Catalogue, ESA SP-1136 [Google Scholar]
- ESA 1997, The HIPPARCOS Catalogue, ESA SP-1200 [Google Scholar]
- Famaey, B., Pont, F., Luri, X., et al. 2007, A&A, 461, 957 [NASA ADS] [CrossRef] [EDP Sciences] [Google Scholar]
- Freeman, K., & Bland-Hawthorn, J. 2002, ARA&A, 40, 487 [NASA ADS] [CrossRef] [Google Scholar]
- Gilmore, G., King, I., & Kruit, P. v. d. 1989, in The Milky Way as a Galaxy, ed. R. Buser, & I. King (Geneva: Publ. Geneva Observatory) [Google Scholar]
- Helmi, A. 2008, A&ARv, 15, 145 [NASA ADS] [Google Scholar]
- Holmberg, J., Nordström, B., & Andersen J. 2007, A&A, 475, 519 [NASA ADS] [CrossRef] [EDP Sciences] [MathSciNet] [Google Scholar]
- Kerr, F. J., & Lynden-Bell, D. 1986, MNRAS, 221, 1023 [NASA ADS] [CrossRef] [Google Scholar]
- Miyamoto, M., & Nagai, R. 1975, Publ. Astron. Soc. Japan, 27, 533 [Google Scholar]
- Ninkovic, S. 1992, AN, 313, 83 [NASA ADS] [Google Scholar]
- Nordström, B., Mayor, M., Andersen, J., et al. 2004, A&A, 418, 989 [NASA ADS] [CrossRef] [EDP Sciences] [Google Scholar]
- Orlov, V. V., Mylläri, A., Stepanischev, S., & Ossipkov, L. P. 2006, A&AT, 25, 161 [NASA ADS] [Google Scholar]
- Papoulis, A. 1989, in Probability, Random Variables, and Stochastic Processes (Singapore: MacGraw-Hill) [Google Scholar]
- Pauli, E.-M., Napiwotzki, R., Heber, U., Altmann, M., & Odenkirchen, M. 2006, A&A, 384, 879 [Google Scholar]
- Reddy, B. E., Lambert, D. L., & Allende-Prieto, C. 2006, MNRAS, 367, 1329 [NASA ADS] [CrossRef] [Google Scholar]
- Shu, F. H. 1969, ApJ, 158, 505 [NASA ADS] [CrossRef] [Google Scholar]
- Stuart, A., & Ord, J. K. 1987, in Kendall's Advanced Theory of Statistics, Distribution Theory (London: Ch. Griffin & Co.), 1 [Google Scholar]
- Thom, C., Flynn, C., Bessell, M. S., et al. 2005, MNRAS, 360, 354 [NASA ADS] [CrossRef] [Google Scholar]
- Vidojevic, S., & Ninkovic, S. 2008, Serbian Astron. J., 177, 39 [NASA ADS] [CrossRef] [Google Scholar]
- Vidojevic, S., & Ninkovic, S. 2009, AN, 330, 46 [NASA ADS] [Google Scholar]
Footnotes
- ... series
- If needed, depending on the working interval for n', we can
use a more accurate approximation, such as
 ,
with
,
with
 ,
which produces the same qualitative result.
,
which produces the same qualitative result.
All Tables
Table 1:
Optimal mixture parameters![]() for the HIPPARCOS (HIP) and GCS samples.
for the HIPPARCOS (HIP) and GCS samples.
Table 2:
Segregation of populations![]() for HIPPARCOS and
GCS samples.
for HIPPARCOS and
GCS samples.
Table 3: Segregation of populations for GCS sample from the Galactic orbits of the stars.
All Figures
|
|
Figure 1: ( Left) Stellar density N(P) in terms of the sampling parameter for a simulated univariate distribution, consisting of a superposition of four Gaussian populations. ( Right) Entropy graph of the mixture produced by scanning the whole sample. |
| Open with DEXTER | |
| In the text | |
|
|
Figure 2:
( Left) Detailed entropy graph for a HIPPARCOS sample (Paper I).
( Right) In a logarithmic plot, total dispersion |
| Open with DEXTER | |
| In the text | |
|
|
Figure 3:
Entropy graph (continuous line) and |
| Open with DEXTER | |
| In the text | |
|
|
Figure 4: Diagonal central velocity moments (in logarithmic plots) in terms of the sampling parameter P=|(U,V,W)| for populations segregated from several nested HIPPARCOS subsamples (dashed line for Pop-I and continuous line for Pop-II). The diagonal moments correspond to the velocity components U ( left), V ( centre), and W ( right). The value P=230 km s-1 (squares) provides optimal mixture estimates for thin and thick discs. |
| Open with DEXTER | |
| In the text | |
|
|
Figure 5:
Entropy (continuous line) and |
| Open with DEXTER | |
| In the text | |
|
|
Figure 6: Expected value y in terms of the number of stars (in logarithmic scale). HIPPARCOS on the left and GCS on the right. |
| Open with DEXTER | |
| In the text | |
|
|
Figure 7: Distribution of thin disc ( left), thick disc ( centre), and halo ( right) for the HIPPARCOS sample. The distribution on the plane UV of heliocentric velocities is shown in the first row, and on the plane VW in the second row. |
| Open with DEXTER | |
| In the text | |
|
|
Figure 8: Vertical eccentricity versus planar eccentricity for total disc (D) stars. The broken line (red) separates stars of the thin disc (green) from those of the thick disc (blue). The black asterisk is the vertex point (0.2, 0.1). |
| Open with DEXTER | |
| In the text | |
Copyright ESO 2010
Current usage metrics show cumulative count of Article Views (full-text article views including HTML views, PDF and ePub downloads, according to the available data) and Abstracts Views on Vision4Press platform.
Data correspond to usage on the plateform after 2015. The current usage metrics is available 48-96 hours after online publication and is updated daily on week days.
Initial download of the metrics may take a while.