![\begin{figure}
\par\includegraphics[angle=-90,width=14cm,clip]{9225fig1.ps}
\end{figure}](/articles/aa/full/2009/04/aa9225-07/Timg22.gif) |
Figure 1: The low-resolution spectrum of comet C/2004 Q2 (Machholz) taken with the EFOSC2 instrument taken with the ESO 3.6 m at La Silla on 9 december 2004. See the text for the line identification. The passbands of the three photometric filters of the Merope instrument used in this paper are shown in red. It is obvious that these broad filters cover a mix of continuum and emission features, with the I filter having the most emission-free passband. The two spectra are ESO archive data, and are taken under programme 274.C-5020 (Weiler). |
| Open with DEXTER | |
In the text
| |
Figure 2:
Three observations, one in each band, taken on January 11, 2005. The
frames are shown here to give an idea of the type of data. They are taken
consecutively, and hence under very similar ambient conditions. In the U filter, the very clear signature of the ion tail is visible, in B this tail is
only marginally visible, and in I it is absent. The field of view of these
images is
|
| Open with DEXTER | |
In the text
 |
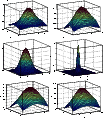
Figure 3: Correction for the seeing effect for a frame taken in optimal conditions ( left column of figures), and for a frame taken in less favourable conditions ( right column). The upper row shows the optocentres of the reduced frames (but not yet seeing-corrected). To degrade these frames to the same seeing, the left one has to be convolved with a broad Gaussian kernel ( middle left panel), while the right one with a very narrow Gaussian kernel ( middle right panel). The resulting optocentres are show in the bottom panels. |
| Open with DEXTER | |
In the text
![\begin{figure}
\par\includegraphics[angle=-90,width=7.8cm,clip]{9225fig4.ps}
\end{figure}](/articles/aa/full/2009/04/aa9225-07/Timg36.gif) |
Figure 4: The evolution of the seeing during our observational run as recorded by the RoboDIMM telescope (O'Mahony 2003; Augusteijn 2001), interpolated to the times of our comet observations. |
| Open with DEXTER | |
In the text
![\begin{figure}
\par\includegraphics[width=8.4cm,clip]{9225fig5.ps}
\end{figure}](/articles/aa/full/2009/04/aa9225-07/Timg38.gif) |
Figure 5:
Overview of the magnitudes for the extracted optocentre of the comet
in the three different bands. Shown here are the results for an aperture
radius of 1 and 6 pixels (0
|
| Open with DEXTER | |
In the text
![\begin{figure}
\par\includegraphics[width=4.2cm,clip]{9225fig6a.ps}\hspace*{4mm}\includegraphics[width=4.2cm,clip]{9225fig6b.ps}
\end{figure}](/articles/aa/full/2009/04/aa9225-07/Timg44.gif) |
Figure 6:
Jurkevich-Stellingwerf PDM ( left panels)
|
| Open with DEXTER | |
In the text
![\begin{figure}
\par\includegraphics[width=8.5cm,clip]{9225fig7.ps}
\end{figure}](/articles/aa/full/2009/04/aa9225-07/Timg47.gif) |
Figure 7: Phase diagrams of the comet's optocentre magnitudes in the I filter with an aperture radius of 1 pixel. upper panel: phase plot with f1 = 0.20 c d-1 (P = 5 d); lower panel: phase plot with f2=2.64 c d-1 (P = 9.1 h) on the magnitudes prewhitened with f1 (method #1 in Table 3). |
| Open with DEXTER | |
In the text
![\begin{figure}
\par\includegraphics[width=8.5cm,clip]{9225fig8.ps}
\end{figure}](/articles/aa/full/2009/04/aa9225-07/Timg67.gif) |
Figure 8:
Coma profiles of three representative observations for the three
filters used in our programme. Crosses represent the profile in the sunward
direction, while the |
| Open with DEXTER | |
In the text
![\begin{figure}
\par\includegraphics[width=8.5cm,clip]{9225fig9.ps}
\end{figure}](/articles/aa/full/2009/04/aa9225-07/Timg68.gif) |
Figure 9:
Temporal evolution (in function of the heliocentric distance |
| Open with DEXTER | |
In the text