A&A 493, 467-469 (2009)
DOI: 10.1051/0004-6361:20079048
J. Albert1 -
E. Aliu2 -
H. Anderhub3 -
P. Antoranz4 -
C. Baixeras5 -
J. A. Barrio4 -
H. Bartko6 -
D. Bastieri7 -
J. K. Becker8 -
W. Bednarek9 -
A. Berdyugin10 -
K. Berger1 -
C. Bigongiari7 -
A. Biland3 -
R. K. Bock6 -
P. Bordas5 -
V. Bosch-Ramon5 -
T. Bretz1 -
I. Britvitch3 -
M. Camara4 -
E. Carmona6 -
A. Chilingarian11 -
S. Commichau3 -
J. L. Contreras4 -
J. Cortina2 -
M. T. Costado12,13 -
V. Curtef8 -
V. Danielyan11 -
F. Dazzi7 -
A. De Angelis14 -
C. Delgado12 -
R. de los Reyes4 -
B. De Lotto14 -
D. Dorner1 -
M. Doro7 -
M. Errando2 -
M. Fagiolini15 -
D. Ferenc16 -
E. Fernández2 -
R. Firpo2 -
M. V. Fonseca4 -
L. Font5 -
M. Fuchs6 -
N. Galante6 -
R. J. García-López12,13 -
M. Garczarczyk6 -
M. Gaug12 -
F. Goebel6 -
D. Hakobyan11 -
M. Hayashida6 -
T. Hengstebeck17 -
A. Herrero12,13 -
D. Höhne1 -
J. Hose6 -
C. C. Hsu6 -
S. Huber1 -
P. Jacon9 -
T. Jogler6 -
R. Kosyra6 -
D. Kranich3 -
R. Kritzer1 -
A. Laille16 -
E. Lindfors10 -
S. Lombardi7 -
F. Longo18 -
M. López4 -
E. Lorenz3,6 -
P. Majumdar6 -
G. Maneva19 -
K. Mannheim1 -
M. Mariotti7 -
M. Martínez2 -
D. Mazin2 -
C. Merck6 -
M. Meucci15 -
M. Meyer1 -
J. M. Miranda4 -
R. Mirzoyan6 -
S. Mizobuchi6 -
A. Moralejo6 -
D. Nieto4 -
K. Nilsson10 -
J. Ninkovic6 -
E. Oña-Wilhelmi2 -
N. Otte6 -
I. Oya4 -
M. Panniello12![]() -
R. Paoletti15 -
M. Pasanen10 -
D. Pascoli7 -
F. Pauss3 -
R. Pegna15 -
M. Persic18 -
L. Peruzzo7 -
A. Piccioli15 -
E. Prandini7 -
N. Puchades2 -
A. Raymers11 -
J. Rico2 -
W. Rhode8 -
J. Rico2 -
M. Rissi3 -
A. Robert5 -
S. Rügamer1 -
A. Saggion7 -
T. Y. Saito6 -
A. Sánchez5 -
P. Sartori7 -
V. Scalzotto7 -
V. Scapin14 -
R. Schmitt1 -
T. Schweizer17 -
M. Shayduk17 -
K. Shinozaki6 -
S. N. Shore20 -
N. Sidro2 -
A. Sillanpää10 -
D. Sobczynska9 -
F. Spanier1 -
A. Stamerra15 -
L. S. Stark3 -
L. Takalo10 -
P. Temnikov19 -
D. Tescaro2 -
M. Teshima6 -
D. F. Torres2,21 -
N. Turini15 -
H. Vankov19 -
A. Venturini7 -
V. Vitale14 -
R. M. Wagner6 -
T. Wibig9 -
W. Wittek6 -
F. Zandanel7 -
R. Zanin2 -
J. Zapatero5
-
R. Paoletti15 -
M. Pasanen10 -
D. Pascoli7 -
F. Pauss3 -
R. Pegna15 -
M. Persic18 -
L. Peruzzo7 -
A. Piccioli15 -
E. Prandini7 -
N. Puchades2 -
A. Raymers11 -
J. Rico2 -
W. Rhode8 -
J. Rico2 -
M. Rissi3 -
A. Robert5 -
S. Rügamer1 -
A. Saggion7 -
T. Y. Saito6 -
A. Sánchez5 -
P. Sartori7 -
V. Scalzotto7 -
V. Scapin14 -
R. Schmitt1 -
T. Schweizer17 -
M. Shayduk17 -
K. Shinozaki6 -
S. N. Shore20 -
N. Sidro2 -
A. Sillanpää10 -
D. Sobczynska9 -
F. Spanier1 -
A. Stamerra15 -
L. S. Stark3 -
L. Takalo10 -
P. Temnikov19 -
D. Tescaro2 -
M. Teshima6 -
D. F. Torres2,21 -
N. Turini15 -
H. Vankov19 -
A. Venturini7 -
V. Vitale14 -
R. M. Wagner6 -
T. Wibig9 -
W. Wittek6 -
F. Zandanel7 -
R. Zanin2 -
J. Zapatero5
1 - Universität Würzburg, 97074 Würzburg, Germany
2 - IFAEnergies, Edifici Cn., 08193 Bellaterra, Spain
3 - ETH Zürich, 8093 Hönggerberg, Switzerland
4 - Universidad Complutense, 28040 Madrid, Spain
5 - Universitat Autònoma de Barcelona, 08193 Bellaterra, Spain
6 - Max-Planck-Institut für Physik, 80805 München, Germany
7 - Università di Padova and INFN, 35131 Padova, Italy
8 - Universität Dortmund, 44227 Dortmund, Germany
9 - University of ![]() ódz, 90236 Lodz, Poland
ódz, 90236 Lodz, Poland
10 - Tuorla Observatory, 21500 Piikkiö, Finland
11 - Yerevan Physics Institute, 375036 Yerevan, Armenia
12 - Inst. de Astrofisica de Canarias, 38200, La Laguna, Tenerife, Spain
13 - Depto. de Astrofisica, Universidad, 38206 La Laguna, Tenerife, Spain
14 - Università di Udine, and INFN Trieste, 33100 Udine, Italy
15 - Università di Siena, and INFN Pisa, 53100 Siena, Italy
16 - University of California, Davis, 95616-8677, USA
17 - Humboldt-Universität zu Berlin, 12489 Berlin, Germany
18 - Università di Trieste, and INFN Trieste, 34100 Trieste, Italy
19 - Institute for Nuclear Research and Nuclear Energy, 1784 Sofia, Bulgaria
20 - Università di Pisa, and INFN Pisa, 56126 Pisa, Italy
21 - Institut de Ciències de l'Espai, 08193 Bellaterra, Spain
Received 12 November 2007 / Accepted 10 October 2008
Abstract
The active galactic nucleus PG 1553+113 was observed by
the MAGIC telescope in July 2006 during a multiwavelength campaign, in
which telescopes in the optical, X-ray, and very high energies
participated. Although the MAGIC data were affected by strong
atmospheric absorption (calima), they were analyzed after applying a
correction. In 8.5 h, a signal was detected with a significance of
5.0![]() .
The integral flux above 150 GeV was
.
The integral flux above 150 GeV was
![]() .
By fitting the
differential energy spectrum with a power law, a spectral index
of
.
By fitting the
differential energy spectrum with a power law, a spectral index
of
![]() was obtained.
was obtained.
Key words: gamma rays: observations - galaxies: active - galaxies: BL Lacertae objects: individual: PG 1553+113
The Major Atmospheric Gamma-ray Imaging Cherenkov (MAGIC) telescope, located on the Canary Island of La Palma at 2200 m a.s.l., is capable of extending very high energy observations to energies previously unreachable and detecting new sources at energies down to 50 GeV.
One of these sources is the BL Lac type object PG 1553+113, observed
for the first time in this energy range in April and May 2005 by the
MAGIC telescope and the High Energy Stereoscopic System (HESS).
From these observations a faint signal was measured, and the detection
was confirmed by further observations (Aharonian et al. 2006; Albert et al. 2007). In
the subsequent years, additional VHE data were taken. From the combined
data sets, strong signals were found: for HESS at 10.2![]() significance (Aharonian et al. 2008) and for MAGIC at 15.0
significance (Aharonian et al. 2008) and for MAGIC at 15.0![]() significance (Dorner 2008). In addition, the VHE measurements allowed the
unknown redshift of the source to be constrained. Until now the
redshift of PG 1553+113 has been unknown, since neither emission or
absorption lines could be found, nor the host galaxy resolved. Several
lower limits were determined
(Sbarufatti et al. 2005; Carangelo et al. 2003; Scarpa et al. 2000; Sbarufatti et al. 2006; Treves et al. 2007).
With the MAGIC and HESS measurements, upper limits could be
determined (Mazin & Goebel 2007; Dorner 2008; Aharonian et al. 2006).
significance (Dorner 2008). In addition, the VHE measurements allowed the
unknown redshift of the source to be constrained. Until now the
redshift of PG 1553+113 has been unknown, since neither emission or
absorption lines could be found, nor the host galaxy resolved. Several
lower limits were determined
(Sbarufatti et al. 2005; Carangelo et al. 2003; Scarpa et al. 2000; Sbarufatti et al. 2006; Treves et al. 2007).
With the MAGIC and HESS measurements, upper limits could be
determined (Mazin & Goebel 2007; Dorner 2008; Aharonian et al. 2006).
To study the spectral energy distribution of a source, simultaneous data from different wavelengths are mandatory. Therefore, a multiwavelength (MWL) campaign was performed in July 2006 to observe PG 1553+113. This paper concentrates on the data taken by MAGIC during this MWL campaign.
Between April 2005 and April 2007, MAGIC observed PG 1553+113 for a total of 78 h. Part of these data were acquired during a MWL campaign in 2006 July with the HESS array of IACTs, the X-ray satellite Suzaku and the optical telescope KVA. Suzaku observed the source between 24 July, 14:26 UTC and 25 July, 19:17 UTC, and HESS between 22 July and 27 July. From the KVA, data between 21 July and 27 July are available.
The MAGIC telescope observed PG 1553+113 between 14 July and 27 July
for 9.5 h at zenith distances between 18![]() and 35
and 35![]() .
The data were acquired in wobble mode, where the source was tracked
with an offset of
.
The data were acquired in wobble mode, where the source was tracked
with an offset of ![]()
![]() from the center of the camera,
which enabled simultaneous measurement of the source and the
background.
from the center of the camera,
which enabled simultaneous measurement of the source and the
background.
One hour of data was excluded due to technical problems. The quality of the entire data set acquired during the MWL campaign was affectd by calima, i.e. sand-dust from the Sahara in the atmosphere. For the affected data, the nightly values of atmospheric absorption ranged between 5% and 40%. To account for the absorption of the Cherenkov light, correction factors were calculated and applied to the data (see Sect. 4).
The data were processed by an automated analysis pipeline (Dorner & Bretz 2005; Bretz & Dorner 2005) at the data center in Würzburg. The analysis includes an absolute calibration with muons (Goebel et al. 2005), an absolute mispointing correction (Riegel et al. 2005), and it uses the arrival time information of the pulses of neighboring pixels for noise subtraction and background suppression.
In determining the background, three OFF regions were used, providing a scale factor of 1/3 for the background measurement.
To suppress the background, a dynamical cut in Area
(Area = ![]() WIDTH
WIDTH![]() LENGTH) versus SIZE and a cut
in
LENGTH) versus SIZE and a cut
in ![]() were applied. More details of the cuts can be found in
Riegel & Bretz (2005), and the aforementioned image parameters are described by
Hillas (1985). To account for the steeper spectrum of PG 1553+113,
the here presented analysis applied a cut in Area that was less
restrictive at lower energies compared to the standard cut used by the
automated analysis, which has been optimized for Crab Nebula data
over several years.
were applied. More details of the cuts can be found in
Riegel & Bretz (2005), and the aforementioned image parameters are described by
Hillas (1985). To account for the steeper spectrum of PG 1553+113,
the here presented analysis applied a cut in Area that was less
restrictive at lower energies compared to the standard cut used by the
automated analysis, which has been optimized for Crab Nebula data
over several years.
In generating the spectrum, the cut in Area was selected to ensure that more than 90% of the simulated gammas survived. To study the dependency of the spectral shape on the cut efficiency, a different cut in Area with cut efficiencies of between 50% and 95% for the entire energy range was applied.
Calima, also known as Saharan Air Layer (SAL), is a layer in the atmosphere that transports sand-dust from the Sahara in a westerly direction over the Atlantic Ocean. The SAL is usually situated between 1.5 km and 5.5 km a.s.l. (Dunion & Velden 2004). Since the Canary Islands are close to the North African coast, the MAGIC observations are probably affected by additional light absorption in the atmosphere when calima occurs.
From extinction measurements of the Carlsberg Meridian Telescope (Carlsberg Meridian Telescope 2007; Evans et al. 2002), which are available for each night, the loss of light due to calima was calculated. To correct the data for absorption by the atmosphere, the calibration factors were adapted for each night separately and the data were reprocessed. More details of the method are provided by Dorner et al. (2009).
The 8.5 h of data from PG 1553+113 provided a signal with a
significance of 5.0![]() according to Li & Ma (1983). The
according to Li & Ma (1983). The
![]() distributions for the ON- and normalized OFF-source
measurement are shown in Fig. 1.
distributions for the ON- and normalized OFF-source
measurement are shown in Fig. 1.
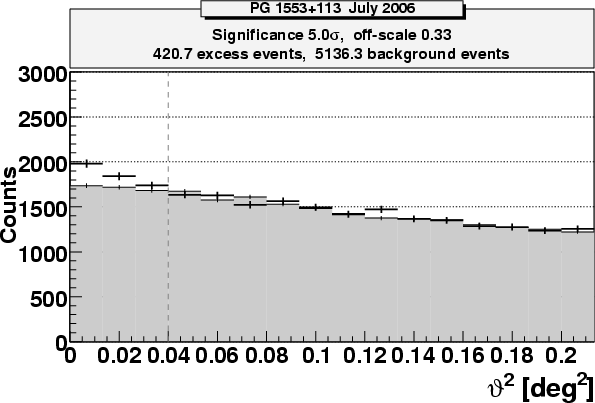 |
Figure 1:
Distributions of
|
| Open with DEXTER | |
The differential spectrum measured by MAGIC is shown in Fig. 2. In this plot, a set of spectra obtained with different cut efficiencies and different simulated spectra is indicated by a gray band. The data points of the spectrum are given in Table 1 including the statistical errors. The systematic errors of the analysis are discussed in Albert et al. (2008).
Fitting the differential spectrum with a power law yields a flux of
![]() at
200 GeV and a spectral index of
at
200 GeV and a spectral index of
![]() .
This result is
consistent with the data (fit probability 45%) and in good agreement
with previous measurements in 2005 and 2006 (Aharonian et al. 2006; Albert et al. 2007).
Within the errors, the simultaneous measurements of the HESS
telescopes in the energy range above 225 GeV is in agreement with the
MAGIC results, although the fit of the differential spectrum yields a
spectral index of
.
This result is
consistent with the data (fit probability 45%) and in good agreement
with previous measurements in 2005 and 2006 (Aharonian et al. 2006; Albert et al. 2007).
Within the errors, the simultaneous measurements of the HESS
telescopes in the energy range above 225 GeV is in agreement with the
MAGIC results, although the fit of the differential spectrum yields a
spectral index of
![]() (Aharonian et al. 2008).
The integral flux above 150 GeV obtained from this analysis is
(Aharonian et al. 2008).
The integral flux above 150 GeV obtained from this analysis is
![]() .
.
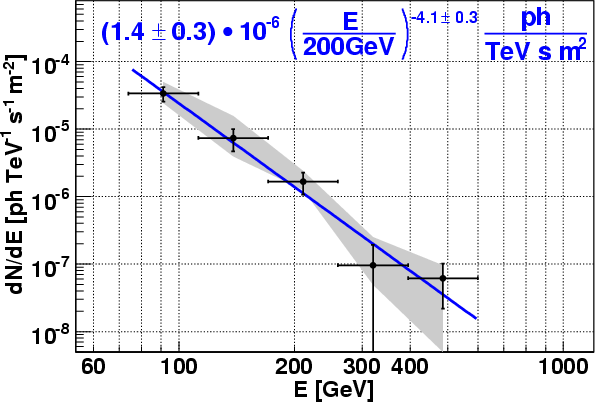 |
Figure 2: Differential energy spectrum of PG 1553+113. The horizontal error bars indicate the width of the energy bins. The vertical error bars illustrate the statistical errors. The gray band corresponds to a set of spectra obtained with different cut efficiencies and simulated spectra. |
| Open with DEXTER | |
Table 1: Flux for the spectral points in Fig. 2 including the statistical errors.
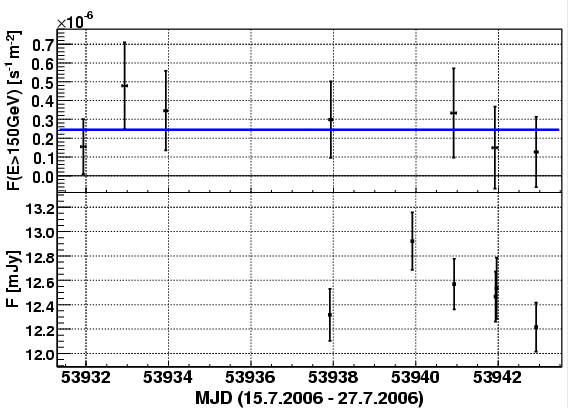 |
Figure 3:
Night-by-night light curve for the integral flux above
150 GeV in
|
| Open with DEXTER | |
Table 2:
Date, start time, duration, and flux above 150 GeV for
the MAGIC observations carried out between July 15
![]() and
27
and
27
![]() 2006.
2006.
To check whether a flare occurred during the eight nights of
observation, the flux above 150 GeV was calculated on a night-by-night
basis (see Table 2). The corresponding light curve is shown
in the upper part of Fig. 3. Since the data sets for single
days are of durations shorter than one and a half hours
(0.62 h - 1.4 h), the data points represent only signals of a
significance level between 0.7![]() and 2.1
and 2.1![]() .
Consequently, no strong conclusions about the night-to-night
variability in the flux can be drawn. Within the errors, the
measurement is consistent with a constant flux (fit probability 82%).
.
Consequently, no strong conclusions about the night-to-night
variability in the flux can be drawn. Within the errors, the
measurement is consistent with a constant flux (fit probability 82%).
Contemporaneously with the MAGIC observations, the optical telescope KVA acquired data in the R-band. For the first nights, no data was available. The flux for additional nights is shown in the lower part of Fig. 3.
PG 1553+113 was observed in July 2006 as part of a MWL campaign with the MAGIC telescope. After correcting the data for the effect of calima, the analysis detected a gamma-ray signal of 5.0 standard deviations. Within the statistical errors, the differential energy spectrum is compatible with those derived by previous measurements including the one observed by HESS in this campaign. The inter-night light curve shows no significant variability.
The measured flux and reconstructed spectrum will be used in studies of the spectral energy distribution, which will include other data acquired during the MWL campaign (Reimer et al. 2008).
Acknowledgements
We would like to thank the IAC for the excellent working conditions at the Observatorio del Roque de los Muchachos in La Palma. The support of the German BMBF and MPG, the Italian INFN and the Spanish CICYT is gratefully acknowledged. This work was also supported by ETH research grant TH-34/04-3 and by Polish grant MNiI 1P03D01028.