A&A 493, 175-183 (2009)
DOI: 10.1051/0004-6361:200810775
M. D. Reed1,![]() - J. R. Eggen1 - S. L. Harms1 - J. H. Telting2 - R. H. Østensen3 - S. J. O' Toole4 - D. M. Terndrup5 - A.-Y. Zhou1,6 - R. L.
Kienenberger1 - U. Heber7
- J. R. Eggen1 - S. L. Harms1 - J. H. Telting2 - R. H. Østensen3 - S. J. O' Toole4 - D. M. Terndrup5 - A.-Y. Zhou1,6 - R. L.
Kienenberger1 - U. Heber7
1 - Department of Physics, Astronomy, & Materials Science, Missouri State University, 901 S. National, Springfield, MO 65897, USA
2 - Nordic Optical Telescope, Apartado 474, 38700 Santa Cruz de La Palma,
Spain
3 - Institute of Astronomy, Catholic University of Leuven,
Celestijnenlaan 200B, 3001 Leuven, Belgium
4 - Anglo-Australian Observatory, PO Box 296, Epping NSW 1710, Australia
5 - Department of Astronomy, The Ohio State University, Columbus, OH 43210,
USA
6 - National Astronomical Observatories of the Chinese Academy of
Sciences, Beijing 100012, PR China
7 - Dr. Remeis-Sternwarte Bamberg, Universität Erlangen-Nürnberg, Sternwartstr 7, 96049 Bamberg, Germany
Received 9 August 2008 / Accepted 26 October 2008
Abstract
Aims. We present observations and analysis of time-series spectroscopy and photometry of the pulsating subdwarf B star PG 1219+534 (KY UMa). Subdwarf B stars are blue horizontal branch stars that have shed most of their hydrogen envelopes. Pulsating subdwarf B stars allow a probe into this interesting phase of evolution.
Methods. Low-resolution spectra were obtained at the Nordic Optical Telescope and Kitt Peak National Observatory, and photometric observations were obtained at MDM and Baker observatories in 2006. We extracted radial velocity and equivalent width variations from several Balmer and He I lines in individual spectra. The pulsation frequencies were separated via phase binning to detect line-profile variations in Balmer and helium lines, which were subsequently matched to atmospheric models to infer effective temperature and gravity changes throughout the pulsation cycle.
Results. From the photometry we recovered the four previously observed frequencies and detected a new fifth frequency. From the spectra we directly measured radial velocity and equivalent width variations for the four main frequencies and from atmospheric models. We successfully inferred temperature and gravity changes for these four frequencies. We compared amplitude ratios and phase differences of these quantities and searched for outliers that could be identified as high-degree modes. These are the first such measurements for a ``normal'' amplitude pulsating subdwarf B star, indicating that spectroscopic studies can benefit the majority of pulsating subdwarf B stars.
Key words: techniques: radial velocities - stars: subdwarfs - stars: variables: general - techniques: spectroscopic - stars: individual: PG 1219+534
Table 1: 2006 Photometric observations of PG 1219 simultaneous or near to the spectroscopic observations.
Pulsating sdB stars potentially allow the opportunity to discern
their interior structure using asteroseismology to obtain estimates
of total mass, luminosity, envelope mass,
radiative levitation, gravitational
diffusion, and helium fusion cross sections. To do so,
the pulsation modes must first
be identified with their associated spherical harmonics.
In 1999, O'Toole et al. (2002,2003,2000) began applying
time-series spectroscopic techniques to attempt
mode identification in sdBV stars. Whereas photometry measures
brightness changes largely caused by temperature variations,
spectroscopy can reveal information regarding the pulsation
velocities and separate the temperature and gravity components. An
excellent example of these techniques was shown in Telting & Østensen (2004) where they
determined that the pulsational degree
of the highest-amplitude frequency of PG 1325+101 (QQ Vir) was
consistent with ![]() .
Other sdBV stars studied using time-series spectroscopy include
PB 8783 (EO Cet) and KPD 2109+4401 (V2203 Cyg) (Jefferey & Pollacco 2000), PG 1605+072
(V338 Ser) (O'Toole et al. 2002; Woolf et al. 2002; O'Toole et al. 2003,2000,2005),
and Balloon 090100001 (Telting & Østensen 2006) using low-resolution spectroscopy
on intermediate-sized telescopes.
PG 1219+534, PG 1605+072, and PG 1613+426 were also observed
using FUSE (Kuassivi et al. 2005). Only for the high-amplitude pulsators (PG 1605+072,
PG 1325+101, and Balloon 090100001) were pulsations detected. However,
such pulsators provide their own problems in that the high-amplitude
pulsations affect the other frequencies and therefore require considerable
prewhitening (variation removal); e.g. Telting & Østensen (2006); Tillich et al. (2007).
Unfortunately, because of insufficient signal, temporal resolution, or
run length, none of these studies have provided conclusive mode
identifications which would be useful for constraining models.
.
Other sdBV stars studied using time-series spectroscopy include
PB 8783 (EO Cet) and KPD 2109+4401 (V2203 Cyg) (Jefferey & Pollacco 2000), PG 1605+072
(V338 Ser) (O'Toole et al. 2002; Woolf et al. 2002; O'Toole et al. 2003,2000,2005),
and Balloon 090100001 (Telting & Østensen 2006) using low-resolution spectroscopy
on intermediate-sized telescopes.
PG 1219+534, PG 1605+072, and PG 1613+426 were also observed
using FUSE (Kuassivi et al. 2005). Only for the high-amplitude pulsators (PG 1605+072,
PG 1325+101, and Balloon 090100001) were pulsations detected. However,
such pulsators provide their own problems in that the high-amplitude
pulsations affect the other frequencies and therefore require considerable
prewhitening (variation removal); e.g. Telting & Østensen (2006); Tillich et al. (2007).
Unfortunately, because of insufficient signal, temporal resolution, or
run length, none of these studies have provided conclusive mode
identifications which would be useful for constraining models.
This paper reports our time-series spectroscopic and photometric
observations of PG 1219+534 (also KY UMa but hereafter PG 1219).
PG 1219 was discovered to
be a pulsator by Koen et al. (1999) who detected four independent frequencies.
The spacings of the frequencies
are such that the entire pulsation spectrum can be resolved in just a
few hours, yet the frequency density is too large for the pulsations to be
of the same modal degree ![]() .
A photometry-based mode identification
has been published which attributes the four frequencies to three
differing modal degrees (Charpinet et al. 2005) which can be used as a guide for our
mode identifications. While the pulsation amplitudes are
low (2-8 mma in photometry), they should not interfere with each other,
eliminating the need to prewhiten some frequencies to reveal others.
This makes PG 1219 an excellent target for
mode identification studies.
Our photometric observations of PG 1219 began in 2003 as part of our effort
to resolve the pulsation spectra (Fourier transform; FT) of sdBV
stars (Zhou et al. 2006; Reed et al. 2007a,2004b,2007b,2006); Harms et al. (2006) reported
the results of 2003-2005 photometric
observations of PG 1219. During that time, the
pulsation frequencies remained consistent with those of
Koen et al. (1999) and occasionally a new, low-amplitude frequency would
appear for one or two nights.
.
A photometry-based mode identification
has been published which attributes the four frequencies to three
differing modal degrees (Charpinet et al. 2005) which can be used as a guide for our
mode identifications. While the pulsation amplitudes are
low (2-8 mma in photometry), they should not interfere with each other,
eliminating the need to prewhiten some frequencies to reveal others.
This makes PG 1219 an excellent target for
mode identification studies.
Our photometric observations of PG 1219 began in 2003 as part of our effort
to resolve the pulsation spectra (Fourier transform; FT) of sdBV
stars (Zhou et al. 2006; Reed et al. 2007a,2004b,2007b,2006); Harms et al. (2006) reported
the results of 2003-2005 photometric
observations of PG 1219. During that time, the
pulsation frequencies remained consistent with those of
Koen et al. (1999) and occasionally a new, low-amplitude frequency would
appear for one or two nights.
In Sect. 2 we describe our simultaneous spectroscopic and photometric observations during 2006 and examine the frequency content in Sect. 3. In Sect. 4 we discuss the results of our observations and in Sect. 5 we provide conclusions from our work. Further detailed modeling to understand our observational results in terms of asteroseismology will be presented in a separate paper.
We obtained photometry at MDM and Baker observatories to
support our spectroscopic observations, the details of which are
provided in Table 1. Baker observatory (BO) is equipped with a 0.4 m
telescope and a Roper Scientific RS1340b CCD photometer.
At MDM we used the 1.3 m McGraw Hill telescope
with an Apogee Instruments U47 CCD. For all of
our CCD measurements, we binned the CCDs ![]() pixels providing a
dead time of 1 s and all used a red
cut-off filter (BG38 or BG40), so the effective bandpass covers the Band V filters and is essentially that of a blue-sensitive photomultiplier
tube. Accurate timing was accomplished via Network
Time Protocol (NTP) connections to at least one stratum 1 and two stratum
2 servers. NTP timings were accurate to better than 0.02 s.
pixels providing a
dead time of 1 s and all used a red
cut-off filter (BG38 or BG40), so the effective bandpass covers the Band V filters and is essentially that of a blue-sensitive photomultiplier
tube. Accurate timing was accomplished via Network
Time Protocol (NTP) connections to at least one stratum 1 and two stratum
2 servers. NTP timings were accurate to better than 0.02 s.
Our photometric data were reduced using
standard IRAF packages for image reduction, including
bias subtraction,
dark current and flat field corrections.
Intensities were extracted using IRAF aperture photometry with extinction
and cloud corrections using the normalized intensities of several field
stars. As sdB stars are substantially hotter than typical field
stars, differential light curves
are not flat due to differential atmospheric and colour extinctions.
A low-order polynomial was fit to remove these trends from the data on a
night-by-night basis. Finally, the lightcurves are normalized by their
average flux and centered around zero so the reported differential
intensities are
![]() .
Amplitudes are given as milli-modulation amplitudes (mma) with an
amplitude of 10 mma corresponding to 1.0% or 9.2 millimagnitudes.
A portion of
data from MDM is shown in Fig. 1.
There is obvious beating that occurs on multiple time scales which
indicates the multiperiodic nature of the pulsations.
.
Amplitudes are given as milli-modulation amplitudes (mma) with an
amplitude of 10 mma corresponding to 1.0% or 9.2 millimagnitudes.
A portion of
data from MDM is shown in Fig. 1.
There is obvious beating that occurs on multiple time scales which
indicates the multiperiodic nature of the pulsations.
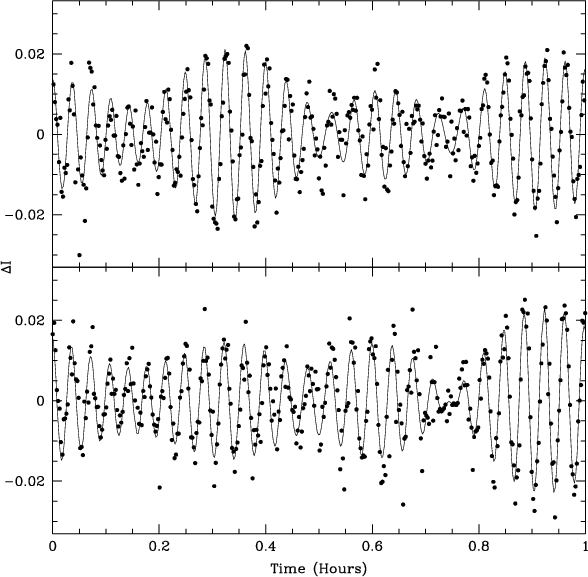 |
Figure 1: Photometric lightcurves for consecutive 1 h segments of PG 1219. Solid line is a four-frequency fit to the points. |
| Open with DEXTER | |
During 7 nights in April 2006 we obtained nearly 5200
time-resolved low-resolution spectra of PG 1219, with the specifics
of each run provided in Table 2. We obtained
2085 spectra at the Kitt Peak National Observatory's (KPNO) 4 m Mayall
telescope using the RC spectrograph in long-slit mode. Our KPNO
instrumental setup was: grating KPC-007 with the T2KB CCD which
sampled approximately 3000-5000 Å, a FWHM spectral resolution of
about 4 Å, and a dispersion of 1.44 Å/pixel. We subframed
the CCD along the slit, reading out a section
![]() including
a 41 column overscan region. Integration times were 10 s with rather
long dead-times of 25 s for a total cycle time of
including
a 41 column overscan region. Integration times were 10 s with rather
long dead-times of 25 s for a total cycle time of ![]() 35 s.
Binning the CCD provided only negligible improvement, so we did not.
We obtained helium-neon-argon arc-line spectra every 80-150 spectra
aperiodically and observed the flux-standard star Feige 66 three times
per night. Halogen lamp flat fields were obtained nightly for removing
pixel-to-pixel variations on the CCD.
35 s.
Binning the CCD provided only negligible improvement, so we did not.
We obtained helium-neon-argon arc-line spectra every 80-150 spectra
aperiodically and observed the flux-standard star Feige 66 three times
per night. Halogen lamp flat fields were obtained nightly for removing
pixel-to-pixel variations on the CCD.
Table 2: Spectroscopic observations of PG 1219.
We obtained 3099 spectra at the Nordic Optical Telescope (NOT) using
ALFOSC in long-slit mode. Our NOT setup used
grism #16 and CCD #8, which sampled approximately 3500-5050 Å,
a resolution of about 3 Å FWHM at a dispersion of
0.77 Å/pixel. The grism and slit were set up such that they were aligned
with the rows of the CCD to shorten the dead times. Using 25 s integrations,
we achieved a cycle time of ![]() 31 s, so while the NOT integrated longer
than KPNO, the cycle time was similar. A few re-acquisitions were done per
night to correct the slit angle with the parallactic angle. Thorium-argon
and helium arc-line spectra were obtained every 60-80 spectra. Halogen
lamp images were obtained for flat-fielding.
31 s, so while the NOT integrated longer
than KPNO, the cycle time was similar. A few re-acquisitions were done per
night to correct the slit angle with the parallactic angle. Thorium-argon
and helium arc-line spectra were obtained every 60-80 spectra. Halogen
lamp images were obtained for flat-fielding.
The spectra were bias and dark-current corrected using overscan regions and flat field corrected using standard tasks within IRAF. Two bad columns in the NOT data were corrected by linear interpolation of pixels in adjacent columns. As the spectra contains low signal-to-noise (S/N) regions in the UV, and the KPNO CCD had a sharp sensitivity decline redward of 5030 Å, the spectra were trimmed to 3710-5130 Å for the KPNO data and 3480-5010 Å for the NOT data. One-dimensional spectra were optimally extracted after subtracting a fit to the sky background for each detector column. Wavelength calibration was done using the HeNeAr and the ThAr calibration spectra for the KPNO and NOT data, respectively, interpolating the wavelength solution between the nearest before and after calibration spectra. The average S/N of the spectra was 31 for KPNO and 25 for the NOT data, so while the KPNO telescope was much larger than the NOT, the longer NOT integrations, combined with a more efficient grating allowed similar S/N but higher spectral resolution in the NOT data. The spectra were normalized to the continuum using the IRAF task CONTINUUM which used a fourteenth order Legendre polynomial. The mean normalized KPNO and NOT spectra are shown in Fig. 2 on the same wavelength scale. The 10 and 25 s integration times lead to phase smearing that will reduce amplitudes of variation by 0.85 and 5.2%, respectively, for a 140 s pulsation period. Additionally, our measurements are for disk-averaged observations and intrinsic amplitudes may be higher locally within the unresolved surface.
![\begin{figure}
\par\resizebox{9cm}{!}{\includegraphics[angle=-90]{0775fg02.ps}}
\end{figure}](/articles/aa/full/2009/01/aa10775-08/img17.gif) |
Figure 2: Average of all normalized KPNO ( top) and NOT ( bottom) spectra. |
| Open with DEXTER | |
Table 3:
Frequencies and amplitudes detected in our annual photometric
data sets.
All frequencies are given in ![]() Hz and amplitudes in mma with least-squares
errors on the last digits in parentheses.
Hz and amplitudes in mma with least-squares
errors on the last digits in parentheses.
Our selection of PG 1219 as a target is partially due to
its year-to-year stability and this continued during our 2006
observations. Table 3 provides the frequencies and amplitudes
of pulsations detected during our four-year photometric
program and indicates that two
additional frequencies were observed during 2004, but during single nights
only. However, during our 2006 campaign, a new, low amplitude frequency
persisted through both weeks of observations. These occasionally-observed
frequencies are labeled as f5 through f7 of Table 3.
Pulsation spectra of photometry which overlaps our spectroscopic data
are shown in Fig. 3. Insets show the spectral
window (FT of a single sine-wave sampled at the same times as the data) and
smaller panels show the residuals after prewhitening by the four main
frequencies. The solid horizontal (blue) line is the ![]() detection
calculated as four times the average value of the FT for regions
outside of areas of pulsation (Breger et al. 1994).
detection
calculated as four times the average value of the FT for regions
outside of areas of pulsation (Breger et al. 1994).
Photometric amplitudes of f1 through f4 show 20-40% variation over the course of four years, but during our spectroscopic observations, the amplitudes remain essentially constant. The only significant change is f3, for which the amplitude increases by 14% in the week between the MDM and BO observations. From our photometric monitoring of PG 1219 we can conclude that there are four consistently detected frequencies and a fifth, low amplitude frequency.
 |
Figure 3:
Pulsation spectra of photometric data simultaneous with
the spectroscopic observations. Smaller panels have the four main frequencies
removed and insets are the spectral windows plotted on the same frequency
scale. The (blue)
lines indicate the |
| Open with DEXTER | |
Since our cycle time and S/N were better for photometry, we could examine the photometry for nightly variations in phase (defined as time of first maximum since JD = 2 453 830.0 divided by the pulsation period). Such variations can cause integrated data to indicate lower amplitudes or have multiple peaks which are not intrinsic to the star. The phases of the four main frequencies were consistent to within the errors of those provided in Table 4, and so we conclude that no phase variations occurred during the photometric or spectroscopic runs. However the phases do change between the MDM and BO observations. The phase of f3 changes by 13% while the others show marginal changes of 2, 4, and 3% for f1, f2, and f4, respectively.
The procedures we used are similar to those described in Telting & Østensen (2004) and
summarized as follows:
we calculated the radial velocity (RV) of the time-resolved spectra using the
cross-correlation application FXCOR in IRAF. We
produced nightly template spectra from the mean of individual spectra which
FXCOR uses to do a Fourier cross-correlation between the template
and individual spectra. We filtered the input to fit line features rather than
large-scale trends in each spectrum, and a Gaussian was fit to
the resulting cross-correlation function (CCF) of a best-fit size between 3
and 21 velocity bins around the maximum. We fit the CCF for the H![]() through H8 Balmer lines and the 4026 and 4471 Å HeI lines. The radial
velocity shifts are dominated by those of the strongest Balmer lines
in the spectra. Figure 4 shows radial velocities obtained from
one night each of KPNO and NOT data. The raw velocities, shown in the top
portion for each date, show jumps in velocity due to repositioning
the target on the slit and longer-term instrumental effects. These were
corrected by fitting first or second-order polynomials to the segments
between repositionings and are shown on the bottom portion for each date. All
panels are plotted to the same scale but with varying velocity offsets. As
these changes were of significantly longer time then the pulsations, there
was no impact on pulsation velocities.
through H8 Balmer lines and the 4026 and 4471 Å HeI lines. The radial
velocity shifts are dominated by those of the strongest Balmer lines
in the spectra. Figure 4 shows radial velocities obtained from
one night each of KPNO and NOT data. The raw velocities, shown in the top
portion for each date, show jumps in velocity due to repositioning
the target on the slit and longer-term instrumental effects. These were
corrected by fitting first or second-order polynomials to the segments
between repositionings and are shown on the bottom portion for each date. All
panels are plotted to the same scale but with varying velocity offsets. As
these changes were of significantly longer time then the pulsations, there
was no impact on pulsation velocities.
![\begin{figure}
\par\resizebox{9cm}{!}{\includegraphics[angle=-90]{0775fg04.ps}}
\end{figure}](/articles/aa/full/2009/01/aa10775-08/img20.gif) |
Figure 4: Radial velocities obtained from cross-correlation of the time-resolved spectra. The top two panels show a run from KPNO both before and after fitting with polynomial segments and the bottom two panels show a run from the NOT before and after being fitted with polynomial segments. All panels are plotted to the same relative scale. |
| Open with DEXTER | |
Figure 5 shows the temporal spectra of the KPNO and NOT RV data
separately. The solid (blue) line shows the ![]() detection limit and the
insets show the spectral window. Results from least-squares fitting for the
amplitudes and phases are provided in Table 4 in Sect. 4.
Apparent in the figure is the missing peak where f3 should be in the
KPNO data. While
the
detection limit and the
insets show the spectral window. Results from least-squares fitting for the
amplitudes and phases are provided in Table 4 in Sect. 4.
Apparent in the figure is the missing peak where f3 should be in the
KPNO data. While
the ![]() limit is nearly double that of the NOT data, f2, f3,
and f4 have amplitudes in the NOT data which are sufficient to be detected in the
KPNO data. f2 and f4 are both at least marginally detected,
yet there is no trace of f3 at all. f1 shows a noisy ``bump'' in the
appropriate place, but at just over
limit is nearly double that of the NOT data, f2, f3,
and f4 have amplitudes in the NOT data which are sufficient to be detected in the
KPNO data. f2 and f4 are both at least marginally detected,
yet there is no trace of f3 at all. f1 shows a noisy ``bump'' in the
appropriate place, but at just over ![]() ,
it is below the detection limit.
,
it is below the detection limit.
![\begin{figure}
\par\resizebox{8cm}{!}{\includegraphics[angle=-90]{0775fg05.ps}}
\end{figure}](/articles/aa/full/2009/01/aa10775-08/img22.gif) |
Figure 5:
Pulsation spectra of radial velocity data. Insets are the
spectral
windows and (blue) lines indicate the |
| Open with DEXTER | |
Table 4: Results of photometric and spectroscopic variations in PG 1219.
We also compute the equivalent widths (EW) of the H![]() through H8 Balmer lines.
For our EW measurements,
we shifted the spectra using the cross-correlation velocities to account
for instrumental and pulsational velocity shifts.
The resulting standard deviation in velocity is 0.07 km s-1 with an
average CCF fit error of 5.34 km s-1.
To reduce the noise in the wings of the profiles, each point in the profile
was weighted with its own depth with respect to the continuum, using the
following non-standard form,
through H8 Balmer lines.
For our EW measurements,
we shifted the spectra using the cross-correlation velocities to account
for instrumental and pulsational velocity shifts.
The resulting standard deviation in velocity is 0.07 km s-1 with an
average CCF fit error of 5.34 km s-1.
To reduce the noise in the wings of the profiles, each point in the profile
was weighted with its own depth with respect to the continuum, using the
following non-standard form,
![]() .
No long-term trends were evident in the
EW data, so no polynomial corrections were made. The results are shown
in Fig. 6. f1 is below the detection limit for both KPNO and NOT
data, f2 and f4 are easily recovered in both sets, and f3 is clearly
detected in the NOT data, but just below
.
No long-term trends were evident in the
EW data, so no polynomial corrections were made. The results are shown
in Fig. 6. f1 is below the detection limit for both KPNO and NOT
data, f2 and f4 are easily recovered in both sets, and f3 is clearly
detected in the NOT data, but just below ![]() in the KPNO data.
As evident in Fig. 6, NOT EW values were found to be
systematically larger than for the
KPNO data. Analysis using various resolutions and line-bin-widths has shown
the amplitudes to be dependent on both the resolution and
the number of pixels used to determine the line widths. Because of these
dependencies it is not feasible to compare the amplitudes between
the two runs without some normalization.
As the photometric and RV amplitudes of f4 are the closest
between the runs, in Table 4 we have normalized the KPNO EW
amplitudes to that of f4 from the NOT run, while we show their
original amplitudes in Fig. 6.
in the KPNO data.
As evident in Fig. 6, NOT EW values were found to be
systematically larger than for the
KPNO data. Analysis using various resolutions and line-bin-widths has shown
the amplitudes to be dependent on both the resolution and
the number of pixels used to determine the line widths. Because of these
dependencies it is not feasible to compare the amplitudes between
the two runs without some normalization.
As the photometric and RV amplitudes of f4 are the closest
between the runs, in Table 4 we have normalized the KPNO EW
amplitudes to that of f4 from the NOT run, while we show their
original amplitudes in Fig. 6.
To measure changes in
![]() and
and ![]() for individual pulsation
frequencies, we folded the spectra into 20 phase bins according to the
pulsation periods. By folding over each pulsation period, we average out
the variations caused by the other three periods, effectively isolating
those of the folded period. The phase-binned spectra have S/N in the
range 125 to 160. We then fit these binned spectra
with the LTE synthesis model atmospheres
of Heber et al. (2000). The fitting is a
for individual pulsation
frequencies, we folded the spectra into 20 phase bins according to the
pulsation periods. By folding over each pulsation period, we average out
the variations caused by the other three periods, effectively isolating
those of the folded period. The phase-binned spectra have S/N in the
range 125 to 160. We then fit these binned spectra
with the LTE synthesis model atmospheres
of Heber et al. (2000). The fitting is a ![]() process described by
Bergeron et al. (1992) and updated to include helium abundance fits by
Saffer et al. (1994). These model fits provide values of
process described by
Bergeron et al. (1992) and updated to include helium abundance fits by
Saffer et al. (1994). These model fits provide values of
![]() ,
,
![]() ,
and helium abundance as a function of pulsation phase for
each of the periods. As the helium abundance did not change during
any of the pulsations, we fixed this to the mean value and refit the models,
mildly decreasing the fit errors on
,
and helium abundance as a function of pulsation phase for
each of the periods. As the helium abundance did not change during
any of the pulsations, we fixed this to the mean value and refit the models,
mildly decreasing the fit errors on
![]() and
and ![]() .
In
Fig. 7 we illustrate the fitting procedure by showing the
atmospheric fit to the template spectrum produced by combining all of the
NOT spectra. The lines used for the fit are shown in the figure and
include several Balmer lines and three He I lines. A single He II line
is shown, but was not used in the fit.
The fitted values for
.
In
Fig. 7 we illustrate the fitting procedure by showing the
atmospheric fit to the template spectrum produced by combining all of the
NOT spectra. The lines used for the fit are shown in the figure and
include several Balmer lines and three He I lines. A single He II line
is shown, but was not used in the fit.
The fitted values for
![]() ,
,
![]() ,
and N(He)/N(H) are also
provided on the figure and are nearly within the errors of those previously
published (Charpinet et al. 2005; Heber et al. 2000; Koen et al. 1999; O'Toole & Heber 2006).
There are known systematic effects between LTE and NLTE model atmospheres
with and without iron-group diffusion (Heber & Edelmann 2004; O'Toole & Heber 2006) and so we do not
claim any increased accuracy in our values, but merely show the lines
to illustrate the fitting procedure. O'Toole & Heber (2006) were able to overcome
these inconsistencies using supersolar metal abundances, so we consider
their measurements of
,
and N(He)/N(H) are also
provided on the figure and are nearly within the errors of those previously
published (Charpinet et al. 2005; Heber et al. 2000; Koen et al. 1999; O'Toole & Heber 2006).
There are known systematic effects between LTE and NLTE model atmospheres
with and without iron-group diffusion (Heber & Edelmann 2004; O'Toole & Heber 2006) and so we do not
claim any increased accuracy in our values, but merely show the lines
to illustrate the fitting procedure. O'Toole & Heber (2006) were able to overcome
these inconsistencies using supersolar metal abundances, so we consider
their measurements of
![]() and
and ![]() as the most reliable.
In our case we are not really
concerned with the actual values of
as the most reliable.
In our case we are not really
concerned with the actual values of
![]() and
and ![]() but the
changes that occur through a pulsation cycle. In this sense, minor
differences from previously reported values do not contribute to the
fit errors in the variations.
but the
changes that occur through a pulsation cycle. In this sense, minor
differences from previously reported values do not contribute to the
fit errors in the variations.
To determine amplitudes and phases of the measurables (or model quantities),
we used non-linear least-squares (NLLS) fits to
measure the amplitudes and phases
with the pulsation frequencies fixed to the those derived from photometry
(which match those in velocity). For photometry, RV, and EW,
we fit the data themselves with timing corrected to the barycenter of
the solar system. For
![]() and
and ![]() ,
these are model fits
to spectra folded over the frequency fixed to the photometric value. Then
the variations in model
,
these are model fits
to spectra folded over the frequency fixed to the photometric value. Then
the variations in model
![]() and
and ![]() were fit using our
NLLS routine. The phase-folded data, along with the
fits are shown in Figs. 8 through 11 with the quantities
provided in Table 4. Frequency-folded data were produced from
the photometric and RV data for the plot, but these were not fitted for
the quantities in Table 4 except as noted
(f3 RV and f1 EW data for KPNO).
Table 4 also provides the
were fit using our
NLLS routine. The phase-folded data, along with the
fits are shown in Figs. 8 through 11 with the quantities
provided in Table 4. Frequency-folded data were produced from
the photometric and RV data for the plot, but these were not fitted for
the quantities in Table 4 except as noted
(f3 RV and f1 EW data for KPNO).
Table 4 also provides the
![]() detection limits from the data.
No such values can be determined from the atmospheric model fits,
though their formal errors have been folded into the NLLS formal errors
shown in the figures and provided in the table.
detection limits from the data.
No such values can be determined from the atmospheric model fits,
though their formal errors have been folded into the NLLS formal errors
shown in the figures and provided in the table.
![\begin{figure}
\par\resizebox{9cm}{!}{\includegraphics[angle=-90]{0775fg06.ps}}
\end{figure}](/articles/aa/full/2009/01/aa10775-08/img27.gif) |
Figure 6: Temporal spectra of equivalent width data. |
| Open with DEXTER | |
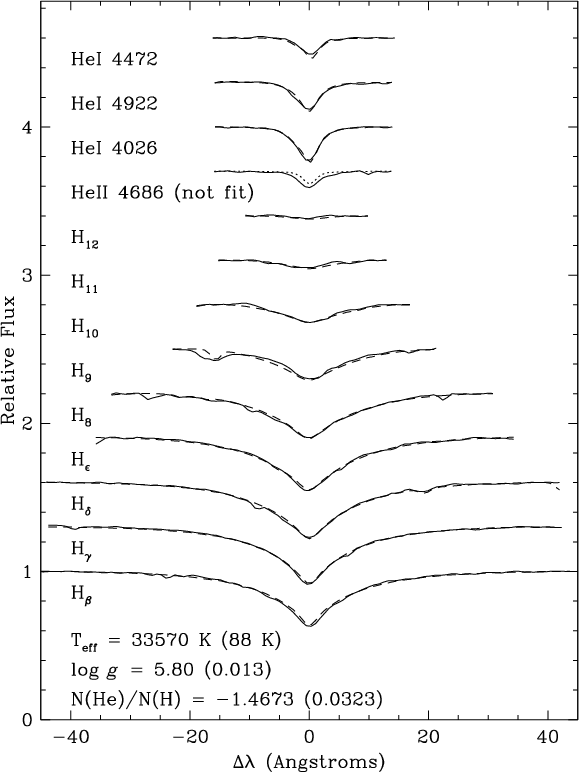 |
Figure 7: Atmospheric models (dashed lines) fitted to the template spectrum of combined NOT data for several H and He I lines. The He II line is shown, but not used in the fit. Line identifiers and resultant atmospheric parameters are provided at the bottom. |
| Open with DEXTER | |
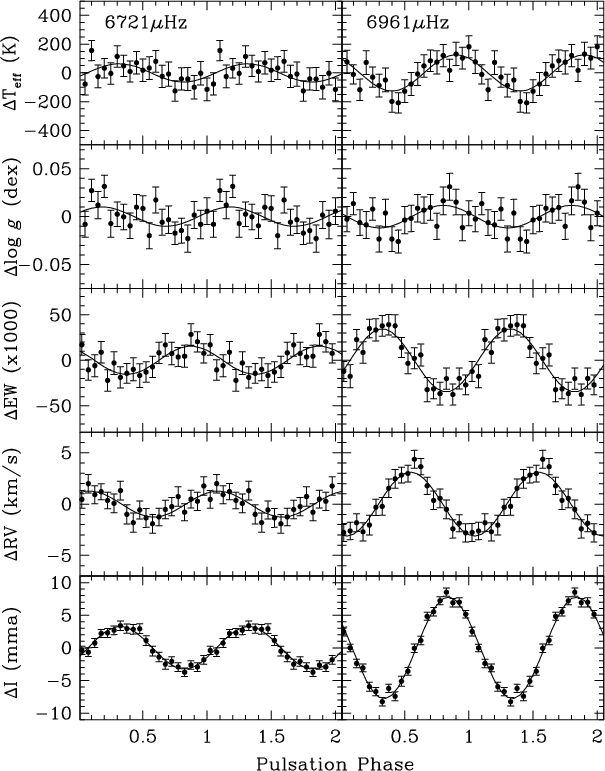 |
Figure 8:
Variations in
|
| Open with DEXTER | |
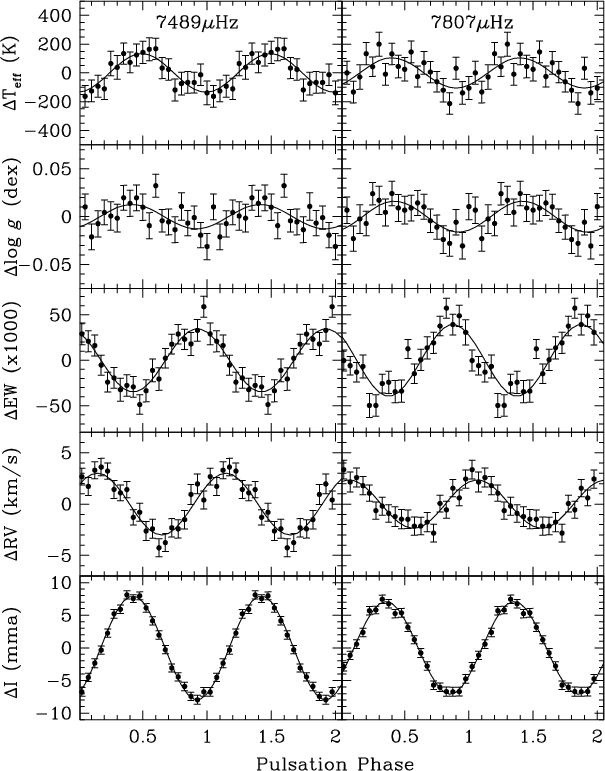 |
Figure 9:
Same as Fig. 8 for f3 = 7489 and
|
| Open with DEXTER | |
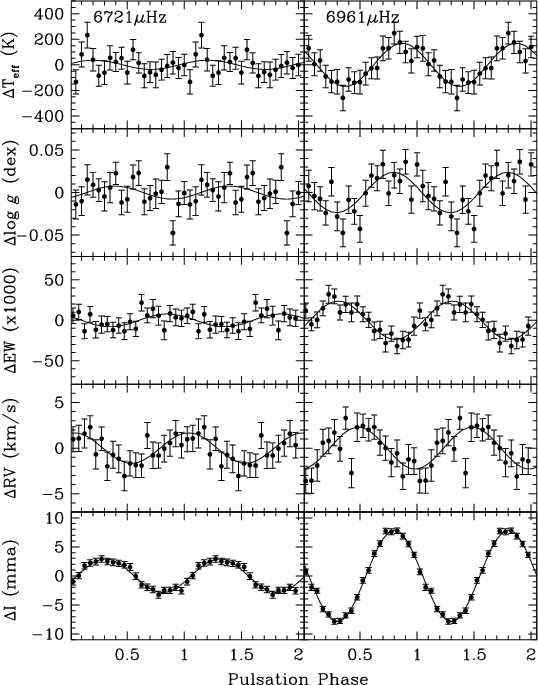 |
Figure 10: Same as Fig. 8 for KPNO/MDM data. |
| Open with DEXTER | |
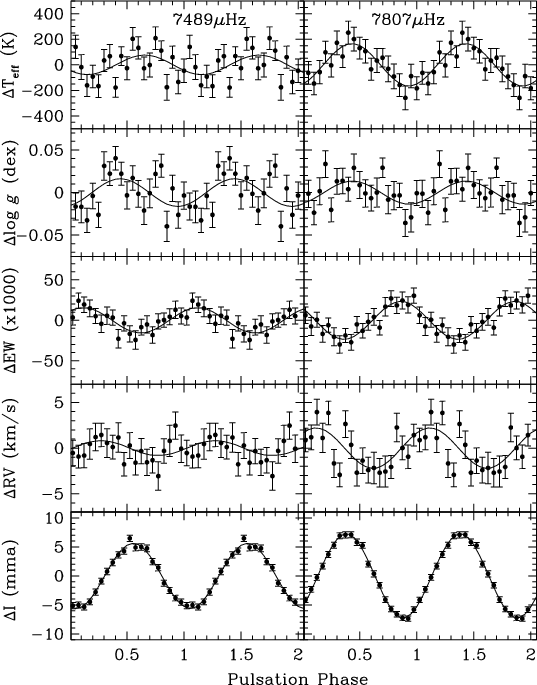 |
Figure 11: Same as Fig. 9 for KPNO/MDM data. |
| Open with DEXTER | |
Since we know that the pulsations are phase-stable during our photometric
observations, we can
expect them to be phase-stable for the other measurables, and our results
indicate it to be the case. Even the 13% change in phase for f3 between the
MDM and BO runs is measured, to within the errors for RV, EW,
![]() ,
and
,
and ![]() between the KPNO and NOT runs, even though
some amplitudes show large variations. This indicates that our
phases are measured reliably.
between the KPNO and NOT runs, even though
some amplitudes show large variations. This indicates that our
phases are measured reliably.
While we leave any attempts at mode identification to the second paper, which will properly simulate our results using pulsation models, it is still interesting to examine what we detected in such a context. It is expected that pulsations of various modes will behave differently between photometry, velocity, equivalent width, effective temperature, and gravity measurements, and that such differences (and similarities) will provide strong constraints on mode identifications. There has already been a model for this star matched to photometric data (Charpinet et al. 2005) which concluded that our four measured frequencies should be associated with three different pulsation degrees. As such, we should expect observable differences between our measured quantities. The mode identifications of Charpinet et al. (2005) are provided in Fig. 12.
Figures 12 through 14 show amplitude ratios and
phase differences of the observables using most of
the available combinations. Figure 12 shows those quantities
directly obtained from the data, Fig. 13 excludes photometry,
but includes spectroscopic quantities derived from models, and Fig. 14
compares the photometry with the model quantities. Values for the NOT/BO
data have solid errorbars while those for the KPNO/MDM data have dotted
errorbars.
We note that most of our quantities are
within the ![]() errors of all other quantities, when the
largely instrumental EW offset
between data sets is accounted for.
While we do not attempt any
mode identifications here, the similarities exhibited between the amplitude
ratios suggest low degree modes with
errors of all other quantities, when the
largely instrumental EW offset
between data sets is accounted for.
While we do not attempt any
mode identifications here, the similarities exhibited between the amplitude
ratios suggest low degree modes with
![]() ,
which can behave
similarly at most inclinations. The
,
which can behave
similarly at most inclinations. The ![]() identification
for f3 seems unlikely since this frequency behaves very much like the
others. However, there are no published model amplitude ratios by which
to judge our results.
identification
for f3 seems unlikely since this frequency behaves very much like the
others. However, there are no published model amplitude ratios by which
to judge our results.
There are some expected relationships in phases that can be used to
deduce the accuracy of the data as well. It is known that in low-degree modes,
RV phases should be separated by one quarter (![]() )
from
)
from
![]() ,
,
![]() ,
EW and
photometric phases for adiabatic pulsations. This has been
observed for other sdBV stars (Tillich et al. 2007; Telting & Østensen 2004), and we see the same
thing. It should also be
expected that brightness,
,
EW and
photometric phases for adiabatic pulsations. This has been
observed for other sdBV stars (Tillich et al. 2007; Telting & Østensen 2004), and we see the same
thing. It should also be
expected that brightness,
![]() ,
and
,
and ![]() should all be in
phase but EW should be in anti-phase to these observables, and again, this is
what we observe.
Expected phase relations, deduced from atmospheric models are indicated as
dashed lines in the figures. Our observations scatter tightly around these
lines, indicating that our spectroscopic reductions and model fitting
are reliable.
should all be in
phase but EW should be in anti-phase to these observables, and again, this is
what we observe.
Expected phase relations, deduced from atmospheric models are indicated as
dashed lines in the figures. Our observations scatter tightly around these
lines, indicating that our spectroscopic reductions and model fitting
are reliable.
![\begin{figure}
\par\resizebox{9cm}{!}{\includegraphics[width=17cm]{0775fg12.eps}}
\end{figure}](/articles/aa/full/2009/01/aa10775-08/img39.gif) |
Figure 12: Amplitude ratios versus phase differences for fitted observables. Solid errorbars indicate NOT/BO data while dotted errorbars indicate KPNO/MDM data. Dashed (blue) lines indicate expected phases from model simulations and mode identifications are those of Charpinet et al. (2005). |
| Open with DEXTER | |
![\begin{figure}
\par\resizebox{9cm}{!}{\includegraphics[width=17cm]{0775fg13.eps}}
\end{figure}](/articles/aa/full/2009/01/aa10775-08/img40.gif) |
Figure 13: Same as Fig. 12 for quantities determined solely from spectroscopy. |
| Open with DEXTER | |
From four years of photometry, we determine that PG 1219 has four consistent frequencies with occasional low-amplitude transients. One such transient occurred during our spectroscopic runs, though we did not recover that frequency in any of our spectroscopically-determined quantities. The photometric amplitudes of f1, f2, and f4 remain stable over the course of our observations but the amplitude of f3 increased by 43% between our MDM and BO observations. Similarly, the photometric phases were stable during our observations, but most varied between the runs. That of f3 showed the largest change in phase of 13% while f2 and f4 had changes of 4 and 3%, respectively. Only f1 had no phase changes, to within the errors.
Our spectroscopic results were similar, in that only f3 showed significant amplitude variations between the runs. It has a very low RV amplitude of 0.8 km s in the KPNO data, which grows to an amplitude of 3.0 km s-1in the NOT data. However, the differences in normalized EW amplitudes are within the errors for all frequencies.
By folding the
spectra over the pulsation period, we were able to fit atmospheric
models to the higher S/N binned spectra to extract
![]() and
and ![]() variations for all four frequencies.
Again all pulsation amplitudes are consistent between the KPNO and
NOT data, except for f3 in
variations for all four frequencies.
Again all pulsation amplitudes are consistent between the KPNO and
NOT data, except for f3 in
![]() which more than doubles.
As such, f3 has significant amplitude increases of 43, 275, and 124%
between the KPNO/MDM and NOT/BO observations for photometry, RV, and
which more than doubles.
As such, f3 has significant amplitude increases of 43, 275, and 124%
between the KPNO/MDM and NOT/BO observations for photometry, RV, and
![]() ,
respectively. While there is a 33% increase in EW amplitude
between the runs for f3, it is just within the
,
respectively. While there is a 33% increase in EW amplitude
between the runs for f3, it is just within the ![]() errors.
errors.
We examined amplitude ratios and phase differences for various
measurables for each frequency. We will interpret these more fully in
a subsequent paper, but observationally, we can conclude that the
ratios and differences do not differ greatly between frequencies. The
simplest interpretation of this result is that they are all low-degree
(
![]() )
modes. We also compared phase differences to those
expected from adiabatic atmospheric models. Our measured differences
match those expected, except for small departures which are most likely
caused by nonadiabatic effects.
)
modes. We also compared phase differences to those
expected from adiabatic atmospheric models. Our measured differences
match those expected, except for small departures which are most likely
caused by nonadiabatic effects.
A large arsenal of quantities can now be applied to identify the modes of pulsation. A future paper will match our measured quantities to those from perturbed synthetic pulsation spectra to constrain the modes of each frequency. This work is also the first successful application of time-series spectroscopy to a ``normal'' amplitude sdBV star. All previous detections were of stars with unusually high photometric amplitudes (Telting & Østensen 2006; Tillich et al. 2007; Telting & Østensen 2004; O'Toole et al. 2002,2003; Woolf et al. 2002; O'Toole et al. 2005,2000) and so our work indicates that such studies can provide useful measurements for the majority of sdBV stars.
![\begin{figure}
\par\resizebox{9cm}{!}{\includegraphics[width=17cm]{0775fg14.eps}}
\end{figure}](/articles/aa/full/2009/01/aa10775-08/img41.gif) |
Figure 14: Same as Fig. 12 comparing photometry and model-fitted quantities. |
| Open with DEXTER | |
Acknowledgements
We would like to thank Simon Jeffery for some of the atmospheric models and fitting routines used in our analysis and the NOT, MDM, and KPNO TACs for time allocations. M.D.R. was supported by an American Astronomical Society Small Research Grant and the National Science Foundation Grant AST007480. Any opinions, findings, and conclusions or recommendations expressed in this material are those of the author(s) and donot necessarily reflect the views of the American Astronomical Society or the National Science Foundation. M.D.R. would also like to thank Conny Aerts and a HELAS travel grant which allowed us to congregate in Leuven to work on atmospheric models. J.R.E., S.L.H., and R.L.V.W. were supported by the Missouri Space Grant Consortium and an REU Supplement grant from the National Science Foundation. R.Ø. is supported by the Research Council of the University of Leuven and the FP6 Coordination Action HELAS of the EU. Some of the data presented here have been taken using ALFOSC, which is owned by the Instituo de Astrofisica de Andalucia (IAA) and operated at the Nordic Optical Telescope under agreement between IAA and the NBIfAFG of the Astronomical Observatory of Copenhagen. Based on observations made with the Nordic Optical Telescope, operated on the island of La Palma jointly by Denmark, Finland, Iceland, Norway, and Sweden, in the Spanish Observatorio del Roque de los Muchachos of the Instituto de Astrofisica de Canarias.