A&A 492, 575-583 (2008)
DOI: 10.1051/0004-6361:200809507
The structure and dynamics of a bright point as seen with Hinode,
SoHO and TRACE
D. Pérez-Suárez1 - R. C.
Maclean1,3 - J. G. Doyle1 - M. S. Madjarska2
1 - Armagh Observatory, College Hill, Armagh BT61 9DG, N. Ireland, UK
2 -
Max-Planck-Institut für Sonnensystemforschung, Max-Planck-Str. 2, 37191
Katlenburg-Lindau, Germany
3 -
now at: School of Mathematics and Statistics, University of St. Andrews,
North Haugh, St. Andrews, Fife KY16 9SS, UK
Received 4 February 2008 / Accepted 6 September 2008
Abstract
Context. Solar coronal bright points have been studied for more than three decades, but some fundamental questions about their formation and evolution still remain unanswered.
Aims. Our aim is to determine the plasma properties of a coronal bright point and compare its magnetic topology extrapolated from magnetogram data with its appearance in X-ray images.
Methods. We analyse spectroscopic data obtained with EIS/Hinode, Ca II H and G-band images from SOT/Hinode, UV images from TRACE, X-ray images from XRT/Hinode and high-resolution/high-cadence magnetogram data from MDI/SoHO.
Results. The BP comprises several coronal loops as seen in the X-ray images, while the chromospheric structure consists of tens of small bright points as seen in Ca II H. An excellent correlation exists between the Ca II H bright points and increases in the magnetic field strength, implying that the Ca II H passband is a good indicator for the concentration of magnetic flux. Furthermore, some of the Ca II H bright points are the locations of the loop foot-points as determined from a comparison between the extrapolated magnetic field configuration and the X-ray images. Doppler velocities between 6 and 15 km s-1 are derived from the Fe XII and Fe XIII lines for the bright point region, while for Fe XIV and Si VII they are in the range from -15 to +15 km s-1. The coronal electron density is
 cm-3. An excellent correlation is found between the positive magnetic flux and the X-ray light-curves.
Conclusions. The remarkable agreement between the extrapolated magnetic field configuration and some of the loops composing the bright point as seen in the X-ray images suggests that a large fraction of the magnetic field in the bright point is close to potential. However, some loops in the X-ray images do not have a counterpart in the extrapolated magnetic field configuration implying a non-potential component. The close correlation between the positive magnetic flux and the X-ray emission suggests that energy released by magnetic reconnection is stimulated by flux emergence or cancellation.
Key words: Sun: activity - Sun: magnetic fields - Sun: corona - Sun:
chromosphere - line: profiles
Coronal X-ray bright points (BPs) were first observed in rocket images in 1969
(Vaiana et al. 1973) and were seen as diffuse clouds with a bright
core, although when viewed at higher spatial resolution, small loops are resolvable
(Sheeley & Golub 1979). BPs are coronal structures smaller than 60
 that are associated with the interaction of photospheric bipolar magnetic features.
Up to two third of them are related to cancellation of pre-existing magnetic
features rather than to the emergence of new magnetic flux (Webb et al. 1993).
McIntosh & Gurman (2005) recently reported on bright point statistics showing
that 100 times more BPs were observable in EIT 171 Å than in the
284 Å filter. They speculated that there is a temperature dependence in
the generation mechanism.
The lifetime of an individual BP can be up to
that are associated with the interaction of photospheric bipolar magnetic features.
Up to two third of them are related to cancellation of pre-existing magnetic
features rather than to the emergence of new magnetic flux (Webb et al. 1993).
McIntosh & Gurman (2005) recently reported on bright point statistics showing
that 100 times more BPs were observable in EIT 171 Å than in the
284 Å filter. They speculated that there is a temperature dependence in
the generation mechanism.
The lifetime of an individual BP can be up to  40 h
(Golub et al. 1974).
40 h
(Golub et al. 1974).
Habbal & Withbroe (1981)
used Skylab data to show that BPs exhibit large variations in their
emission in chromospheric, transition region and coronal lines. This
work was followed up more recently by Madjarska et al. (2003),
Ugarte-Urra et al. (2004) and Ugarte-Urra et al. (2005) who
studied BPs at transition region temperatures and derived their
plasma characteristics such as electron density variability, Doppler
shifts and intensity oscillations. The magnetic structure of BPs has
been modelled by various authors
(von Rekowski et al. 2006a; Longcope et al. 2001; Parnell et al. 1994; Brown et al. 2001). The general view is that
these features result from magnetic reconnection, although
identifying the specific type of reconnection involved is still a
challenge. Coronal reconnection begins when opposite polarity
magnetic fragments approach one another, with the resulting release
of energy into the corona leading to the formation of a BP.
With the launch of Hinode (Kosugi et al. 2007), new frontiers
have opened for studying coronal BPs in combination with data from
the Solar & Heliospheric Observatory (SoHO; Domingo et al. 1995) and the Transition
Region and Coronal Explorer (TRACE; Handy et al. 1999). Here we present the results of
a multi-spacecraft/multi-instrument study of a BP. We use the EUV
Imaging Spectrometer (EIS/Hinode; Culhane et al. 2007) together with Ca II H and
G-band images from the Solar Optical Telescope (SOT/Hinode; Tsuneta et al. 2007), EUV
images from TRACE and the Extreme ultraviolet Imaging Telescope
(EIT/SoHO; Delaboudinière et al. 1995), and X-ray images from the
X-ray Telescope
(XRT/Hinode; Kano et al. 2007; Golub et al. 2007) as
well as high-resolution/high-cadence magnetograms from the Michelson
Doppler Imager (MDI/SoHO; Scherrer et al. 1995).
With the high-cadence magnetic field data coupled with images from
XRT plus Ca II H and G-band data, we look at the structure of
the bright point at photospheric, chromospheric and coronal
heights to determine the location of sites of energy dissipation (Sect. 3). This is
then combined with EIS spectral data on
transition region and coronal lines to determine the flow, temperature and
electron density structure of the bright point. Finally, in
Sect. 4, a magnetic charge topology (MCT) analysis
(Longcope 2005) is used to study the structure and
evolution of the three-dimensional (3D) magnetic field associated with the bright point.
These extrapolations are then compared with the appearance of the BP in XRT images,
and the location of the Ca II BPs is compared with that of the
foot-points of the extrapolated magnetic field lines.
Table 1:
Description of the analysed data.
The data analysed here were obtained on 2007 April 13 between
16:30 UT and 23:54 UT. We used two types of instrument: imagers and
spectrographs. The characteristics of the data obtained from the
imagers are outlined in Table 1.
Three rasters and two time series were obtained from EIS/Hinode with
the study ``BP_SUMER_EIS''. The rasters were made by stepping
the 2
slit in 1.87
increments across an area of
 around the centre of the solar disc
with an exposure time of 45 s. Detailed information about the
observed spectral lines can be found in Table 2. The
BP studied here was not in the field-of-view of the time series.
Hence, we only use the raster data. All the data have been reduced
and calibrated with the standard procedures as given in the
SolarSoft (SSW)
around the centre of the solar disc
with an exposure time of 45 s. Detailed information about the
observed spectral lines can be found in Table 2. The
BP studied here was not in the field-of-view of the time series.
Hence, we only use the raster data. All the data have been reduced
and calibrated with the standard procedures as given in the
SolarSoft (SSW)![[*]](/icons/foot_motif.gif) library. Further details may be obtained from the instrument
webpages.
library. Further details may be obtained from the instrument
webpages.
Table 2:
A list of the various spectral lines present in the nine
EIS/Hinode spectral windows for the rasters.
![\begin{figure}
\par\includegraphics[width=4.8cm,clip]{9507f01a.eps}\hspace*{4mm}...
....eps}\hspace*{4mm}
\includegraphics[width=4.8cm,clip]{9507f01c.eps}
\end{figure}](/articles/aa/full/2008/47/aa09507-08/Timg11.gif) |
Figure 1:
Images of the bright point as seen on 13 April 2007. Left to right: EIT
(22:00:11 UT), MDI (22:01:01 UT) and XRT (22:01:05 UT). The outlined dashed
box is the FOV as shown in Fig. 2, while the dot-dashed box is the region shown in Fig. 3. |
| Open with DEXTER |
![\begin{figure}
\par\includegraphics[width=4.8cm,clip]{9507f02a.eps}\hspace*{4mm}...
...eps}\hspace*{4mm}
\includegraphics[width=4.8cm,clip]{9507f02c.eps}
\end{figure}](/articles/aa/full/2008/47/aa09507-08/Timg12.gif) |
Figure 2:
Images of the bright point (overlaid with MDI magnetic field
contours of   150 G) as
seen on 13 April 2007. From left to right:
TRACE 1550 Å filter (22:00:12 UT), SOT Ca II H (22:01:10 UT) and SOT G-band (22:01:06 UT). 150 G) as
seen on 13 April 2007. From left to right:
TRACE 1550 Å filter (22:00:12 UT), SOT Ca II H (22:01:10 UT) and SOT G-band (22:01:06 UT). |
| Open with DEXTER |
All images from TRACE and Hinode were converted to SoHO view (L1) and co-aligned as described below.
The first step was to remove any jitter in each instrument by
cross-correlating all the images with the mean image.
Then all data were aligned
with respect to the TRACE 1550 Å images. First we cross-correlated TRACE 1550 Å with the SOT Ca II H images and found a variable offset
from 4
to 10
in the E-W direction (Solar X), and from 10
to 15
in the N-S direction (Solar Y). We then
aligned the EIS He II 304 Å raster
images with SOT Ca II H and TRACE 1550 Å. The next step was
to cross-correlate EIS Fe XII 195 Å images with XRT, and
XRT with EIT. We obtained offsets between SOT and XRT close to those
derived by Shimizu et al. (2007) i.e. 2
in Solar X and 14
in Solar Y.
Between EIS and SOT we obtained values similar to those shown in
EIS-wiki, i.e.
17
in Solar X and 20
in Solar Y with the long-wave CCD. The internal offsets between
the two CCDs within EIS are known (Young et al. 2007b).
MDI was then cross-correlated with Ca II H and TRACE 1550 Å. All images
were rotated to a common time chosen to be 19:00 UT.
The temperature response of the XRT Al-mesh filter has a double peak,
with the first peak below 106 K and the second one at
 K. The peak response of the TRACE 171 Å filter is around
106 K, thus we compared our five TRACE 171 Å images with the XRT
images in order to examine the extent of the overlap and therefore
gain some insight into the temperature of the BP. The XRT images show
a central brightening, whereas in TRACE 171 Å the bright area is
at least 50% smaller, thus indicating that the bulk of
the BP has a temperature structure above 106 K.
K. The peak response of the TRACE 171 Å filter is around
106 K, thus we compared our five TRACE 171 Å images with the XRT
images in order to examine the extent of the overlap and therefore
gain some insight into the temperature of the BP. The XRT images show
a central brightening, whereas in TRACE 171 Å the bright area is
at least 50% smaller, thus indicating that the bulk of
the BP has a temperature structure above 106 K.
The EIS data have two major instrumental effects which have to be corrected: a
tilt in the slit on the CCD and a sinusoidal drift of the lines on
the detector due to orbital changes. The orbital variation is of the order
of 1.3 spectral pixels (45 km s-1), while the tilt correction
amounted to 77 km s-1 over the length of the slit for
the strong Fe XII 195.12 Å line.
3 Results and discussion
The bright point was first identified in the EIT and XRT images,
which showed a structure of
 .
The BP first
appeared on 12 April 2007 (EIT 195 Å) at 22:24 UT and disappeared
on 14 April 2007 at 13:13 UT resulting in a
lifetime of approximately 37 h. The general shape of the BP as viewed
with EIT was almost constant throughout its lifetime
(Fig. 1, left panel). In XRT, the overall structure of
the BP did not change significantly throughout its lifetime,
although small changes occurred which will be discussed
later in the paper.
.
The BP first
appeared on 12 April 2007 (EIT 195 Å) at 22:24 UT and disappeared
on 14 April 2007 at 13:13 UT resulting in a
lifetime of approximately 37 h. The general shape of the BP as viewed
with EIT was almost constant throughout its lifetime
(Fig. 1, left panel). In XRT, the overall structure of
the BP did not change significantly throughout its lifetime,
although small changes occurred which will be discussed
later in the paper.
Another factor confirming that this feature is a bright point is its
magnetic field configuration. EUV/SXR bright points are generally associated with
two interacting magnetic polarities of opposite sign. As we can see in
Fig. 1 (middle panel), this BP is dominated by a negative field, and as
Parnell et al. (1994) predicted, it looks brighter over the
area with the stronger magnetic flux. The BP was created following
the emergence of a small positive magnetic patch on 12 April at
20:48 UT into a region dominated
by negative field patches. Unfortunately, we do not have
high-resolution MDI data until 20:56 UT the next day, so we are
unable to comment on the magnetic field evolution during this period of time. In the
XRT images (Fig. 1, right panel), the BP is seen as a blurred feature,
however, when image sharpening is applied, it is possible to distinguish
individual loop structures that evolve in time (see later). These loops
connect the opposite polarities seen in MDI. We also observe a
jet-like feature that appears between the two closest bipolar
structures, with a flux intensity 3 to 30 times stronger than the quiet Sun value.
The high-resolution MDI images give a detailed view of the BP's
magnetic field configuration. Its shape is that of an inverted question
mark throughout the period of the MDI observations (2 h), but in
detail there are some small magnetic patches that appear, disappear,
merge and split. This will be discussed in more detail in Sect. 4.
The BP was observed in the lower atmospheric layers with TRACE 1550 Å and SOT/Hinode
Ca II H and G-band (Fig. 2 left, middle and right panel
respectively). All of them show a general shape consistent with
the location of the strong magnetic field regions.
As seen by TRACE, the BP consists of around 50 small bright point-like features
with a size of
 .
Several are grouped together
forming a large feature while others are isolated. These latter ones are less quiet.
Since the TRACE 1550 Å bandpass is rather wide it is difficult to say whether the
detected variability happen at chromospheric or transition region
temperatures, although previous studies suggest that in
features such as BPs, the C IV 1548/1550 Å lines should
dominate.
.
Several are grouped together
forming a large feature while others are isolated. These latter ones are less quiet.
Since the TRACE 1550 Å bandpass is rather wide it is difficult to say whether the
detected variability happen at chromospheric or transition region
temperatures, although previous studies suggest that in
features such as BPs, the C IV 1548/1550 Å lines should
dominate.
G-band images show a good correlation with what is seen in TRACE 1550 Å. The brightenings
appear at the edges of the granules, moving around them. Finally, in
Ca II H,
the brightenings are just one third brighter than the background.
A detailed observation of these small chromospheric BPs in
space and time shows, when they are compared with high-resolution MDI
magnetograms, that they are a good indicator for concentration of the
magnetic flux.
![\begin{figure}
\par\includegraphics[width=3.18cm,clip]{9507f03a.eps}\hspace*{4mm...
...}\hspace*{4mm}
\includegraphics[width=4.5cm,clip]{9507f03d.eps}
\par\end{figure}](/articles/aa/full/2008/47/aa09507-08/Timg16.gif) |
Figure 3:
Images of the bright point as seen on 13 April 2007 showing the
intensity in Fe XII 195.12 Å, the Doppler velocity as measured by
Fe XII 195.12 Å, the electron density as measured by the
Fe XII (186.88+186.85)/(195.12+195.18) line ratio and the FWHM obtained
in Fe XII 195.12 Å. The solid lines are the intensity contours, while the
dashed and dotted lines are the MDI magnetic field contours 150 G. These data were taken between 22:01:14 UT and 22:32:31 UT. |
| Open with DEXTER |
EIS observed the BP in three rasters starting at 18:25 UT, 20:13 UT
and 22:01 UT. Each raster lasted 31 mins. We fitted
the Fe XII 186.88 Å and Fe XIII 202.04 Å lines with a single Gaussian;
for Fe XII 195.12 Å and Fe XIII 203.80 Å double and triple
Gaussians were used, as justified by Young et al. (2008).
For every pixel we obtain the total intensity, the line centre and the
line width.
Figure 3 (1st panel) shows the 21:01 UT raster
as seen in Fe XII 195 Å, while Fig. 3 (2nd panel)
shows the corresponding Doppler velocities. The electron density as
determined with the Fe XII 186/195 line ratio (after fixing the
grating tilt Young et al. 2008) is shown
in Fig. 3 (3rd panel) and the line width of Fe
XII 195Å is given in Fig. 3 (4th panel). The Doppler
velocities were calculated relative to the whole dataset. It is
clear that the South-East section of the bright point has a
predominant redshift.
Table 3:
Mean Doppler shift of the BP as a whole along the three rasters.
In Table 3 we show the Doppler velocities of the BP obtained from a single
spectrum averaged over the whole BP. The general trend is for the
lines to be red-shifted. If we look in detail, however, the range
of velocities in the BP varies between different locations.
We obtain for Fe X 184.54 Å values in the range from -10 to +10 km s-1, for Fe XII 195.119 Å values from -8 to +8 km s-1,
whereas for the Fe XIII 202.04 Å there is a red shift in the most of the pixels within
a range of 6 to 18 km s-1. In the case of He II 256.32 Å, the values oscillate between +5 to +25 km s-1 but it is not reliable because the line is blended on the red side by
Si X 256.37 Å, Fe XIII 256.42 Å and Fe XII 256.41 Å (Young et al. 2007a).
For the hottest line studied, Fe XIV 240.52 Å, we obtained values in a range -15 to +15 km s-1.
For the coolest line, Si VII 275.35 Å, we obtain a similar range.
Brosius et al. (2007) recently showed some Doppler shift from a BP. The
values that we obtained are in the range which they showed for the same ions,
i.e. He II and Fe XIV. For Fe X 184.54 Å and Si VII 275.35 Å we obtain
errors of 4 km s-1; for Fe XIV 270.52 Å the errors are
2 km s-1. For the rest of the
stronger lines, the error is smaller, being 1 km s-1.
In addition to Fe XII 186.88+186.854/195.119
(note that S XI 186.83 Å contributes about 5% blending,
Peter Young, private communication), we also used Fe XIII 203.797+203.828/202.04
with the atomic data for both ions from the CHIANTI database
(Landi et al. 2006; Dere et al. 1997) to derive the electron density. This line pair is almost temperature insensitive; changing the formation
temperature by  produces less than a
  change in the electron
density. For
each raster, we selected an area of
change in the electron
density. For
each raster, we selected an area of
 over
the BP (see Table 1). We used a quiet Sun area to determine the background
emission. The results for one of the rasters are shown in Fig. 3
(3rd panel). It is easy to see the structure of the bright
point. Furthermore, there is an increment in the electron density in
the core of the bright point. Excellent agreement is obtained
between the two ratios, implying an electron density of
cm-3 at coronal temperatures.
over
the BP (see Table 1). We used a quiet Sun area to determine the background
emission. The results for one of the rasters are shown in Fig. 3
(3rd panel). It is easy to see the structure of the bright
point. Furthermore, there is an increment in the electron density in
the core of the bright point. Excellent agreement is obtained
between the two ratios, implying an electron density of
cm-3 at coronal temperatures.
The width of the Fe XII 195.12 Å line (Fig. 3, 4th
panel) shows an increment of 10 mÅ in the bottom part of the BP compared with the
top and background. This is the location of the strong negative
magnetic field. This is also the location of the largest line-shift, which may suggest a high degree of turbulence and/or additional unresolved
flows in the loops.
4 Magnetic topology
![\begin{figure}
\par\includegraphics[width=7.8cm,clip]{9507f04a.eps}
\end{figure}](/articles/aa/full/2008/47/aa09507-08/Timg20.gif) |
Figure 4:
Time variation of the magnetic fluxes of the two main BP
magnetic polarities. The solid line indicates the positive polarity,
and the dashed line indicates the negative polarity. In the inner
panel both fluxes are normalized. The dotted line shows the XRT
flux of the BP. |
| Open with DEXTER |
MDI took high-resolution line-of-sight photospheric magnetogram data of the
bright point between 20:54 UT and 23:09 UT. This dataset of just over two hours
with approximately one-minute cadence shows the longitudinal magnetic field
evolution associated with the BP between 22 and 24 h into its lifetime.
High-resolution MDI data are required to sufficiently resolve the
small-scale magnetic structure of the BP. Unfortunately, only
data from these two hours are available. The XRT observations show
that the overall structure of the BP does not change significantly
throughout its lifetime, although smaller changes are occurring (see
later).
The magnetic field underlying the BP is composed of a region of
positive magnetic polarity of about 10 arcsec2 in size, and a
larger region of negative polarity in the shape of an ``upside-down
question mark'' (20 arcsec in diameter, see Fig. 1).
During the two-hour observation period, the variation of the
integrated magnetic flux within both polarities was relatively
small, as shown in Fig. 4.
We modelled the three-dimensional magnetic topology
(Longcope 2005; Beveridge et al. 2002; Longcope & Klapper 2002; Démoulin & Priest 1992) of the BP and a
 region surrounding it. Ideally the largest area
possible would be selected (i.e. extending out to where the data starts
to become questionable near the limb), so as to include the effects of strong
sources far from the feature of interest. However, there is a compromise to be
made here, because the topological reconstruction method that we use requires
the selected area to be small enough to be accurately represented by a set of
point sources on a flat photospheric plane. This means that the selected region
must be small enough to make the assumption of a flat photospheric boundary
acceptable. The box size was chosen on the basis of both these considerations.
Additionally as a check, the topology was also calculated for a
region surrounding it. Ideally the largest area
possible would be selected (i.e. extending out to where the data starts
to become questionable near the limb), so as to include the effects of strong
sources far from the feature of interest. However, there is a compromise to be
made here, because the topological reconstruction method that we use requires
the selected area to be small enough to be accurately represented by a set of
point sources on a flat photospheric plane. This means that the selected region
must be small enough to make the assumption of a flat photospheric boundary
acceptable. The box size was chosen on the basis of both these considerations.
Additionally as a check, the topology was also calculated for a
 region centred on the bright point, and although some features
shifted position slightly, the large-scale topological structure was identical.
We therefore have a high level of confidence that the BP topology that we present
here is a good approximation to the true magnetic field configuration that
occurred in the solar atmosphere.
region centred on the bright point, and although some features
shifted position slightly, the large-scale topological structure was identical.
We therefore have a high level of confidence that the BP topology that we present
here is a good approximation to the true magnetic field configuration that
occurred in the solar atmosphere.
First a five-minute running
average of the raw magnetograms was calculated, to account for the
ubiquitous five-minute oscillations, and to reduce high-frequency
noise. We then used the YAFTA feature-tracking code of
Welsch et al. (2004) and DeForest et al. (2007) to find and track features in the
magnetogram. These features were further reduced to point magnetic
sources, with location and strength determined by their parent
features. The MPOLE topology code of Longcope (1996) was used to
extrapolate the 3D potential magnetic field created by the point
sources, and to determine its magnetic topology, i.e. the locations
of the magnetic null points, spine field-lines, separatrix surfaces,
and separators.
![\begin{figure}
\par\includegraphics[width=4.2cm,clip]{9507f05a.eps}\includegraphics[width=3.8cm,clip]{9507f05b.eps}
\end{figure}](/articles/aa/full/2008/47/aa09507-08/Timg23.gif) |
Figure 5:
A plan view of the topology of the BP region at
21:14:02 UT on 13 April 2007 overlaid on the MDI image. ``+'' represents positive
magnetic sources, `` '' represents negative sources,
upwards-pointing triangles represent positive magnetic null points,
and downwards-pointing triangles represent negative null points.
In the photospheric plane, solid fieldlines are spines, and dashed fieldlines are the
intersection of separatrix surfaces with the photosphere. 3D solid magnetic field-lines have also been plotted to show the important separatrix surface in the topology: the dome of field-lines contains all the magnetic
flux in the BP. The brightening in XRT shows a similar outline. '' represents negative sources,
upwards-pointing triangles represent positive magnetic null points,
and downwards-pointing triangles represent negative null points.
In the photospheric plane, solid fieldlines are spines, and dashed fieldlines are the
intersection of separatrix surfaces with the photosphere. 3D solid magnetic field-lines have also been plotted to show the important separatrix surface in the topology: the dome of field-lines contains all the magnetic
flux in the BP. The brightening in XRT shows a similar outline. |
| Open with DEXTER |
Because the positive polarity region (P) is so much weaker than the
negative polarity region (N), all of the magnetic flux from the positive
polarity connects to the negative polarity. The overlying field is
produced by two plage regions, one dominated by negative magnetic polarity
to the east and slightly south of the BP, and the other dominated by
positive magnetic polarity to the west and slightly north of the BP. This
means that field-lines from the negative polarity that do not connect to the
positive polarity have a tendency to connect to source regions in the
positive plage area. Such field-lines can extend at least 100 arcsec
away from the BP, and probably much further. This means that the BP is
magnetically linked to many other features far away from it on the solar
surface. The large-scale 3D magnetic field structure of the BP is illustrated
in Fig. 5 - it consists of a large dome of magnetic flux,
that contains all the field-lines that are observed to brighten in
XRT. The structure is similar to the BP studied by Maclean et al. (2008a). On a large
scale, the topology is in an intersecting state
(Beveridge et al. 2004). However, in this BP, the brightening is only observed
in one of the flux domains (P-N). This is likely to be because these
field-lines are much shorter than their counterparts in the other
flux domain, so the same amount of heating leads to a stronger
brightening.
Figure 6 shows the photospheric footprint of the magnetic topology from
Fig. 5 at 21:14:02 UT.
Thanks to the high-resolution magnetogram data, and as can be seen
in Fig. 1, it is clear that both the positive and negative
polarities are made up of smaller flux concentrations. The positive region consists of 3
small flux concentrations (each modeled here as a point magnetic source), while
the negative flux region consists of at least 8 small flux concentrations.
The exact number of small flux concentrations detected depends largely
on the detection threshold selected to define and track the magnetic features.
However, while a range of suitable threshold values exists, in fact
whichever value is chosen the number and size of these small flux
concentrations within the BP turn out to vary on a much shorter
timescale than the apparent overall magnetic structure of the
BP. While the BP exists for 37 h without remarkable changes in
its large-scale topological structure, the small-scale structure is
varying on a time-scale of minutes.
This short-term variability can also be seen in the light-curves of
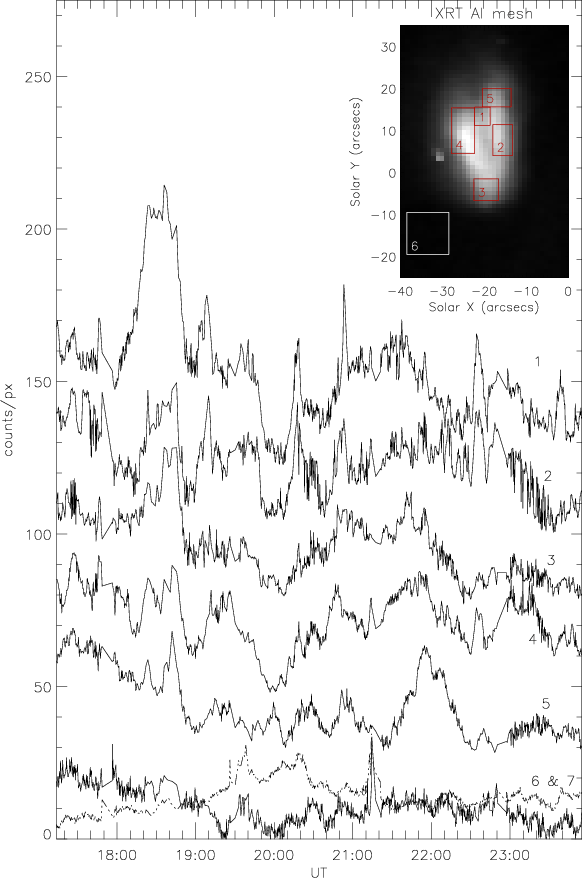
the X-ray flux. For example, Fig. 7 shows five locations
within the BP as seen in XRT. Most of these locations show periods
of short-term (i.e. several minutes) brightenings. In many
instances, these brightenings are similar in the different
locations. However, the observed variation in emission on short timescales
suggests that the reconnection process is unsteady, although the global picture
of emission in the X-rays is very well reproduced by the simple potential field model.
Light-curves of the same regions taken in Ca II H do not show any
similarity with the XRT data (Fig. 8).
![\begin{figure}
\par\includegraphics[width=7.4cm,clip]{9507f06a.eps}
\end{figure}](/articles/aa/full/2008/47/aa09507-08/Timg24.gif) |
Figure 6:
The photospheric footprint of the magnetic topology of the
BP region at 21:14:02 UT (overlaid on the MDI image), showing sources and null points as in
Fig. 5. The characteristic shape of
the BP is apparent, centred at (-20, 0). Spine field-lines are
also shown as solid curves, and the intersections of the separatrix
surfaces with the photosphere are shown as dashed curves. |
| Open with DEXTER |
 |
Figure 7:
XRT lightcurves at five locations within the BP (1-5) and
two outside the BP; the 6th is in the BP neighborhood and the 7th is in
a quiet area of the corona (60
away from the BP). Each lightcurve has
been offset in the vertical in order to show the variability;
the 6th and 7th curves have been multiplied by a factor of 25 for a clearer view. |
| Open with DEXTER |
![\begin{figure}
\par\includegraphics[width=7.2cm,clip]{9507f08a.eps}
\end{figure}](/articles/aa/full/2008/47/aa09507-08/Timg29.gif) |
Figure 8:
Normalised light curves from Ca II H (solid curve) compared with the
corresponding XRT light curves (dashed curve), for two of the boxes in the Fig. 7. |
| Open with DEXTER |
![\begin{figure}
\mbox{
\includegraphics[trim=2cm 1.8cm 4.4cm 2cm,clip,width=3.5c...
...aphics[trim=4.4cm 0cm 2.4cm 2cm,clip,width=3.35cm]{9507f09p.eps} }
\end{figure}](/articles/aa/full/2008/47/aa09507-08/Timg30.gif) |
Figure 9:
Comparison of MDI possible loop with
the image processed by edge detection from XRT, the first one is at 20:54 UT and thereafter every 20 min. |
| Open with DEXTER |
![\begin{figure}
\par\includegraphics[width=7.6cm,clip]{9507f10a.eps} \end{figure}](/articles/aa/full/2008/47/aa09507-08/Timg31.gif) |
Figure 10:
Values of the cross-correlation coefficients between the
XRT lightcurve and the positive (dashed line) and negative (solid
line) integrated magnetic fluxes from Fig. 4, for a range
of lag times. |
| Open with DEXTER |
It is however remarkable that this continual succession of small
flux concentrations should emerge and develop in such a way as to
maintain the large-scale structure of the BP over several hours to
days. Similar behaviour is also observed in the BP studied by
Maclean et al. (2008b).
Figure 9 shows a comparison between MDI with the
field-lines derived via the extrapolation outlined above and XRT images
processed by an edge detection routine (Mattis & Kimball 2007; Berry & Burnell 2005);
Most of the loops as seen in the XRT X-ray
images are in excellent agreement with the field-lines, some small loops are
however not observable in the extrapolated data, perhaps implying that they
result from a non-potential configuration. Also, there are field-lines outlined in the extrapolation
which are not seen in the X-ray images. This is not surprising as these may not be at a
temperature which is well observed in the XRT Al-mesh filter. This filter has its peak
sensitivity at 6 MK, with a second less sensitive peak below 1MK. An additional
consideration is that the plasma density may be low, hence the loop is not detectable.
However, the overall impression from the comparison of the extrapolated field-lines
and the X-ray images is that a large fraction of the bright-point at this time is well
represented by a potential model.
To our knowledge, this is the first time that the fine loop
structure of a BP has been resolved in X-ray data and compared with
the extrapolated magnetic field configuration. Assuming that no
strong electric currents exist in the quiet Sun, using a potential
field extrapolation is a reasonable first step towards
resolving the magnetic topology. However, it has recently been shown by
Santos et al. (2008) that brightenings
in the solar corona associated with BPs are related with the strongest
electric current concentrations. Therefore, further work is required using
linear force-free extrapolation.
Linear force-free models require a free parameter
 which can be specified by a fitting procedure
(e.g. from EUV-images)
as described in Wiegelmann et al. (2005).
The method has been applied so far only to active regions.
A forthcoming work will use this method as it has previously done for active
regions
(Marsch et al. 2004) and compare the obtained magnetic topology of
BPs with their EUV and X-ray fine loop structure.
which can be specified by a fitting procedure
(e.g. from EUV-images)
as described in Wiegelmann et al. (2005).
The method has been applied so far only to active regions.
A forthcoming work will use this method as it has previously done for active
regions
(Marsch et al. 2004) and compare the obtained magnetic topology of
BPs with their EUV and X-ray fine loop structure.
Nonlinear force-free models have been applied
only to ARs so far. This method requires vector
magnetograph data and, in particular, accurate measurements
of the transversal magnetic field component with a sufficient
large FOV. In quiet Sun regions the existing
measurements of the transversal magnetic field component
have a signal-to-noise ratio that is far too low for
meaningful nonlinear force-free field extrapolations.
![\begin{figure}
\par\includegraphics[width=7.8cm,clip]{9507f11a.eps}\hspace*{4mm}
\includegraphics[width=7.8cm,clip]{9507f11b.eps}\end{figure}](/articles/aa/full/2008/47/aa09507-08/Timg33.gif) |
Figure 11:
Ca II images at 21:37 UT with the magnetic field lines
overplotted. In the left panel, the field-lines originate in
the northern positive polarity, with different colours for the
different foot-points. In the right panel, the field
lines originate in the more southerly positive pole. There is a
correspondence between the foot-points and the small bright points
(see the third panel in Fig. 9 for the corresponding XRT image). |
| Open with DEXTER |
We performed a correlation analysis to find out if there is any
relationship between the XRT light curve and the variations in the
integrated positive and negative magnetic fluxes from the BP (shown
in Fig. 4). Flux emergence and cancellation are both known
to play a role in coronal heating
(Priest et al. 1994; von Rekowski et al. 2006b; Archontis et al. 2005; Low 1996),
and so we wished to investigate whether this relationship could be
observationally confirmed, with changes in the BP magnetic flux
triggering X-ray brightenings.
To create the flux timeseries (Fig. 4), we define a threshold value of 150 G
for the magnetogram data. The value for each frame was then given by
the total flux from all pixels with magnetic field strength greater
than the threshold value. For the XRT flux we integrated all the flux inside a
box of
 .
.
The linear Pearson correlation coefficient describes how well two
datasets are correlated. It can vary between -1 and 1, where
values close to 1 mean that a strong correlation exists, values
close to -1 mean strong anti-correlation, and values close to 0indicate that there is no correlation between the two datasets.
Comparing the XRT light-curve taken over the whole BP and the total
integrated positive magnetic flux gives a value of 0.746882, so
there is a strong correlation. On the other hand, comparing the
total XRT light-curve and the total integrated negative magnetic
flux gives a value of
-0.0181146; no correlation exists.
Given the correlation of the positive BP magnetic flux with the XRT light-curve (Fig. 9), we wished to determine if there
was any time lag between peaks in the two datasets, possibly
indicating how long it takes for the effects of flux
emergence/cancellation to show up as brightenings in X-rays.
Figure 10 shows the results of a cross-correlation
analysis. There is no significant correlation for the negative
magnetic flux, as expected. For the positive magnetic flux, the best
correlation is found to occur with a lag time of zero minutes, i.e.
instantaneously. This means that energy released by reconnection
stimulated by flux emergence or cancellation in the positive magnetic
polarity region, shows up within one minute (our cadence time) in
X-rays.
Recently Otsuji et al. (2007) with Hinode observations and previously
de Wijn et al. (2005) and Sánchez Almeida et al. (2004) with ground-based
observations showed that
brightenings in Ca II images are related to the concentration of magnetic
field as can also be seen by comparison of our MDI and Ca II data.
We show in Fig. 11 the extrapolated field-lines
obtained from the MDI data compared to the brightenings in the Ca II images.
Each foot-point patch in the MDI data comprises several brightenings when viewed
with the higher-resolution Ca II images. The left panel shows how
the northern P1 polarity connects to the negative flux patches, while the right panel
shows the connections of the southern P2 pole.
P1 is connected with five negative patches while P2
is connected with three sources. The difference between the loop sizes from P1
and P2 is because P2 is closer than P1 to the negative sources. This
shows an excellent correspondence between the footpoints of the extrapolated
field-lines and the Ca II BPs.
The bright point, as viewed in the X-ray images, showed a structure
of
,
with several clearly resolvable
loops. Its total lifetime was 37 h. As seen in higher
resolution, the BP's chromospheric structure comprises around 50 small bright point-like features each with a size of
.
There are some small points that belong to larger
features while others are isolated. These latter ones are more
dynamic. When these images are compared with those obtained in the
G-band, some of them are perfectly
correlated, but in some cases when a feature is bright in the
Ca II H line, it is dark in the G-band. The Ca II BPs are
a good indicator of enhanced magnetic activity. Furthermore, they are the locations
of the footpoints of the X-ray loops.
The spectroscopic data showed a Doppler shift of several km s-1 in both
coronal and transition region lines. This is also the location of the largest line
broadening. These values are in the same range as those derived by Brosius et al. (2007)
who found, with EUNIS observations, Doppler shifts ranging from -14 to +14 km s-1 in Mg IX 368.1 Å, and from -26 to +35 km s-1 in the
hotter Fe XIV and Fe XVI lines. Excellent
agreement was obtained between the two
different electron density line ratios, implying an electron density
of
cm-3.
The magnetic structure of the BP consists of one region of positive magnetic
polarity of 10 arcsec2 in size, and about 10 arcsec south of
this on the solar disk, another larger region of negative polarity
of 20 arcsec in diameter. An excellent correlation was
found between the positive magnetic flux and the X-ray flux with a
lag time of zero minutes. The remarkable agreement between the
extrapolated magnetic field configuration
and the X-ray images suggest that the overall BP magnetic structure is close
to potential, although small time-scale brightenings occur at various locations
throughout the bright point.
We postulate that the positive magnetic flux is well-correlated with
the total XRT light-curve because the positive source region is so
much weaker than the negative source region. The XRT brightenings
all occur along relatively short field-lines that are linked to the
positive source, so any flux emergence or cancellation in the
positive polarity region will have a direct effect on the coronal bright
point. Contrast this with the negative polarity region - many of
its associated field-lines do not form part of the coronal bright point, and
do not even link to the positive polarity region. Any heating caused
by flux emergence or cancellation here may be spread thinly along
field-lines that connect far from the core of the coronal bright point,
so a strong correlation with the total XRT light-curve should not be
expected. Moreover there is a very good correlation between the small
BPs that appear in the chromosphere with the foot-points of the loops
within the coronal BP, demonstrating that those brightenings are produced by a
concentration of the magnetic field.
In a recent loop study, Aulanier et al. (2007) showed that slip reconnection
should be considered. There is evidence of reconnection here (and in real life it
probably is slip reconnection), but unfortunately, given the scale of the loops
in the present data and the spatial resolution of the data, we are unable to comment on its
importance here. In our reconstruction of the field lines we are looking at real magnetic
nulls and separatrix surfaces, rather than quasi-separatrix layers where slip
reconnection occurs. Also, the limitations of the modelling
technique mean that we are unable to
use our potential field extrapolation to try to estimate a realistic
reconnection rate.
Further work is required to determine whether the results obtained here
are applicable to the majority of observed solar coronal bright points, and
how a BP's magnetic topological structure evolves throughout its lifetime.
Acknowledgements
We would like to thank the Hinode SOT, EIS & XRT teams plus the
SoHO SUMER, MDI & EIT teams for their help in obtaining and
reducing the data. SUMER, EIT and MDI are part of SOHO, the Solar
and Heliospheric Observatory, which is a project of international
cooperation between ESA and NASA. Hinode is a Japanese mission
developed and launched by ISAS/JAXA, collaborating with NAOJ as a
domestic partner, NASA and STFC (UK) as international partners.
Support for the post-launch operation is provided by JAXA and NAOJ
(Japan), STFC (UK), NASA, ESA, and NSC (Norway). CHIANTI is a
collaborative project involving the NRL (USA), RAL (UK), MSSL (UK),
the Universities of Florence (Italy) and Cambridge (UK), and George
Mason University (USA). We would like to thank to the referee, Scott
McIntosh,
for his very valuable comments and insight on an earlier draft and
Thomas Wiegelmann for reading and commenting on the paper.
- Archontis, V.,
Moreno-Insertis, F., Galsgaard, K., & Hood, A. W. 2005,
ApJ, 635, 1299 [NASA ADS] [CrossRef]
- Aulanier, G., Golub,
L., DeLuca, E. E., et al. 2007, Science, 318, 1588 [NASA ADS] [CrossRef]
(In the text)
- Berry, R., &
Burnell, J. 2005, The handbook of astronomical image processing,
2n [NASA ADS]d edn., ed. R. Berry, & J. Burnell, (Richmond, VA:
Willmann-Bell), 1 CD-ROM (incl. Astronomical Image Processing
Software AIP4WIN, v.2.0)
- Beveridge, C., Priest,
E. R., & Brown, D. S. 2002, Sol. Phys., 209,
333 [NASA ADS] [CrossRef]
- Beveridge, C., Priest,
E. R., & Brown, D. S. 2004, Geophys. Astrophys. Fluid
Dynamics, 98, 429 [NASA ADS] [CrossRef]
(In the text)
- Brosius, J. W.,
Rabin, D. M., & Thomas, R. J. 2007, ApJ, 656,
L41 [NASA ADS] [CrossRef]
(In the text)
- Brown, D. S.,
Parnell, C. E., Deluca, E. E., Golub, L., & McMullen,
R. A. 2001, Sol. Phys., 201, 305 [NASA ADS] [CrossRef]
- Culhane, J. L.,
Harra, L. K., James, A. M., et al. 2007,
Sol. Phys., 243, 19 [NASA ADS] [CrossRef]
(In the text)
- de Wijn, A. G.,
Rutten, R. J., Haverkamp, E. M. W. P., &
Sütterlin, P. 2005, A&A, 441, 1183 [NASA ADS] [CrossRef] [EDP Sciences]
(In the text)
- DeForest, C. E.,
Hagenaar, H. J., Lamb, D. A., Parnell, C. E., &
Welsch, B. T. 2007, ApJ, 666, 576 [NASA ADS] [CrossRef]
(In the text)
- Delaboudinière,
J.-P., Artzner, G. E., Brunaud, J., et al. 1995,
Sol. Phys., 162, 291 [NASA ADS] [CrossRef]
(In the text)
- Démoulin, P., &
Priest, E. R. 1992, A&A, 258, 535 [NASA ADS]
- Dere, K. P.,
Landi, E., Mason, H. E., Monsignori Fossi, B. C., &
Young, P. R. 1997, A&AS, 125, 149 [NASA ADS] [CrossRef] [EDP Sciences]
- Domingo, V., Fleck,
B., & Poland, A. I. 1995, Space Sci. Rev., 72, 81 [NASA ADS] [CrossRef]
(In the text)
- Golub, L., Krieger,
A. S., Silk, J. K., Timothy, A. F., & Vaiana,
G. S. 1974, ApJ, 189, L93 [NASA ADS] [CrossRef]
(In the text)
- Golub, L., Deluca, E.,
Austin, G., et al. 2007, Sol. Phys., 243, 63 [NASA ADS] [CrossRef]
- Habbal, S. R.,
& Withbroe, G. L. 1981, Sol. Phys., 69, 77 [NASA ADS] [CrossRef]
(In the text)
- Handy, B. N.,
Acton, L. W., Kankelborg, C. C., et al. 1999,
Sol. Phys., 187, 229 [NASA ADS] [CrossRef]
(In the text)
- Kano, R., Sakao, T.,
Hara, H., et al. 2007, Sol. Phys., 191
- Kosugi, T., Matsuzaki,
K., Sakao, T., et al. 2007, Sol. Phys., 243, 3 [NASA ADS] [CrossRef]
(In the text)
- Landi, E., Del Zanna,
G., Young, P. R., et al. 2006, ApJS, 162, 261 [NASA ADS] [CrossRef]
- Longcope, D. W. 1996,
Sol. Phys., 169, 91 [NASA ADS] [CrossRef]
(In the text)
- Longcope, D. W.
2005, Living Rev. Sol. Phys., 2, 7 [NASA ADS]
(In the text)
- Longcope, D. W.,
& Klapper, I. 2002, ApJ, 579, 468 [NASA ADS] [CrossRef]
- Longcope, D. W.,
Kankelborg, C. C., Nelson, J. L., & Pevtsov,
A. A. 2001, ApJ, 553, 429 [NASA ADS] [CrossRef]
- Low, B. C. 1996,
Sol. Phys., 167, 217 [NASA ADS] [CrossRef]
- Maclean, R. C.,
Büchner, J., & Priest, E. R. 2008a, A&A,
submitted
(In the text)
- Maclean, R. C.,
Pérez-Suárez, D., Madjarska, M. S., & Doyle,
J. G. 2008b, A&A, in preparation
(In the text)
- Madjarska,
M. S., Doyle, J. G., Teriaca, L., & Banerjee, D.
2003, A&A, 398, 775 [NASA ADS] [CrossRef] [EDP Sciences]
(In the text)
- Marsch, E.,
Wiegelmann, T., & Xia, L. D. 2004, A&A, 428, 629 [NASA ADS] [CrossRef] [EDP Sciences]
(In the text)
- Mattis, P., & Kimball,
S. 2007, Gimp, the GNU Image Manipulation Program
- McIntosh, S. W.,
& Gurman, J. B. 2005, Sol. Phys., 228, 285 [NASA ADS] [CrossRef]
(In the text)
- Otsuji, K., Shibata,
K., Kitai, R., et al. 2007, ArXiv e-prints, 709
(In the text)
- Parnell, C. E.,
Priest, E. R., & Titov, V. S. 1994, Sol. Phys.,
153, 217 [NASA ADS] [CrossRef]
- Priest, E. R.,
Parnell, C. E., & Martin, S. F. 1994, ApJ, 427,
459 [NASA ADS] [CrossRef]
- Sánchez Almeida,
J., Márquez, I., Bonet, J. A., Domínguez
Cerdeña, I., & Muller, R. 2004, ApJ, 609, L91 [NASA ADS] [CrossRef]
(In the text)
- Santos, J. C.,
Büchner, J., Madjarska, M. S., & Alves, M. V.
2008, A&A, 490, 345 [NASA ADS] [CrossRef] [EDP Sciences]
(In the text)
- Scherrer, P. H.,
Bogart, R. S., Bush, R. I., et al. 1995,
Sol. Phys., 162, 129 [NASA ADS] [CrossRef]
(In the text)
- Sheeley, N. R.,
& Golub, L. 1979, Sol. Phys., 63, 119 [NASA ADS] [CrossRef]
(In the text)
- Shimizu, T.,
Katsukawa, Y., Matsuzaki, K., et al. 2007, ArXiv e-prints,
709
(In the text)
- Tsuneta, S.,
Ichimoto, K., Katsukawa, Y., et al. 2007, ArXiv e-prints,
711
(In the text)
- Ugarte-Urra, I.,
Doyle, J. G., Madjarska, M. S., & O'Shea, E. 2004,
A&A, 418, 313 [NASA ADS] [CrossRef] [EDP Sciences]
(In the text)
- Ugarte-Urra, I.,
Doyle, J. G., & Del Zanna, G. 2005, A&A, 435,
1169 [NASA ADS] [CrossRef] [EDP Sciences]
(In the text)
- Vaiana, G. S.,
Krieger, A. S., & Timothy, A. F. 1973,
Sol. Phys., 32, 81 [NASA ADS] [CrossRef]
(In the text)
- von Rekowski, B.,
Parnell, C. E., & Priest, E. R. 2006a, in COSPAR,
Plenary Meeting, 36, 36th COSPAR Scientific Assembly, 2936
- von Rekowski, B.,
Parnell, C. E., & Priest, E. R. 2006b, MNRAS, 369,
43 [NASA ADS] [CrossRef]
- Webb, D. F.,
Martin, S. F., Moses, D., & Harvey, J. W. 1993,
Sol. Phys., 144, 15 [NASA ADS] [CrossRef]
(In the text)
- Welsch, B. T.,
Fisher, G. H., Abbett, W. P., & Regnier, S. 2004,
ApJ, 610, 1148 [NASA ADS] [CrossRef]
(In the text)
- Wiegelmann, T.,
Inhester, B., Lagg, A., & Solanki, S. K. 2005,
Sol. Phys., 228, 67 [NASA ADS] [CrossRef]
(In the text)
- Young, P. R., Del
Zanna, G., Mason, H. E., et al. 2007a, PASJ, 59, 857 [NASA ADS]
(In the text)
- Young, P. R., Del
Zanna, G., Mason, H. E., et al. 2007b, ArXiv e-prints,
706
(In the text)
- Young, P. R.,
Watanabe, T., Hara, H., & Mariska, J. T. 2008, ArXiv
e-prints, 805
(In the text)
Copyright ESO 2008
![\begin{figure}
\par\includegraphics[width=4.8cm,clip]{9507f01a.eps}\hspace*{4mm}...
....eps}\hspace*{4mm}
\includegraphics[width=4.8cm,clip]{9507f01c.eps}
\end{figure}](/articles/aa/full/2008/47/aa09507-08/img11.gif)
![\begin{figure}
\par\includegraphics[width=4.8cm,clip]{9507f02a.eps}\hspace*{4mm}...
...eps}\hspace*{4mm}
\includegraphics[width=4.8cm,clip]{9507f02c.eps}
\end{figure}](/articles/aa/full/2008/47/aa09507-08/img12.gif)
![\begin{figure}
\par\includegraphics[width=3.18cm,clip]{9507f03a.eps}\hspace*{4mm...
...}\hspace*{4mm}
\includegraphics[width=4.5cm,clip]{9507f03d.eps}
\par\end{figure}](/articles/aa/full/2008/47/aa09507-08/img16.gif)
![\begin{figure}
\par\includegraphics[width=7.8cm,clip]{9507f04a.eps}
\end{figure}](/articles/aa/full/2008/47/aa09507-08/img20.gif)
![\begin{figure}
\par\includegraphics[width=7.4cm,clip]{9507f06a.eps}
\end{figure}](/articles/aa/full/2008/47/aa09507-08/img24.gif)
![\begin{figure}
\par\includegraphics[width=7.2cm,clip]{9507f08a.eps}
\end{figure}](/articles/aa/full/2008/47/aa09507-08/img29.gif)
![\begin{figure}
\mbox{
\includegraphics[trim=2cm 1.8cm 4.4cm 2cm,clip,width=3.5c...
...aphics[trim=4.4cm 0cm 2.4cm 2cm,clip,width=3.35cm]{9507f09p.eps} }
\end{figure}](/articles/aa/full/2008/47/aa09507-08/img30.gif)
![\begin{figure}
\par\includegraphics[width=7.6cm,clip]{9507f10a.eps} \end{figure}](/articles/aa/full/2008/47/aa09507-08/img31.gif)
![\begin{figure}
\par\includegraphics[width=7.8cm,clip]{9507f11a.eps}\hspace*{4mm}
\includegraphics[width=7.8cm,clip]{9507f11b.eps}\end{figure}](/articles/aa/full/2008/47/aa09507-08/img33.gif)