A&A 491, 507-513 (2008)
DOI: 10.1051/0004-6361:200810272
Progenitor mass of the type IIP supernova 2005cs
V. P. Utrobin1,2 - N. N. Chugai3
1 - Max-Planck-Institut für Astrophysik,
Karl-Schwarzschild-Str. 1, 85741 Garching, Germany
2 -
Institute of Theoretical and Experimental Physics,
B. Cheremushkinskaya St. 25, 117218 Moscow, Russia
3 -
Institute of Astronomy of Russian Academy of Sciences,
Pyatnitskaya St. 48, 109017 Moscow, Russia
Received 27 May 2008 / Accepted 29 August 2008
Abstract
Context. The progenitor mass of type IIP supernova can be determined from either hydrodynamic modeling of the event or pre-explosion observations.
Aims. To compare these approaches, we determine parameters of the sub-luminous supernova 2005cs and estimate its progenitor mass.
Methods. We compute the hydrodynamic models of the supernova to describe its light curves and expansion velocity data.
Results. We estimate a presupernova mass of
 ,
an explosion energy of
,
an explosion energy of
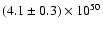 erg, a presupernova radius of
 ,
and a radioactive 56Ni mass of
,
and a radioactive 56Ni mass of
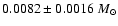 .
The derived progenitor mass of SN 2005cs is
.
The derived progenitor mass of SN 2005cs is
 ,
which is in-between those of low-luminosity and normal type IIP supernovae.
,
which is in-between those of low-luminosity and normal type IIP supernovae.
Conclusions. The obtained progenitor mass of SN 2005cs is higher than derived from pre-explosion images. The masses of four type IIP supernovae estimated by means of hydrodynamic modeling are systematically higher than the average progenitor mass for the
 mass range. This result, if confirmed for a larger sample, would imply that a serious revision of the present-day view on the progenitors of type IIP supernovae is required.
Key words: stars: supernovae: general - stars: supernovae: - individual: SN 2005cs
1 Introduction
Type IIP supernovae (SNe IIP) originate presumably in main-sequence stars
of the mass range of
(Heger et al. 2003).
If this is the case, the predicted rate of SNe IIP should follow the Salpeter
initial mass function with half of events occurring for stars of mass below
 .
This conjecture requires confirmation by means of the determination of progenitor
mass for an extended sample of SNe IIP.
.
This conjecture requires confirmation by means of the determination of progenitor
mass for an extended sample of SNe IIP.
There are two ways to recover the progenitor mass of SN IIP on the main sequence.
The first method is detection of the presupernova (pre-SN) in archival images
of the host galaxy.
The estimated flux and color index of the detected pre-SN is then converted
into a stellar mass using the flux and color index predicted by stellar
evolution models.
Data for the available directly identified progenitors in the compilation of Li
et al.
(2007) indicate that for eight SNe IIP the progenitor masses have been
estimated in this way, and for six SNe IIP, upper limits to the progenitor
mass have been found.
An alternative approach to the mass determination involves hydrodynamic
modeling of light curves and expansion velocities for the well-observed
SNe IIP.
Combining the ejecta mass derived from the hydrodynamic modeling with the mass
of the neutron star and the mass lost by the stellar wind provides us with
the mass estimate of the progenitor.
Henceforth, the progenitor mass determined by this method is referred to as the
``hydrodynamic mass''.
At present, the hydrodynamic mass is measured only for three SNe IIP:
the peculiar type IIP SN 1987A (Woosley 1988; Blinnikov et al.
2000; Utrobin 2005), the normal type IIP SN 1999em
(Baklanov et al. 2005; Utrobin 2007), and the
low-luminosity type IIP SN 2003Z (Utrobin et al. 2007).
The small amount of SN IIP events with the measured hydrodynamic mass is
related to the fact that the hydrodynamic modeling requires a complete
multi-band photometry at both the plateau and the radioactive tail, and spectra
of sufficient quality.
There are only a few other SNe IIP that also meet these requirements.
Among these is the sub-luminous type IIP SN 2005cs (Pastorello et al.
2006).
On the basis of its luminosity and expansion velocities, this SN is intermediate between
the low-luminosity and normal SNe IIP.
Parameters of SN 2005cs are of considerable interest for two major reasons:
(1) this SN is expected to have intermediate parameters, which would be
interesting to check;
(2) the pre-SN was detected in the pre-explosion images and its progenitor
mass was estimated by several groups (Maund et al. 2005;
Li et al. 2006; Eldridge et al. 2007) providing
an opportunity to compare different mass estimates.
In the paper, we perform hydrodynamic modeling of SN 2005cs to recover the
parameters: ejecta mass, explosion energy,
pre-SN radius, and radioactive 56Ni mass.
We start with the description of the model and observational data used
and then present the results of the hydrodynamic modeling for SN 2005cs
(Sect. 2).
In Sect. 3, we present additional arguments in favor of our choice
of pre-SN models.
Possible uncertainties in the hydrodynamic mass of SN 2005cs are analyzed
(Sect. 4), and finally the implications of hydrodynamically
studied objects for the origin of SNe IIP are discussed
(Sect. 5).
We adopt an explosion date on June 27.5 UT (JD 2 453 549) and a distance of
8.4 Mpc
following Pastorello et al. (2006), and a reddening
E(B-V)=0.12 taken from Li et al. (2006).
2 Optimal hydrodynamic model
The hydrodynamic model applied to SN 2005cs is essentially the same as used
before for SN 1999em (Utrobin 2007).
The pre-SN structure is set to be a non-evolutionary model of a red supergiant
(RSG) star (but see Sect. 3).
The chemical composition of the hydrogen envelope is solar.
Although this might be a simplification, there is no observational
evidence that the hydrogen abundance in the atmosphere of the RSG, e.g.
 Ori, differs notably from solar (Harper et al. 2001).
The effect of the variation in the surface abundances on the SN IIP light curve
was studied before, and it was found that even a significant
change in the hydrogen abundance of outer layers only weakly affects
the light curve (Utrobin 2007).
The light curve of the SN 2005cs model of hydrogen abundance
X=0.65 and helium abundance Y=0.33, predicted for an
Ori, differs notably from solar (Harper et al. 2001).
The effect of the variation in the surface abundances on the SN IIP light curve
was studied before, and it was found that even a significant
change in the hydrogen abundance of outer layers only weakly affects
the light curve (Utrobin 2007).
The light curve of the SN 2005cs model of hydrogen abundance
X=0.65 and helium abundance Y=0.33, predicted for an
 star with
initial solar composition (Heger 1998), is almost
indistinguishable from the case of solar composition.
The inner layers of the ejecta are mixed with the helium core in the same way
as in the model for SN 1999em.
star with
initial solar composition (Heger 1998), is almost
indistinguishable from the case of solar composition.
The inner layers of the ejecta are mixed with the helium core in the same way
as in the model for SN 1999em.
We refer to the hydrodynamic model as being the optimal one, in terms of an
``eye-fit'' to the observational light curve and the evolution of photospheric
velocity.
In general, a numerical optimization procedure could be developed to complete
the search for the best-fit model.
However, at present it would require an enormous amount of computational time
that would be unjustified because the error of eye-fit is far less
than the error introduced by uncertainties in the distance and
interstellar extinction.
The search for the optimal model of SN 2005cs uses the hydrodynamic
model behavior in parameter space studied earlier in detail
(Utrobin 2007).
The 56Ni mass is determined empirically from the comparison of the
R-band luminosity of SN 2005cs at the radioactive tail with that of
SN 1987A.
For the adopted distance and reddening, the R-values at the age of
250-300 days (Tsvetkov et al. 2006) correspond to the 56Ni mass of
 .
.
The observed bolometric light curve of SN 2005cs is recovered from
 photometry (Pastorello et al. 2006; Tsvetkov et al. 2006)
using a black-body approximation for the SN radiation, while expansion
velocities at the photosphere were taken from Pastorello et al. (2006).
photometry (Pastorello et al. 2006; Tsvetkov et al. 2006)
using a black-body approximation for the SN radiation, while expansion
velocities at the photosphere were taken from Pastorello et al. (2006).
The dependence of the light curve at the initial adiabatic cooling stage and
the plateau phase on SN parameters provides us with a toolkit to
search for the optimal model in parameter space.
The obtained model of SN 2005cs is characterized by the ejecta mass
 ,
the explosion energy
,
the explosion energy
 erg,
and the pre-SN radius
erg,
and the pre-SN radius
 with the 56Ni mass
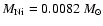 .
The ejecta mass combined with the neutron star mass results in the pre-SN mass
of
.
The ejecta mass combined with the neutron star mass results in the pre-SN mass
of
 .
.
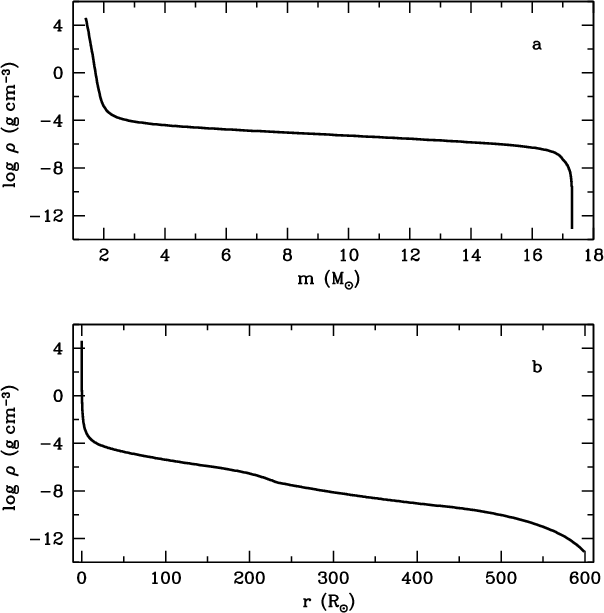
The optimal pre-SN density structure is shown in Fig. 1 and
the chemical composition in Fig. 2.
The helium core is mixed with the hydrogen envelope so that the hydrogen
abundance increases linearly with mass in the inner
 .
We adopt the helium-core mass of
.
We adopt the helium-core mass of
 ,
which corresponds to the
,
which corresponds to the
 progenitor (Hirschi et al. 2004).
We note that the basic SN parameters are insensitive to the helium-core mass
(Utrobin et al. 2007).
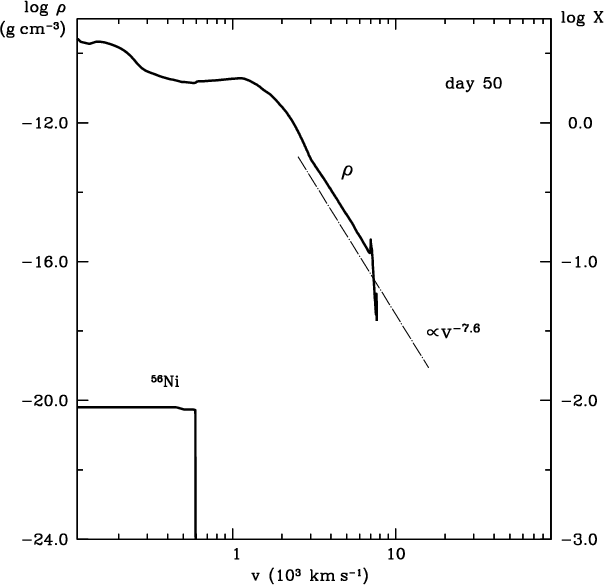
In the freely expanding envelope, the hydrogen is mixed downward to
300 km s-1, while the radioactive 56Ni is mixed outward to
610 km s-1 (Fig. 3).
progenitor (Hirschi et al. 2004).
We note that the basic SN parameters are insensitive to the helium-core mass
(Utrobin et al. 2007).
In the freely expanding envelope, the hydrogen is mixed downward to
300 km s-1, while the radioactive 56Ni is mixed outward to
610 km s-1 (Fig. 3).
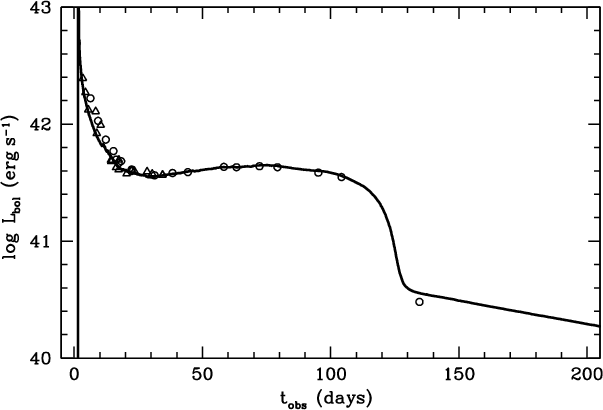
The observed bolometric light curve is reproduced by our optimal model
(Fig. 4).
A small disparity between model and observations at the radioactive tail is
probably caused by the black-body approximation applied to the reconstruction
of the observed bolometric light curve.
This approximation is certainly rough at the nebular epoch.
We note that the 56Ni mass was derived from the comparison of the R-band
luminosities of SN 2005cs and SN 1987A at similar nebular epochs.
 |
Figure 1:
Density distribution as a function of interior mass a) and
radius b) for the optimal pre-SN model.
The central core of 1.4  is omitted.
 |
| Open with DEXTER |
![\begin{figure}
\par\resizebox{8.5cm}{!}{\includegraphics[clip]{0272fig2.eps}}
\end{figure}](/articles/aa/full/2008/44/aa10272-08/Timg24.gif) |
Figure 2:
The mass fraction of hydrogen ( solid line), helium
( long dashed line), heavy elements ( short dashed line),
and radioactive 56Ni ( dotted line) in the ejecta of
the optimal model. |
| Open with DEXTER |
 |
Figure 3:
The density and the 56Ni mass fraction as a function of the velocity
for the optimal model at t=50 days.
Dash-dotted line is the density distribution fit
 . . |
| Open with DEXTER |
 |
Figure 4:
Comparison of the calculated bolometric light curve of the optimal model
( solid line) with the bolometric data of SN 2005cs
evaluated from the photometric observations of Pastorello et al.
(2006) ( open triangles) and Tsvetkov et al.
(2006) ( open circles). |
| Open with DEXTER |
Although the one-group approximation for radiation transfer prevents us from
achieving a detailed description of the spectral energy distribution, our model does
reproduce the general magnitude of the broad-band photometry, although the match
is not precise.
Both the observed and calculated B light curves (Fig. 5a)
show an initial peak related to the cooling of hot outer layers of shocked
ejecta.
The amplitude and width of this peak is sensitive to the structure of
the outermost rarefied layers of the pre-SN envelope, and the density
structure shown in Fig. 1 is optimal in this sense.
The later (t>50 days) behavior of the flux in B band is poorly reproduced
because the black-body approximation of the model spectrum in the
 Å range is too crude at the plateau stage.
Fortunately, this discrepancy does not affect the model fit to the bolometric
light curve because of a small contribution of the B band to the
bolometric luminosity at this stage.
The calculated V and R light curves for this model describe satisfactorily
observations (Figs. 5b and c).
The computed evolution of the photospheric velocity is also consistent with
observations (Fig. 5d), supporting the detailed
hydrodynamic properties of the model ejecta, in particular, the density
distribution in the SN envelope (Fig. 3).
Å range is too crude at the plateau stage.
Fortunately, this discrepancy does not affect the model fit to the bolometric
light curve because of a small contribution of the B band to the
bolometric luminosity at this stage.
The calculated V and R light curves for this model describe satisfactorily
observations (Figs. 5b and c).
The computed evolution of the photospheric velocity is also consistent with
observations (Fig. 5d), supporting the detailed
hydrodynamic properties of the model ejecta, in particular, the density
distribution in the SN envelope (Fig. 3).
To estimate a measure of uncertainty in the derived physical
parameters, we investigate the sensitivity of the optimal model to
observational values.
We adopt the following relative changes in the observational values: 20% in
the bolometric luminosity, 5% in the photospheric velocity, and 5% in
the plateau duration.
Using the auxiliary hydrodynamic models in the vicinity of the optimal model,
we transform the adopted changes into changes in the pre-SN radius
of 
 ,
the ejecta mass of
,
the ejecta mass of
 ,
the explosion
energy of
,
the explosion
energy of
 erg, and the 56Ni mass of
 .
Given the errors in the observational values, these relations can be used to
derive the errors in the physical parameters.
The adopted relative changes in the observed values are close to their typical
errors.
We therefore consider the derived changes in the physical parameters of SN 2005cs
to represent the typical uncertainties in these values.
.
Given the errors in the observational values, these relations can be used to
derive the errors in the physical parameters.
The adopted relative changes in the observed values are close to their typical
errors.
We therefore consider the derived changes in the physical parameters of SN 2005cs
to represent the typical uncertainties in these values.
3 Why non-evolutionary presupernova model?
![\begin{figure}
\par\includegraphics[width=8.6cm,clip]{0272fig5.eps}
\end{figure}](/articles/aa/full/2008/44/aa10272-08/Timg33.gif) |
Figure 5:
Optimal hydrodynamic model.
Panel a): the calculated B light curve ( solid line)
compared with the observations of SN 2005cs obtained by Pastorello et al.
(2006) ( open triangles) and Tsvetkov et al.
(2006) ( open circles).
Panels b) and c): the same as panel a) but for
the V and R light curves.
Panel d): calculated photospheric velocity ( solid
line) is compared with photospheric velocities estimated from
absorption minima of the He I 5876 Å line ( crosses)
and the Fe II 5169 Å line ( open circles) measured by
Pastorello et al. (2006). |
| Open with DEXTER |
Although our non-evolutionary pre-SN model closely resembles the massive
RSG star by the heterogeneous core-envelope structure, the extended radius, and
the helium-core mass, it omits a sharp jump in density and chemical
composition between the helium core and hydrogen envelope, which is
characteristic of the evolutionary model.
A question may then arise: why not use evolutionary pre-SN.
The answer is that the assumption of a smooth transition from the helium core
to the hydrogen envelope in the non-evolutionary pre-SN is dictated by
two major facts.
First, the explosion of the evolutionary model generally fails to reproduce the
light curve of SN IIP in detail, as became clear after SN 1987A
(cf. Woosley 1988).
Second, the H profile in the SN 1987A spectra provides clear evidence
of hydrogen mixing deep down inside the helium core.
We note that in 2D simulations the shock propagation produces
Rayleigh-Taylor (RT) mixing between the oxygen and helium-core material, and
between the helium-core matter and the hydrogen envelope
(Herant & Benz 1991; Müller et al. 1991;
Kifonidis et al. 2003, 2006).
In general, a self-consistent hydrodynamic model of the explosion of the
evolutionary RSG star should be three-dimensional in considering
both the hydrodynamic flow and radiation transfer.
Unfortunately, this approach cannot presently be realized.
We therefore accounted for 3D effects in our 1D simulations by adopting
a non-evolutionary pre-SN with density and chemical composition jumps that had been
smoothed presumably by the RT mixing between the helium core and the hydrogen
envelope.
This approach was justified because the RT mixing occurs before the
shock breakout and does not affect the light curve directly.
 |
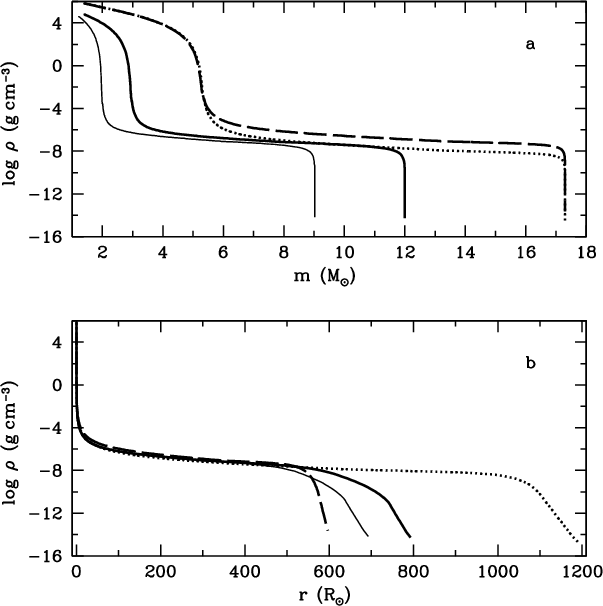
Figure 6:
Density distribution as a function of interior mass a) and
radius b) for the evolutionary pre-SNe (Table 1):
model EM1 ( dotted line), model EM2 ( dashed line),
model EM3 ( thick solid line), and
model EM4 ( thin solid line). |
| Open with DEXTER |
Here we propose that a pre-SN has an evolutionary density structure and
chemical composition.
We constructed the hydrostatic configuration, which reproduced the main features
of evolutionary pre-SN models neglected before, namely the dense
helium core with a sharp density gradient and the chemical composition
jump at its boundary.
We refer to this pre-SN model as the ``evolutionary model''.
Four representative models with a dense helium core and extended hydrogen
envelope (Fig. 6) were considered.
Their parameters are listed
in Table 1, i.e. the pre-SN radius, ejecta mass,
explosion energy, total 56Ni mass, helium-core mass,
pre-SN mass, and surface hydrogen and helium abundances.
The helium-core masses are typical of massive RSG stars
(Hirschi et al. 2004; Garcia-Berro et al. 1997).
The first two hydrodynamic models EM1 and EM2 are similar to the optimal model
in the basic parameters but model EM1 differs in the initial radius.
The remaining two models EM3 and EM4 are less massive than the optimal model and
their masses are close to the progenitor mass of SN 2005cs estimated from
the pre-explosion images of the galaxy M 51 (see Sect. 4).
We consider also the mixed models EM3 and EM4 in which the helium core
is mixed by the hydrogen envelope - in the same way as the optimal model
is mixed (Fig. 2) - in the inner
 and
and
 ,
respectively.
,
respectively.
First of all, we see that the explosion of the evolutionary model produces
the dome-shaped light curve without a steep transition to the radioactive
tail (Figs. 7a-c).
We note that the steep decline in luminosity at the end of the plateau is
a characteristic of all SNe IIP.
The dome shape of the light curve for the evolutionary model is
related to the almost flat density distribution in the hydrogen envelope
(Fig. 6).
A step-like bump in the light curve at the transition to the radioactive tail
is caused by the dense helium core (Fig. 6).
We note that mixing in models EM3 and EM4 does not remove but modifies the
step-like feature (Figs. 7b and c).
The fact that this bump is never observed in SNe IIP indicates that the density
jump between the dense helium core and flat hydrogen envelope is smoothed
and, consequently, the inner SN ejecta is strongly mixed.
The hydrodynamic model EM1 with an initial radius of
 ,
close to that of the evolutionary pre-SN (Heger 1998), predicts an
unacceptably high luminosity, long plateau (Fig. 7a), and low
photospheric velocity during the early epoch t<10 days
(Fig. 7d).
Model EM2 with the smaller initial radius, as expected, is characterized by
lower luminosity, but remains too luminous (Fig. 7a)
and has low photospheric velocity at the early epoch t<7 days
(Fig. 7d).
The reduction in radius would produce a reasonable luminosity at the early plateau
stage, but this model would have too low luminosity at the late plateau
stage.
We therefore conclude that the replacement of the non-evolutionary pre-SN in the
optimal model by the evolutionary pre-SN cannot produce a reasonable fit to
the observational data.
,
close to that of the evolutionary pre-SN (Heger 1998), predicts an
unacceptably high luminosity, long plateau (Fig. 7a), and low
photospheric velocity during the early epoch t<10 days
(Fig. 7d).
Model EM2 with the smaller initial radius, as expected, is characterized by
lower luminosity, but remains too luminous (Fig. 7a)
and has low photospheric velocity at the early epoch t<7 days
(Fig. 7d).
The reduction in radius would produce a reasonable luminosity at the early plateau
stage, but this model would have too low luminosity at the late plateau
stage.
We therefore conclude that the replacement of the non-evolutionary pre-SN in the
optimal model by the evolutionary pre-SN cannot produce a reasonable fit to
the observational data.
Table 1:
Hydrodynamic models for evolutionary presupernovae.
![\begin{figure}
\par\includegraphics[width=8.4cm,clip]{0272fig7.eps}
\end{figure}](/articles/aa/full/2008/44/aa10272-08/Timg45.gif) |
Figure 7:
Bolometric light curve a), b), and c) and
photospheric velocity d) of the hydrodynamic models
in Table 1 compared with the empirical data of SN 2005cs
(see legends of Figs. 4 and 5 for details).
Dotted line is model EM1, dashed line is model EM2,
thick solid line is model EM3, and thin solid line is
model EM4.
Mixed models EM3 and EM4 are shown by the corresponding dotted-dashed
lines in panels b) and c). |
| Open with DEXTER |
Models EM3 and EM4 of lower mass and explosion energy could reproduce
the observed plateau luminosity for an appropriate choice of initial
radius (Figs. 7b and c).
However, a full description of the light curve cannot be attained for either
the
 or
pre-SNe.
The photospheric velocity at the early stage in these models becomes
unacceptably low (Fig. 7d), which is another reason why
evolutionary models have to be modified significantly to attain a reasonable fit
to observational data.
Remarkably, all evolutionary models fail to reproduce the width of the
initial peak.
We therefore conclude that there is no set of the basic parameters for the
or
pre-SNe.
The photospheric velocity at the early stage in these models becomes
unacceptably low (Fig. 7d), which is another reason why
evolutionary models have to be modified significantly to attain a reasonable fit
to observational data.
Remarkably, all evolutionary models fail to reproduce the width of the
initial peak.
We therefore conclude that there is no set of the basic parameters for the
 progenitors that can reproduce the observations of SN 2005cs in
the frame of the 1D explosion of the evolutionary pre-SNe.
progenitors that can reproduce the observations of SN 2005cs in
the frame of the 1D explosion of the evolutionary pre-SNe.
4 Progenitor mass
To derive the main-sequence mass of the SN 2005cs progenitor, the pre-SN mass
needs to be combined with the mass lost during the hydrogen and helium burning
stages.
The mass lost at the hydrogen burning stage is taken to be
 ,
the average value between the masses lost in the
,
the average value between the masses lost in the
 and
and
 evolutionary models of non-rotating stars developed by
Meynet et al. (2003), who assumed the theoretical mass-loss rate
provided by Vink et al. (2001).
evolutionary models of non-rotating stars developed by
Meynet et al. (2003), who assumed the theoretical mass-loss rate
provided by Vink et al. (2001).
The mass lost at the helium burning stage can be estimated from the stage duration,
which is a function of the initial mass M and mass-loss
rate  adopted for the RSG stage.
We adopt the duration of the helium burning stage from Meynet et al. (2003).
The dependence of the mass-loss rate
on M was taken from Chevalier
et al. (2006), who used
values from de Jager et al.
(1988).
We also used the calibration
adopted for the RSG stage.
We adopt the duration of the helium burning stage from Meynet et al. (2003).
The dependence of the mass-loss rate
on M was taken from Chevalier
et al. (2006), who used
values from de Jager et al.
(1988).
We also used the calibration
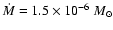 yr-1 for
the RSG with a main-sequence star
yr-1 for
the RSG with a main-sequence star
 ,
on the basis of the
SN 1999em study (Chugai et al. 2007).
The derived mass lost at the RSG stage was
,
on the basis of the
SN 1999em study (Chugai et al. 2007).
The derived mass lost at the RSG stage was
 .
The total mass lost by the stellar wind was
.
The total mass lost by the stellar wind was
 ,
and the main-sequence mass of the progenitor was
,
and the main-sequence mass of the progenitor was
 .
.
The mass of the SN 2005cs progenitor was estimated
from archival images of the galaxy M 51 taken by the Advanced Camera for
Surveys of the Hubble Space Telescope (HST) and from
near-infrared images acquired by the Near Infrared Camera and Multi-Object
Spectrometer on board HST in  bands.
We note that the progenitor was detected only in the I-band image; in other
bands, only upper limits to fluxes were obtained.
From these data, Maund et al. (2005) derived a progenitor mass of
bands.
We note that the progenitor was detected only in the I-band image; in other
bands, only upper limits to fluxes were obtained.
From these data, Maund et al. (2005) derived a progenitor mass of
 ,
Li et al. (2006) reported a progenitor
mass of
,
Li et al. (2006) reported a progenitor
mass of
 ,
while Eldridge et al. (2007) derived
a progenitor mass of between
,
while Eldridge et al. (2007) derived
a progenitor mass of between
 and
and
 .
These estimates therefore propose a
.
These estimates therefore propose a
 range for the progenitor mass of
SN 2005cs.
range for the progenitor mass of
SN 2005cs.
The above mass estimates are significantly lower than our hydrodynamic mass.
The disagreement is serious and requires an explanation.
Our hydrodynamic model for SN IIP (Utrobin 2004) can be checked by
comparison with the independent model of Blinnikov et al.
(1998).
In the case of the normal type IIP SN 1999em, both codes produce
similar ejecta mass by assuming the same distance (Baklanov et al.
2005; Utrobin 2007).
We explored crucial model assumptions that might minimize the ejecta mass.
One critical point is the degree of mixing between the hydrogen
envelope and helium core.
We found that the minimal mass was produced, if complete mixing occurred.
In this case, the ejecta mass of the hydrodynamic model could be reduced by about
 .
Another uncertainty was related to the incompleteness of the line list
used in the line-opacity calculations.
By studying this issue using the latest line list of Kurucz with
.
Another uncertainty was related to the incompleteness of the line list
used in the line-opacity calculations.
By studying this issue using the latest line list of Kurucz with
 observed and predicted lines, it was found to provide
only negligible effect, which may cause the mass decrease by the value of
the order of
observed and predicted lines, it was found to provide
only negligible effect, which may cause the mass decrease by the value of
the order of
 .
Both uncertainties implied a lower limit for the hydrodynamic progenitor
mass as low as
.
Both uncertainties implied a lower limit for the hydrodynamic progenitor
mass as low as
 ,
which is higher than the upper limit
of
recovered from the pre-explosion images of SN 2005cs.
,
which is higher than the upper limit
of
recovered from the pre-explosion images of SN 2005cs.
5 Discussion and conclusions
Table 2:
Hydrodynamic models for SN 1987A, SN 1999em, SN 2003Z, and SN 2005cs.
The primary goal of this study was to determine parameters of the sub-luminous
type IIP SN 2005cs by means of hydrodynamic modeling.
We have estimated a pre-SN mass of
,
explosion energy of
erg, pre-SN radius of
,
and 56Ni mass of
.
Using conservative assumptions about the mass-loss rate at the hydrogen and
helium burning stages, we estimate the main-sequence progenitor mass of
 .
.
Hydrodynamic models for four SNe IIP listed in Table 2 are
characterized by the pre-SN radius, the ejecta mass, the explosion energy,
the total 56Ni mass, the surface abundance of heavy elements,
the maximum velocity of nickel, and the minimum velocity of the hydrogen-rich
envelope.
The major parameters of SN 2005cs - the ejecta mass, the explosion energy,
and the 56Ni mass - are intermediate
between those of the low-luminosity type IIP SN 2003Z
(Utrobin et al. 2007) and the normal type IIP SN 1999em
(Utrobin 2007) in qualitative agreement with their luminosities.
At present, there are therefore four SNe IIP that have parameters determined
by hydrodynamic modeling.
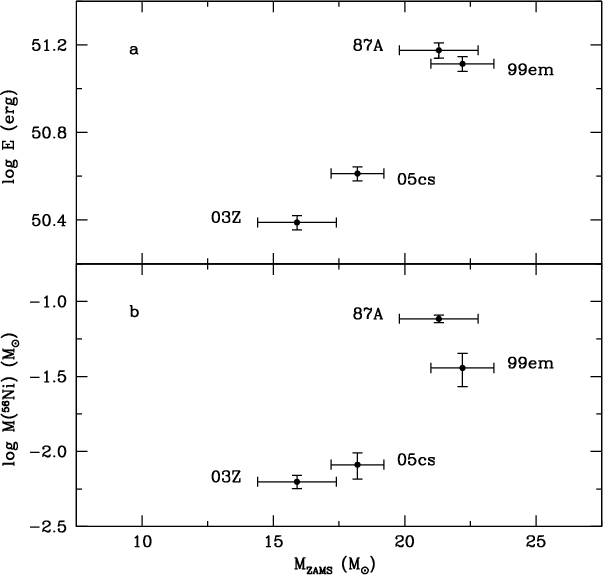
For these objects, the explosion energy and 56Ni mass correlate with
the progenitor mass (Fig. 8).
This is consistent with the empirical relation between the explosion energy and
56Ni mass found by Nadyozhin (2003) for normal SNe IIP.
Despite the uncertainties in hydrodynamic modeling, the disparity between the
hydrodynamic mass of the SN 2005cs progenitor and the mass estimated from
the pre-explosion images is significant.
This difference could be decreased by including the effects of the pre-SN light
absorption in a hypothetical dusty circumstellar shell.
However, this issue requires careful consideration, which is beyond the scope of
our paper.
We note only that this conjecture has a number of observational implications
need to be to verified.
The presence of the dense dusty shell around pre-SN should produce
strong Na I absorption lines in the SN IIP spectrum at the photospheric
epoch.
In the case of a normal SN IIP and normal pre-SN wind without a dense
circumstellar shell, the predicted Na I absorptions are weak and
probably not observable (Chugai & Utrobin 2008).
In addition, the interaction of the SN ejecta with the dense circumstellar shell
should produce an outburst of radio and X-ray emission at an age of
about  102 days.
The most apparent effect of the light absorption in the dusty circumstellar
shell should be a large J-K color index of the pre-SN.
For instance, we have found that the pre-SN light absorption, required
to allow massive progenitor implied by both the pre-explosion I value
and upper limits in other bands for SN 2005cs, suggests a large color
index
102 days.
The most apparent effect of the light absorption in the dusty circumstellar
shell should be a large J-K color index of the pre-SN.
For instance, we have found that the pre-SN light absorption, required
to allow massive progenitor implied by both the pre-explosion I value
and upper limits in other bands for SN 2005cs, suggests a large color
index
 mag, compared with the intrinsic J-K index of
0.7-1 mag
for typical galactic K-M supergiants (Elias et al. 1985).
In this regard, it is noteworthy that the type IIP SN 2008bk in the nearby
galaxy NGC 7793 with available
mag, compared with the intrinsic J-K index of
0.7-1 mag
for typical galactic K-M supergiants (Elias et al. 1985).
In this regard, it is noteworthy that the type IIP SN 2008bk in the nearby
galaxy NGC 7793 with available  photometry of the progenitor was found to have
a moderate color index
photometry of the progenitor was found to have
a moderate color index
 mag (Maoz & Mannucci 2008)
which indicates little (if any) absorption.
The observational and hydrodynamic studies of this supernova would be of significant
importance in clarifying the serious and challenging problem of
the progenitor mass of SN 2005cs and in general SNe IIP.
mag (Maoz & Mannucci 2008)
which indicates little (if any) absorption.
The observational and hydrodynamic studies of this supernova would be of significant
importance in clarifying the serious and challenging problem of
the progenitor mass of SN 2005cs and in general SNe IIP.
 |
Figure 8:
Explosion energy a) and 56Ni mass b) versus
hydrodynamic progenitor mass for four core-collapse SNe. |
| Open with DEXTER |
The number of SNe IIP with measured hydrodynamic masses is too small to
be able to analyze in detail and draw reliable conclusions about their
mass distribution.
However, the hydrodynamic progenitor masses do appear
to be systematically higher than if SNe IIP had originated
from the range of
,
assuming a Salpeter initial mass
function.
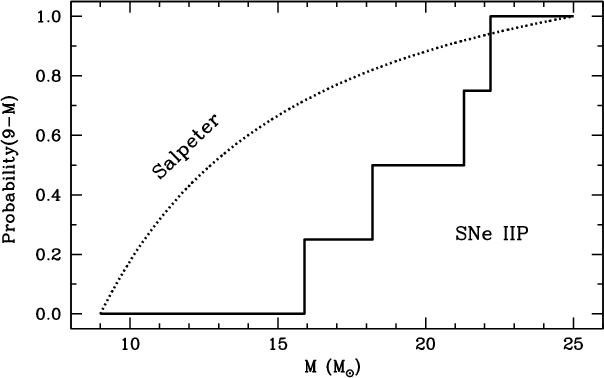
This is clearly demonstrated by the comparison of the SNe IIP mass distribution,
calculated by assuming a Salpeter initial mass function in the
mass range, with the mass distribution of four SNe IIP of
known hydrodynamic mass (Fig. 9).
Despite the small number of events, the significance of the difference between
the two distributions is high: the probability that the four SNe occurred
at random in the mass range of
 is only 0.01.
This indicates that either the 1D model of the SN explosion
overestimates the ejecta mass, or the outcome of the core collapse of
is only 0.01.
This indicates that either the 1D model of the SN explosion
overestimates the ejecta mass, or the outcome of the core collapse of
 stars differs markedly from that of SNe IIP observed until now.
To study the first possibility, we would require 3D radiation hydrodynamics modeling,
which is not possible at present.
While we cannot readily ascertain any 3D effect that might reduce the required ejecta
mass, apparent 3D effects do exist that could increase the hydrodynamic
mass.
Indeed, the RT mixing between the helium core and the hydrogen envelope is
expected to produce heterogeneous ejecta consisting of helium clumps
embedded in the hydrogen background.
This structure should reduce unavoidably the average opacity of the hydrogen-rich
matter.
As a result, the ejecta mass required to reproduce the observations should
increase.
This could counterbalance other possible effects that might reduce the ejecta
mass.
We believe therefore that the 3D hydrodynamic simulations are unlikely to reduce
significantly the SN IIP progenitor masses recovered from the 1D modeling.
The situation could be eventually clarified by 3D modeling of the
SN IIP explosion.
 |
Figure 9:
Cumulative ``Salpeter'' distribution of SN IIP progenitors in
the
mass range and the distribution of
hydrodynamic progenitor masses of four SNe IIP. |
| Open with DEXTER |
Alternatively, the disparity between the two distributions in
Fig. 9 is real.
In this case two explanations could be invoked:
(1)
stars produce faint, still undetectable SNe IIP,
i.e. we have a selection effect;
(2) core collapse of stars from this mass range does not produce an SN event
at all.
In the latter case, the fate of the star may be silent collapse with a
neutron star residing inside the stellar envelope, i.e. a Thorne-Zytkow
object (Thorne & Zytkow 1975).
If this is the case, the neutron star may eventually grow into a black hole of
mass as high as
due to the rapid (102 years)
accretion of the stellar envelope (Bisnovatyi-Kogan & Lamzin 1984).
The second option appears, however, to be unlikely, because it implies that, apart
from double neutron stars (DNS) originating from
stars,
there should be a comparable number of binaries with a neutron star in
combination with a black hole (NSBH binaries).
Assuming that the production rate of DNS and NSBH binaries from
stars is determined by the random pairing of stars with the
Salpeter initial mass function and that
stars produce black
holes, we expect the relative rate of formation of these binaries to be
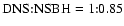 for
stars.
This ratio is in an apparent contradiction with the fact that eight DNS in
the Galaxy are known (Ihm et al. 2006, and references therein) and
no NSBH binary has yet been discovered.
The probability of a random realization of this situation is only
for
stars.
This ratio is in an apparent contradiction with the fact that eight DNS in
the Galaxy are known (Ihm et al. 2006, and references therein) and
no NSBH binary has yet been discovered.
The probability of a random realization of this situation is only
 ,
i.e. sufficiently small to be able to exclude the second option
that stars in the mass range of
end their lifes as black holes.
,
i.e. sufficiently small to be able to exclude the second option
that stars in the mass range of
end their lifes as black holes.
We propose that the core collapse of
stars should
produce a neutron star and the remaining stellar matter ejected as
a result of a faint SN event.
This picture predicts that the rate of faint SNe IIP should be comparable with
the combined rate of normal (e.g., SN 1999em), sub-luminous (e.g., SN 2005cs),
and low-luminosity (e.g., SN 2003Z) SNe IIP.
A detection of the extended class of faint SNe IIP, or non-detection at
a low flux level, could verify this scenario for
stars.
It is interesting that some known transient events, e.g. SN 1997bs
(Van Dyk et al. 2000), optical transient M 85 OT2006-1
(Pastorello et al. 2007), and SN 2008S (Prieto et al. 2008)
might belong to the proposed category of faint SNe related to the mass
range of
.
Acknowledgements
V.U. is very grateful to Wolfgang Hillebrandt for the excellent opportunity
to work at the MPA.
We thank the referee John Eldridge for careful reading of the manuscript and
helpful comments.
- Baklanov, P. V.,
Blinnikov, S. I., & Pavlyuk, N. N. 2005, Astron. Lett., 31,
429 [NASA ADS] [CrossRef]
(In the text)
- Bisnovatyi-Kogan, G. S.,
& Lamzin, S. A. 1984, Sov. Astron., 28, 187 [NASA ADS]
(In the text)
- Blinnikov, S. I.,
Eastman, R., Bartunov, O. S., Popolitov, V. A., & Woosley, S.
E. 1998, ApJ, 496, 454 [NASA ADS] [CrossRef]
(In the text)
- Blinnikov, S.,
Lundqvist, P., Bartunov, O., Nomoto, K., & Iwamoto, K. 2000,
ApJ, 532, 1132 [NASA ADS] [CrossRef]
(In the text)
- Chevalier, R. A.,
Fransson, C., & Nymark, T. K. 2006, ApJ, 641, 1029 [NASA ADS] [CrossRef]
(In the text)
- Chugai, N. N., &
Utrobin, V. P. 2008, Astron. Lett., 34, 589 [NASA ADS] [CrossRef]
(In the text)
- Chugai, N. N.,
Chevalier, R. A., & Utrobin, V. P. 2007, ApJ, 662, 1136 [NASA ADS] [CrossRef]
(In the text)
- de Jager, C.,
Nieuwenhuijzen, H., van der Hucht, K. A. 1988, A&AS, 72,
259 [NASA ADS]
(In the text)
- Eldridge, J. J.,
Mattila, S., & Smartt, S. J. 2007, MNRAS, 376, L52 [NASA ADS]
(In the text)
- Elias, J. H., Frogel,
J. A., & Humphreys, R. M. 1985, ApJS, 57, 91 [NASA ADS] [CrossRef]
(In the text)
- Garcia-Berro, E.,
Ritossa, C., & Iben, I. Jr. 1997, ApJ, 485, 765 [NASA ADS] [CrossRef]
(In the text)
- Harper, G. M., Brown,
A., & Lim, J. 2001, ApJ, 551, 1073 [NASA ADS] [CrossRef]
(In the text)
- Heger, A. 1998, The
presupernova evolution of rotating massive stars. Ph.D. Thesis,
Technische Universität München
(In the text)
- Heger, A., Fryer,
C. L., Woosley, S. E., Langer, N., & Hartmann, D. H. 2003, ApJ,
591, 288 [NASA ADS] [CrossRef]
(In the text)
- Herant, M., & Benz,
W. 1991, ApJ, 370, L81 [NASA ADS] [CrossRef]
(In the text)
- Hirschi, R., Meynet,
G., & Maeder, A. 2004, A&A, 425, 649 [NASA ADS] [CrossRef] [EDP Sciences]
(In the text)
- Ihm, C. M., Kalogera,
V., & Belczynski, K. 2006, ApJ, 652, 540 [NASA ADS] [CrossRef]
(In the text)
- Kifonidis, K.,
Plewa, T., Scheck, L., Janka, H.-Th., & Müller, E. 2003,
A&A, 408, 621 [NASA ADS] [CrossRef] [EDP Sciences]
(In the text)
- Kifonidis, K.,
Plewa, T., Scheck, L., Janka, H.-Th., & Müller, E. 2006,
A&A, 453, 661 [NASA ADS] [CrossRef] [EDP Sciences]
(In the text)
- Li, W., Van Dyk, S. D.,
Filippenko, A. V., et al. 2006, ApJ, 641, 1060 [NASA ADS] [CrossRef]
(In the text)
- Li, W., Wang, X., Van
Dyk, S. D., et al. 2007, ApJ, 661, 1013 [NASA ADS] [CrossRef]
(In the text)
- Maoz, D., & Mannucci,
F. 2008, ATel, 1464 [NASA ADS]
(In the text)
- Meynet, G., & Maeder,
A. 2003, A&A, 404, 975 [NASA ADS] [CrossRef] [EDP Sciences]
(In the text)
- Maund, J. R., Smartt,
S. J., & Danziger, I. J. 2005, MNRAS, 364, L33 [NASA ADS]
(In the text)
- Müller, E.,
Fryxell, B., & Arnett, D. 1991, A&A, 251, 505 [NASA ADS]
(In the text)
- Nadyozhin, D. K. 2003,
MNRAS, 346, 97 [NASA ADS] [CrossRef]
(In the text)
- Pastorello, A., Sauer,
D., Taubenberger, S., et al. 2006, MNRAS, 370, 1752 [NASA ADS]
(In the text)
- Pastorello, A., Della
Valle, M., Smartt, S. J., et al. 2007, Nature, 449, 1 [NASA ADS] [CrossRef]
(In the text)
- Prieto, J. L., Kistler,
M. D., Thompson, T. A., et al. 2008, ApJ, 681, L9 [NASA ADS] [CrossRef]
(In the text)
- Thorne, K. S., &
Zytkow, A. N. 1975, ApJ, 199, L19 [NASA ADS] [CrossRef]
(In the text)
- Tsvetkov, D. Yu.,
Volnova, A. A., Shulga, A. P., et al. 2006, A&A, 460, 769 [NASA ADS] [CrossRef] [EDP Sciences]
(In the text)
- Utrobin, V. P. 2004,
Astron. Lett., 30, 293 [NASA ADS] [CrossRef]
(In the text)
- Utrobin, V. P. 2005,
Astron. Lett., 31, 806 [NASA ADS] [CrossRef]
(In the text)
- Utrobin, V. P. 2007,
A&A, 461, 233 [NASA ADS] [CrossRef] [EDP Sciences]
(In the text)
- Utrobin, V. P., Chugai,
N. N., & Pastorello, A. 2007, A&A, 475, 973 [NASA ADS] [CrossRef] [EDP Sciences]
(In the text)
- Van Dyk, S. D., Peng,
C. Y., King, J. Y., et al. 2000, PASP, 112, 1532 [NASA ADS] [CrossRef]
(In the text)
- Vink, J. S., de Koter,
A., & Lamers, H. J. G. L. M. 2001, A&A, 369, 574 [NASA ADS] [CrossRef] [EDP Sciences]
(In the text)
- Woosley, S. E. 1988, ApJ,
330, 218 [NASA ADS] [CrossRef]
(In the text)
Copyright ESO 2008
![\begin{figure}
\par\resizebox{8.5cm}{!}{\includegraphics[clip]{0272fig2.eps}}
\end{figure}](/articles/aa/full/2008/44/aa10272-08/img24.gif)
![\begin{figure}
\par\includegraphics[width=8.6cm,clip]{0272fig5.eps}
\end{figure}](/articles/aa/full/2008/44/aa10272-08/img33.gif)
![\begin{figure}
\par\includegraphics[width=8.4cm,clip]{0272fig7.eps}
\end{figure}](/articles/aa/full/2008/44/aa10272-08/img45.gif)