 |
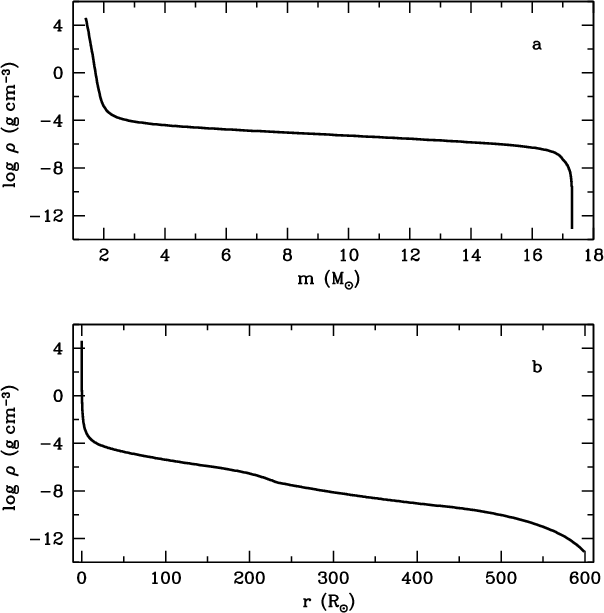
Figure 1:
Density distribution as a function of interior mass a) and
radius b) for the optimal pre-SN model.
The central core of 1.4  is omitted.
 |
| Open with DEXTER | |
In the text
![\begin{figure}
\par\resizebox{8.5cm}{!}{\includegraphics[clip]{0272fig2.eps}}
\end{figure}](/articles/aa/full/2008/44/aa10272-08/img24.gif) |
Figure 2: The mass fraction of hydrogen ( solid line), helium ( long dashed line), heavy elements ( short dashed line), and radioactive 56Ni ( dotted line) in the ejecta of the optimal model. |
| Open with DEXTER | |
In the text
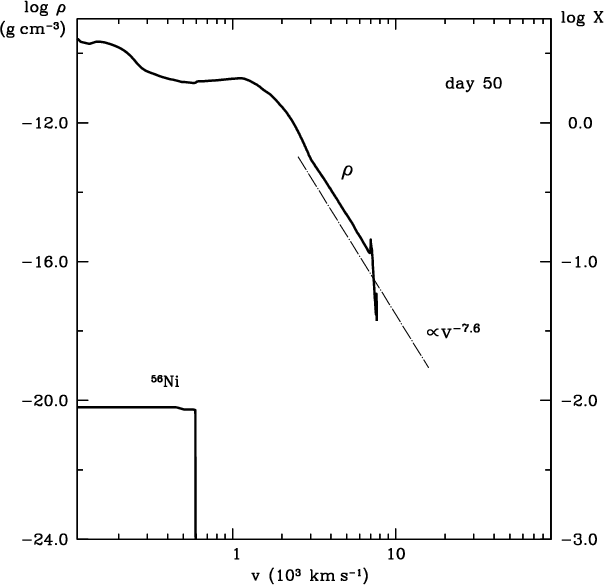 |
Figure 3:
The density and the 56Ni mass fraction as a function of the velocity
for the optimal model at t=50 days.
Dash-dotted line is the density distribution fit
 . . |
| Open with DEXTER | |
In the text
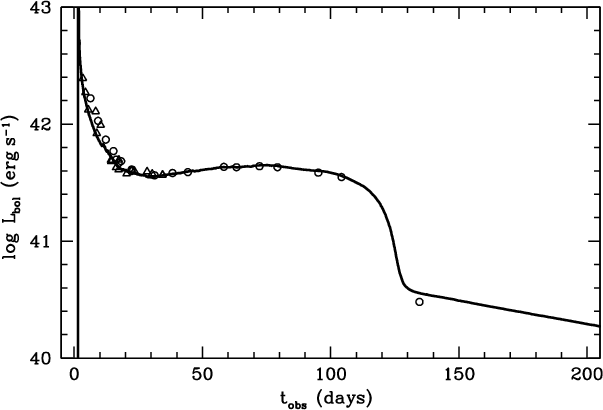 |
Figure 4: Comparison of the calculated bolometric light curve of the optimal model ( solid line) with the bolometric data of SN 2005cs evaluated from the photometric observations of Pastorello et al. (2006) ( open triangles) and Tsvetkov et al. (2006) ( open circles). |
| Open with DEXTER | |
In the text
![\begin{figure}
\par\includegraphics[width=8.6cm,clip]{0272fig5.eps}
\end{figure}](/articles/aa/full/2008/44/aa10272-08/img33.gif) |
Figure 5: Optimal hydrodynamic model. Panel a): the calculated B light curve ( solid line) compared with the observations of SN 2005cs obtained by Pastorello et al. (2006) ( open triangles) and Tsvetkov et al. (2006) ( open circles). Panels b) and c): the same as panel a) but for the V and R light curves. Panel d): calculated photospheric velocity ( solid line) is compared with photospheric velocities estimated from absorption minima of the He I 5876 Å line ( crosses) and the Fe II 5169 Å line ( open circles) measured by Pastorello et al. (2006). |
| Open with DEXTER | |
In the text
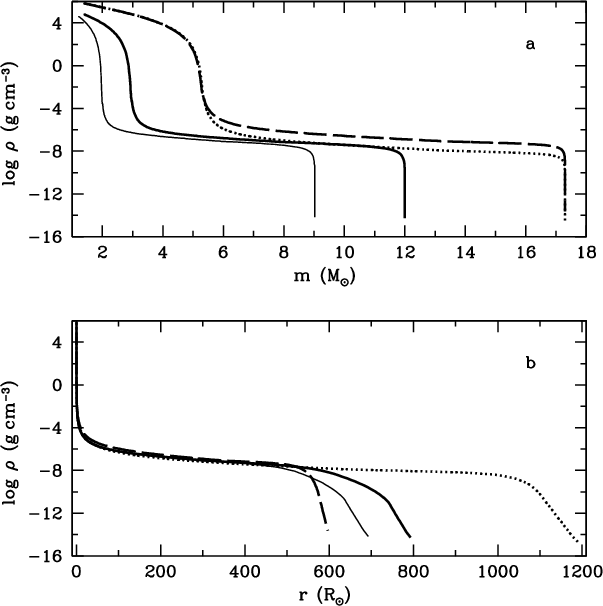 |
Figure 6: Density distribution as a function of interior mass a) and radius b) for the evolutionary pre-SNe (Table 1): model EM1 ( dotted line), model EM2 ( dashed line), model EM3 ( thick solid line), and model EM4 ( thin solid line). |
| Open with DEXTER | |
In the text
![\begin{figure}
\par\includegraphics[width=8.4cm,clip]{0272fig7.eps}
\end{figure}](/articles/aa/full/2008/44/aa10272-08/img45.gif) |
Figure 7: Bolometric light curve a), b), and c) and photospheric velocity d) of the hydrodynamic models in Table 1 compared with the empirical data of SN 2005cs (see legends of Figs. 4 and 5 for details). Dotted line is model EM1, dashed line is model EM2, thick solid line is model EM3, and thin solid line is model EM4. Mixed models EM3 and EM4 are shown by the corresponding dotted-dashed lines in panels b) and c). |
| Open with DEXTER | |
In the text
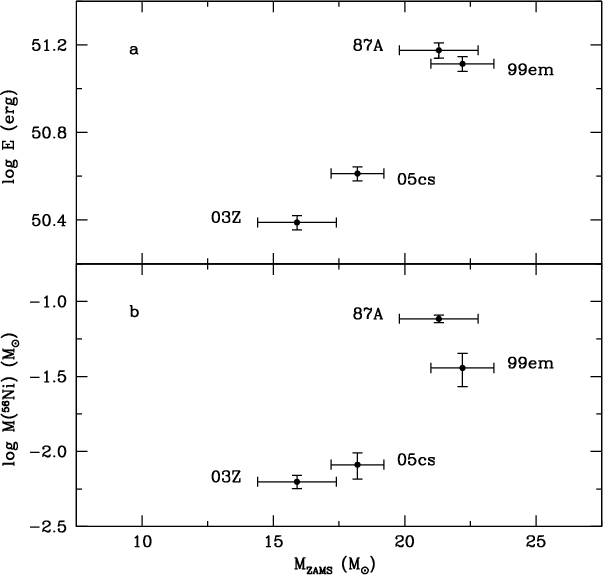 |
Figure 8: Explosion energy a) and 56Ni mass b) versus hydrodynamic progenitor mass for four core-collapse SNe. |
| Open with DEXTER | |
In the text
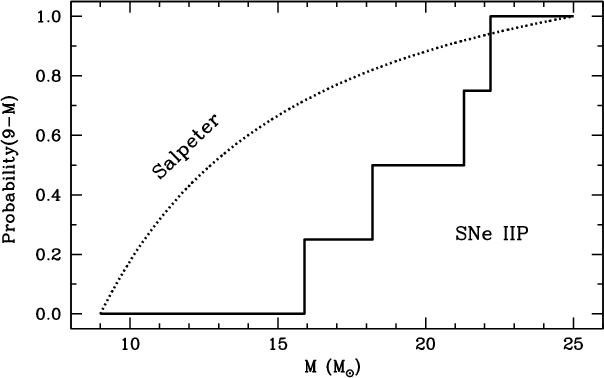 |
Figure 9:
Cumulative ``Salpeter'' distribution of SN IIP progenitors in
the
 mass range and the distribution of
hydrodynamic progenitor masses of four SNe IIP.
mass range and the distribution of
hydrodynamic progenitor masses of four SNe IIP. |
| Open with DEXTER | |
In the text