A&A 490, 893-904 (2008)
DOI: 10.1051/0004-6361:20079299
Radio-loud AGN in the XMM-LSS field
II. A dichotomy in environment and accretion mode?
C. Tasse1 - P. N. Best2 - H. Röttgering1 - D. Le Borgne3
1 - Leiden Observatory, University of Leiden, PO Box 9513, 2300 RA Leiden, The Netherlands
2 - SUPA, Institute for Astronomy, Royal Observatory
Edinburgh, Blackford Hill, Edinburgh EH9 3HJ, UK
3 - CEA/DSM/DAPNIA, Service d'Astrophysique, Saclay,
91191 Gif-sur-Yvette, France
Received 20 December 2007 / Accepted 9 May 2008
Abstract
In recent years, several authors have argued that low
luminosity radio-loud active galactic nuclei (AGN) have
a different mode of accretion, triggered by different physical
mechanisms, than ``normal'' optically- or X-ray-selected AGN. The
latter have a radiatively efficient nucleus (sometimes called ``Quasar-mode''),
which according to the unified scheme may be obscured from direct
view at optical wavelengths, whereas essentially all of the
energetic output of the low-luminosity radio-loud AGN is in their
radio jets (``Radio-mode'').
In this paper, we independently study the internal and
environmental properties of the optical hosts of the sample of
 110 radio sources with redshifts
0.1 < z < 1.2 in the
XMM-LSS Survey region. We do
this by building a comoving-scale-dependent overdensity
parameter, based on the photometric redshift probability
functions, to constrain the small (75 kpc) and large
(450 kpc) scale environments of radio sources independently
from their stellar mass estimates. Our results support the
picture in which the comoving evolution of radio sources in the
redshift range
110 radio sources with redshifts
0.1 < z < 1.2 in the
XMM-LSS Survey region. We do
this by building a comoving-scale-dependent overdensity
parameter, based on the photometric redshift probability
functions, to constrain the small (75 kpc) and large
(450 kpc) scale environments of radio sources independently
from their stellar mass estimates. Our results support the
picture in which the comoving evolution of radio sources in the
redshift range  1 is caused by two distinct galaxy
populations, whose radio source activity is triggered by two
different mechanisms. The first population, which dominates at
high stellar masses (
1 is caused by two distinct galaxy
populations, whose radio source activity is triggered by two
different mechanisms. The first population, which dominates at
high stellar masses (
 )
is that of
massive elliptical galaxies, lying in galaxy groups or clusters,
where the radio source is triggered by the cooling of the hot gas
in their atmosphere. At these stellar masses, we find that the
fraction of galaxies that host radio-loud AGN is essentially the same
as that in the local Universe. The second population of radio
sources have lower stellar masses, lie in large scale
underdensities, and show excess mid-IR emission consistent with a
hidden radiatively efficient active nucleus. The radio-loud
fraction at these masses is increased relative to the local
Universe. We argue that galaxy mergers and interactions may play
an important role in triggering the AGN activity of this second population.
)
is that of
massive elliptical galaxies, lying in galaxy groups or clusters,
where the radio source is triggered by the cooling of the hot gas
in their atmosphere. At these stellar masses, we find that the
fraction of galaxies that host radio-loud AGN is essentially the same
as that in the local Universe. The second population of radio
sources have lower stellar masses, lie in large scale
underdensities, and show excess mid-IR emission consistent with a
hidden radiatively efficient active nucleus. The radio-loud
fraction at these masses is increased relative to the local
Universe. We argue that galaxy mergers and interactions may play
an important role in triggering the AGN activity of this second population.
Key words: surveys - galaxies: active - galaxies: fundamental parameters - radio continuum: galaxies - infrared: galaxies - cosmology: large-scale structure of Universe
1 Introduction
Active galactic nuclei (AGN) have regained attention in the last
decade since they are thought to play a major role in the process of
galaxy formation. During their short lifetime, the enormous amount of
energy they produce in the form of ionising radiation or relativistic
jets can have a significant effect on their small-scale (internal) and
large scale (external) surroundings. It appears from semi-analytical
models and high resolution numerical simulations that the AGN
energetic feedback is a vital ingredient for reproducing some of the
observed features of the Universe, such as the stellar galaxy mass
function (Best et al. 2006; Croton et al. 2005), or the black hole mass versus bulge
mass relationship (Gebhardt et al. 2000; Springel et al. 2005a).
Unified schemes give a good description of the observed properties of
radio-quiet AGN (e.g. Elitzur 2007). In this picture, the
nuclear activity is produced by matter accreted onto a super-massive
black hole, with an optically thick dusty torus surrounding the
nucleus such that from some directions the AGN is seen directly while
from others it can be obscured. The most powerful radio sources also
follow the unified scheme, but there is a subset of radio loud AGN
(especially at low radio power) for whichthe unified scheme does not
seem appropriate: these sources lack infrared emission from the dusty
torus (Whysong & Antonucci 2004; Ogle et al. 2006), as well as luminous emission lines
(Laing et al. 1994; Hine & Longair 1979; Jackson & Rawlings 1997) and accretion related X-ray
emission (Hardcastle et al. 2006; Evans et al. 2006). These observations are
supported by recent results from large surveys (Best et al. 2005)
indicating that the low-luminosity radio-loud AGN and the radio-quiet
(optical) AGN phenomena are statistically independent. Many authors have argued
that the low luminosity radio-loud and the optically active AGN
correspond to two different accretion modes (the ``Radio mode'' or
``Hot mode'' versus the ``Quasar mode'' or ``Cold mode''; for a
discussion see Croton et al. 2006; Hardcastle et al. 2007). In this picture, the quasar mode
is radiatively efficient, and is caused by accretion of cold gas onto
the super-massive black hole, while the radio mode results from the
accretion of hot gas and is radiatively inefficient. As we show in
this paper, the nature of the processes that trigger the black hole
activity might be important in giving rise to these two AGN modes.
It has often been proposed that galaxy mergers and interactions both
trigger a starburst and fuel the central super-massive black
hole. Although the situation remains controversial for the low
luminosity optically active AGN (Veilleux 2003; Schmitt 2004),
observations of large samples of optically-selected AGN from the Sloan
Digital Sky Survey show clear evidence that the luminous optically
active AGN are associated with young stellar populations
(Kauffmann et al. 2003). At the extreme end, this scenario is supported by
observations of ultra-luminous infrared galaxies
(ULIRGs, Sanders & Mirabel 1996), that are in general associated with
galaxy mergers, and have bolometric luminosities similar to quasars
(Sanders et al. 1988a); some ULIRGs are known to hide a buried AGN in
their nucleus (e.g. Sanders et al. 1988b). High resolution numerical
simulations (Springel et al. 2005b,a) have consistently shown
that the AGN activity remains obscured during most of the starburst
and AGN activity phase.
In contrast to this, low-luminosity radio-loud AGN in the nearby
Universe are seen to be preferentially hosted by massive elliptical
galaxies, which tend to be found in richer, cold-gas poor
environments, where gas-rich galaxy mergers are less likely to
occur. The cooling of the hot X-ray emitting gas observed in the
atmospheres of massive elliptical galaxies (Mathews & Brighenti 2003) has been
proposed as an alternative triggering process for the AGN activity in
these sources. Based on a large sample of radio sources in the SDSS,
Best et al. (2005) argued that the gas cooling rate has the same
dependence on stellar mass as the fraction of low luminosity
radio-loud galaxies. This suggests that the gas that has radiatively
cooled from the X-ray emitting atmosphere may trigger the AGN
activity.
In this paper, we study the properties of a well-controlled sample of
110 radio loud AGN situated at
 ,
to place
constraints on the triggering mechanisms, and the evolution of the
radio-loud AGN population. Our results support the picture in which
galaxy mergers and gas cooling from the hot atmosphere of massive
ellipticals compete to trigger the quasar and the radio mode
respectively (Hardcastle et al. 2007). The evolution of these two
processes through cosmic time might play an important role in the
evolution of the radio luminosity function.
,
to place
constraints on the triggering mechanisms, and the evolution of the
radio-loud AGN population. Our results support the picture in which
galaxy mergers and gas cooling from the hot atmosphere of massive
ellipticals compete to trigger the quasar and the radio mode
respectively (Hardcastle et al. 2007). The evolution of these two
processes through cosmic time might play an important role in the
evolution of the radio luminosity function.
In Sect. 2, we present the sample, and its associated
parameters. In Sect. 3, we derive a radio loud
fraction (
 )
versus stellar mass relation equivalent to that
which has been estimated at low redshift in the SDSS
(Best et al. 2005). In Sect. 4, we construct a scale
dependent overdensity parameter that allows us to study the
environment of radio sources independently from their intrinsic
properties estimates. We discuss the results in Sect.
5.
)
versus stellar mass relation equivalent to that
which has been estimated at low redshift in the SDSS
(Best et al. 2005). In Sect. 4, we construct a scale
dependent overdensity parameter that allows us to study the
environment of radio sources independently from their intrinsic
properties estimates. We discuss the results in Sect.
5.
In this section we briefly introduce the XMM-LSS survey, and the
sample of radio sources that has been described in full detail in
Tasse et al. (2008).
The XMM-Large Scale Structure field (XMM-LSS) is a 10 square degree
extragalactic window observed by the XMM-Newton X-ray satellite in the
0.1-10 keV energy band. The XMM-LSS area has been followed up with a
broad range of extragalactic surveys. The Wide-1 component of the
Canada France Hawaï Telescope Legacy Survey (CFHTLS-W1) will image
 deg2 in the 5 broad band
u*g'r'i'z' filters, reaching an
i-band magnitude limit of
deg2 in the 5 broad band
u*g'r'i'z' filters, reaching an
i-band magnitude limit of
 .
As part of the Spitzer
Wide-area InfraRed Extragalactic legacy survey
(SWIRE, Lonsdale et al. 2003), the XMM-LSS field was imaged in 7infrared bands from 3.6 to 160
.
As part of the Spitzer
Wide-area InfraRed Extragalactic legacy survey
(SWIRE, Lonsdale et al. 2003), the XMM-LSS field was imaged in 7infrared bands from 3.6 to 160  m over 9
deg2 (see Pierre et al. 2004, for a layout of the associated
surveys). Low frequency radio surveys of the XMM-LSS field
have been carried out with the Very Large Array (Tasse et al. 2006) at
74 and 325 MHz, and with the Giant Meterwave Radio Telescope
(GMRT) at 230 and 610 MHz (Tasse et al. 2007).
m over 9
deg2 (see Pierre et al. 2004, for a layout of the associated
surveys). Low frequency radio surveys of the XMM-LSS field
have been carried out with the Very Large Array (Tasse et al. 2006) at
74 and 325 MHz, and with the Giant Meterwave Radio Telescope
(GMRT) at 230 and 610 MHz (Tasse et al. 2007).
In Tasse et al. (2008) we derived estimates of photometric redshifts,
stellar masses (M), and specific star formation rates sSFR0.5
(averaged over the last 0.5 Gyr) for
 galaxies in
the CFHTLS-W1 field, using the ZPEG photometric redshift code
(Le Borgne & Rocca-Volmerange 2002).
galaxies in
the CFHTLS-W1 field, using the ZPEG photometric redshift code
(Le Borgne & Rocca-Volmerange 2002).
We matched the radio sources detected at 230, 325, and 610 MHz
(Tasse et al. 2006,2007) with their optical counterpart using the
CFHTLS optical images. To do this we used a modified version of the
likelihood ratio method described in great detail in
Sutherland & Saunders (1992), which allowed us to derive for each radio source
i, a probability
 of association with a given optical
candidate j. Using Monte-Carlo simulations, we quantified and
corrected for the contamination from misidentifications. Each
optical candidate was also cross-identified with infrared SWIRE
sources at 3.6, 4.5, 5.8, 8.0 and 24 m. From the redshift
and spectral index estimates
of association with a given optical
candidate j. Using Monte-Carlo simulations, we quantified and
corrected for the contamination from misidentifications. Each
optical candidate was also cross-identified with infrared SWIRE
sources at 3.6, 4.5, 5.8, 8.0 and 24 m. From the redshift
and spectral index estimates![[*]](/icons/foot_motif.gif) , we
derived the 1.4 GHz radio power of each radio source host.
, we
derived the 1.4 GHz radio power of each radio source host.
In order to select a subsample of objects having reliable photometric
redshift estimates, we applied a few basic cuts to the identified sample,
rejecting masked, saturated, and point-like objects. Furthermore,
the objects that did not satisfy the following properties were rejected:
- -
- 18<i<24
- -
-

- -
-

where  is the number of bands in which the object is
detected, and
is the number of bands in which the object is
detected, and
 is the photometric redshift estimate.
In this paper, we reject the objects classified as type-1 AGN in
Tasse et al. (2008), since those have corrupted physical parameter
estimates (12.6% of the sample). This selection is
unlikely to affect the results presented in this paper (see the
discussion in Sect. 3.1). Since our goal is the study of the properties and
environment of radio-loud AGN, we also reject starburst galaxies
(3.3% of the sample). The
uncertainties associated with the selected sample of radio-loud AGN
are typically
 ,
,
![$\sigma(\log~(M/[M_{\odot}]))\sim0.15$](/articles/aa/full/2008/42/aa9299-07/img30.gif) and
and
![$\sigma(\log~(sS\!FR_{0.5}/[{\rm yr}^{-1}]))\sim0.3$](/articles/aa/full/2008/42/aa9299-07/img31.gif) (Tasse et al. 2008). As shown
in Fig. 1, the selected sample should contain both FRI-type
and FRII-type radio sources: below the radio power cut of
(Tasse et al. 2008). As shown
in Fig. 1, the selected sample should contain both FRI-type
and FRII-type radio sources: below the radio power cut of
 W/Hz, most radio sources are edge-darkened
FRIs, while the more luminous sources are mostly edge-brightened FRIIs
(for a discussion see Snellen & Best 2001).
W/Hz, most radio sources are edge-darkened
FRIs, while the more luminous sources are mostly edge-brightened FRIIs
(for a discussion see Snellen & Best 2001).
![\begin{figure}
\par\includegraphics[width=9cm,clip]{9299_000.ps}
\end{figure}](/articles/aa/full/2008/42/aa9299-07/Timg33.gif) |
Figure 1:
The 1.4 GHz radio power of the selected radio sources (dots) as a function of
their estimated redshift. The
dashed and dotted lines show the completeness levels at 325 and
610 MHz respectively, as derived using the median flux density
level of those surveys ( ,
Tasse et al. 2006,2007), and assuming a spectral index ,
Tasse et al. 2006,2007), and assuming a spectral index
 . .
|
| Open with DEXTER |
3 Intrinsic properties of the host galaxies of radio sources
In this section, we study the intrinsic properties of the host
galaxies of the radio source sample described above. Specifically, in
Sect. 3.1 we compare their stellar mass function to that
of the normal galaxies in different redshift bin and in Sect.
3.2 we address the evolution of radio sources using the
 estimator. In Sect. 3.3, we compute an
infrared excess estimator.
estimator. In Sect. 3.3, we compute an
infrared excess estimator.
3.1 Stellar mass functions
We have derived the stellar mass function for normal galaxies
(
 )
in the redshift ranges 0.1<z<1.2, 0.1<z<0.6,
0.4<z<0.9, and 0.7<z<1.2, using the
)
in the redshift ranges 0.1<z<1.2, 0.1<z<0.6,
0.4<z<0.9, and 0.7<z<1.2, using the
 estimator
(Schmidt 1968; see Tasse et al. 2008, for details). In
Fig. 2 we compare these mass functions with the mass
functions derived for the host galaxies of the radio sources in the
sample. As discussed in Tasse et al. (2008), our estimates of
(for all galaxies) are in good agreement over the full
mass range with the stellar mass function as derived from the
GOODS-MUSIC sample (Fontana et al. 2006); the low values obtained at low
stellar masses in the higher redshift bin are discussed below. As
expected from the SDSS-NVSS analysis (Best et al. 2005), the shape of
estimator
(Schmidt 1968; see Tasse et al. 2008, for details). In
Fig. 2 we compare these mass functions with the mass
functions derived for the host galaxies of the radio sources in the
sample. As discussed in Tasse et al. (2008), our estimates of
(for all galaxies) are in good agreement over the full
mass range with the stellar mass function as derived from the
GOODS-MUSIC sample (Fontana et al. 2006); the low values obtained at low
stellar masses in the higher redshift bin are discussed below. As
expected from the SDSS-NVSS analysis (Best et al. 2005), the shape of
 is different from
,
with the radio source
host galaxies being biased towards more massive
systems. Interestingly, while the comoving number density of normal
galaxies decreases with redshift, the radio source host galaxies
having M<1011
is different from
,
with the radio source
host galaxies being biased towards more massive
systems. Interestingly, while the comoving number density of normal
galaxies decreases with redshift, the radio source host galaxies
having M<1011  show strong positive redshift evolution. In
the redshift bin 0.7<z<1.2, the stellar mass function is rather
flat.
show strong positive redshift evolution. In
the redshift bin 0.7<z<1.2, the stellar mass function is rather
flat.
![\begin{figure}
\par\includegraphics[width=18cm,clip]{9299_001.ps}
\end{figure}](/articles/aa/full/2008/42/aa9299-07/Timg37.gif) |
Figure 2:
Using the
comoving number
density estimator, we have derived the stellar mass function for
normal galaxies and for the host galaxies of radio sources in
different redshift bins. For the normal galaxies, at all redshifts
our estimate of the stellar mass function is in good agreement with
its measurement in the GOODS surveys (Fontana et al. 2006), which
suggests that the stellar masses estimates are reliable. The
underestimation of the mass function at low stellar masses in the
redshift bins 0.4<z<0.9 and 0.7<z<1.2 is due to
incompleteness. The stellar mass function of the radio source host galaxies
shows a very different, evolving shape. |
| Open with DEXTER |
![\begin{figure}
\par\includegraphics[width=18cm,clip]{9299_002.ps}
\end{figure}](/articles/aa/full/2008/42/aa9299-07/Timg40.gif) |
Figure 3:
The fraction of radio
sources that are radio loud as a function of the stellar mass in a
given comoving volume. These relations have been derived using the
mass function estimates of the normal and radio loud galaxies
presented in Fig. 2. In the lower redshift bins, our
measurement of the
 relation matches its SDSS/NVSS
 estimate (Best et al. 2005) both in normalisation and
shape. While the fraction of high stellar mass objects
estimate (Best et al. 2005) both in normalisation and
shape. While the fraction of high stellar mass objects
 stays fairly constant with redshift, the
fraction of lower stellar mass objects
(
stays fairly constant with redshift, the
fraction of lower stellar mass objects
(
 )
undergoes a strong
evolution. )
undergoes a strong
evolution. |
| Open with DEXTER |
This effect is clearly shown in Fig. 3 which displays the
fraction of galaxies that are radio-loud AGN
(
 ), as a function of stellar mass in the
four redshift bins. At low redshift and at
), as a function of stellar mass in the
four redshift bins. At low redshift and at
 ,
the shape and normalisation of our estimate of
matches that
found in the local Universe (
,
the shape and normalisation of our estimate of
matches that
found in the local Universe (
 )
by
Best et al. (2005). However, we find evidence that the
relation
flattens at
)
by
Best et al. (2005). However, we find evidence that the
relation
flattens at
 .
In the higher redshift
bins the fraction of radio-loud objects agrees with the low redshift
measurements for high stellar masses, but the lower stellar masses
show a strong evolution. The physical
implications of these results are discussed in Sect. 5.
.
In the higher redshift
bins the fraction of radio-loud objects agrees with the low redshift
measurements for high stellar masses, but the lower stellar masses
show a strong evolution. The physical
implications of these results are discussed in Sect. 5.
We investigate below the possibility that this effect is caused by (i)
an incompleteness effect caused by our flux limited survey; (ii) the
scatter along the stellar mass axis, due to the uncertainties in that
parameter; and (iii) a selection effect due to the rejection of the
type-1 AGN (Sect. 2).
Fontana et al. (2004) have extensively discussed a common incompleteness
effect arising when computing comoving number densities from
flux-limited surveys. The
estimator calculates the number
densities by taking account of the differing detection limits of those
galaxies detected in each given stellar mass bin. However,
galaxies of a given stellar mass have different spectral types and may
have very different mass-to-light ratios. Therefore, especially at
high redshifts, galaxies of some spectral types may simply not be
detected at all, and the
estimator will not correct for
these, leading to an underestimation in the derived comoving number
density. The host galaxies of radio sources may be significantly
different from normal galaxies, hence may have mass-to-light ratios
that differ on average to those of the normal galaxy population; this
would lead to a different incompleteness for
and
,
thereby driving a bias in
.
We investigate the
possibility that this effect causes the flattening of the
relation by estimating an upper limit to that bias. In the most
extreme case, all radio source host galaxies are detected, but not all
normal galaxies. The good match between our mass function for the
normal galaxies and that of Fontana et al. (2006) indicates that this
effect should not significantly affect
in the redshift
bin 0.1<z<0.6 and 0.4<z<0.9. However, the lower estimate of the
comoving number density for M<1010 in the higher redshift
bin indicates that the effect of incompleteness may affect our
comoving number density estimate in that redshift range by a factor of
2. The bias in
should therefore be less than a factor
of 2, while the flattening involves differences of a factor of
100. We therefore conclude that this effect cannot explain the
observed flattening.
We investigate the possibility that this flattening is produced by the
uncertainty in the stellar masses estimate, that is higher at higher
redshift. For this, we generate mass functions for the host galaxies
of radio sources corresponding to a fraction
 ,
where
,
where  is the slope of the relation and C11is its normalisation at
 .
We assume that the
.
We assume that the
 within a given stellar mass bin will be similar for all
galaxies of that bin. Given the average
of the objects of a
given stellar mass, we estimate the true number of sources to be
observed in a given stellar mass bin for each .
We then
generate a simulated catalog corresponding to a
within a given stellar mass bin will be similar for all
galaxies of that bin. Given the average
of the objects of a
given stellar mass, we estimate the true number of sources to be
observed in a given stellar mass bin for each .
We then
generate a simulated catalog corresponding to a
 relation, by scattering the true stellar mass estimates:
each object in a given stellar mass bin is given the stellar mass of
the ith object of the S1 sample with a probability
relation, by scattering the true stellar mass estimates:
each object in a given stellar mass bin is given the stellar mass of
the ith object of the S1 sample with a probability
 ,
where
,
where
 is the
identification probability (Tasse et al. 2008) and
is the
identification probability (Tasse et al. 2008) and
 is the
probability that the true stellar mass of object i is in the mass
bin
is the
probability that the true stellar mass of object i is in the mass
bin  .
The operation is repeated 10 times, and the fraction
is re-evaluated in each mass bin. As expected the mass
scatter has the effect of increasing the observed fraction of low
stellar mass objects. We quantify this effect by calculating the
.
The operation is repeated 10 times, and the fraction
is re-evaluated in each mass bin. As expected the mass
scatter has the effect of increasing the observed fraction of low
stellar mass objects. We quantify this effect by calculating the
 on a grid where the free parameters are
and
C11, and associated error bars are taken at
on a grid where the free parameters are
and
C11, and associated error bars are taken at
 (Avni & Bahcall 1976). Figure 4 shows the best fit parameters in
different redshift slices. The normalisation C11 of
stays roughly constant through redshift. At low redshift, the slope
measurement gives a good fit to the
(Avni & Bahcall 1976). Figure 4 shows the best fit parameters in
different redshift slices. The normalisation C11 of
stays roughly constant through redshift. At low redshift, the slope
measurement gives a good fit to the
 found by
Best et al. (2005), while it progressively flattens towards higher
redshift, by only slightly less than the data. This shows that the
effect of the stellar masses uncertainty cannot explain the flattening
of the fraction-mass relation at low stellar masses.
found by
Best et al. (2005), while it progressively flattens towards higher
redshift, by only slightly less than the data. This shows that the
effect of the stellar masses uncertainty cannot explain the flattening
of the fraction-mass relation at low stellar masses.
As mentioned in Sect. 2, 12% of the radio-loud
AGN were classified as type-1 (Tasse et al. 2008) and rejected. We
discuss here the possible effect of this selection on our
conclusions. If the stellar mass of the host galaxies of type-1 AGN
are uniformly spread over all stellar masses, then the comoving number
density and fraction in each stellar mass bin (Figs. 2 and
3) differ from their unbiased estimate by
12%. This difference is lower than the uncertainties on comoving number
density and fraction estimates in all the stellar mass bin. If the
type-1 AGN are biased towards a particular stellar mass
this effect would be greater. However, in the extreme case where all
the type-1 AGN are associated with the 12% galaxies that
have the lowest stellar mass, the error in the results at low masses
is a factor of 2, or 0.3 dex which is still within the estimated
uncertainties. Therefore the bias introduced by the rejection of the
type-1 AGN should not affect our conclusions.
![\begin{figure}
\par\includegraphics[width=4.4cm,clip]{9299_003.ps}\includegraphics[width=4.15cm,clip]{9299_004.ps}\end{figure}](/articles/aa/full/2008/42/aa9299-07/Timg56.gif) |
Figure 4:
This figure shows the best fit values for the parameters C11 ( left panel) and
( right panel) in each
redshift bin (see text). The low values of
in the higher
redshift bins suggests that the scatter introduced by the stellar mass uncertainty cannot explain the
flattening of the
relation seen in Fig. 3. |
| Open with DEXTER |
![\begin{figure}
\par\includegraphics[width=9cm,clip]{9299_006.ps}\end{figure}](/articles/aa/full/2008/42/aa9299-07/Timg58.gif) |
Figure 6:
The averaged
in different
stellar mass bins, for the normal galaxies, and for the radio
source host galaxies. |
| Open with DEXTER |
3.2 Radio source evolution
In this section we address the issue of the evolution of radio
source host galaxies within our sample using the
test
(Schmidt 1968), where V is the comoving volume corresponding to
the observed redshift of the radio source host galaxies, and
is
the maximum available volume, described in Tasse et al. (2008). If the
radio source population is not evolving, then
is uniformly
distributed over the interval [0,1] and
 where N is the number of sources in the
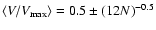
sample (Avni & Bahcall 1980). Values of
where N is the number of sources in the
sample (Avni & Bahcall 1980). Values of
 imply a higher
comoving number density at high redshifts, and therefore a negative
evolution with cosmic time, whereas
imply a higher
comoving number density at high redshifts, and therefore a negative
evolution with cosmic time, whereas
 indicates a positive evolution. A number of authors have used this
estimator to address the cosmological evolution of radio sources
selected at low frequency (Dunlop & Peacock 1990; Willott et al. 2001).
indicates a positive evolution. A number of authors have used this
estimator to address the cosmological evolution of radio sources
selected at low frequency (Dunlop & Peacock 1990; Willott et al. 2001).
Figure 5 shows the comparison between the
 radio power relation for our sample and
that of Clewley & Jarvis (2004), which was built from SDSS galaxies selected at
325 MHz. There is a good agreement between the two estimates.
radio power relation for our sample and
that of Clewley & Jarvis (2004), which was built from SDSS galaxies selected at
325 MHz. There is a good agreement between the two estimates.
In Fig. 6 we compute the
in
different stellar mass bins. Although radio sources are seen to evolve
more than normal galaxies on average, their evolution shows a similar
trend with stellar mass: low stellar mass systems evolve more than
high stellar mass ones. These results are further discussed in Sect.
5.
3.3 Infrared properties of radio source host galaxies
As described in Tasse et al. (2008), we have associated with each radio source the
infrared IRAC flux density measurements at 3.6, 4.5, 5.8 and 8.0m. Because ZPEG does not include infrared dust emission, the
photometric redshifts have been computed from the magnitude
measurements in the
u*g'r'i'z' bands. We define an infrared
excess parameter as:
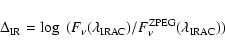 |
(1) |
where
 is the IRAC flux density
measurement at
is the IRAC flux density
measurement at
 and
and
 is the flux density measurement from the ZPEG best fit template at
.
The infrared excesses are computed in the observer
frame.
is the flux density measurement from the ZPEG best fit template at
.
The infrared excesses are computed in the observer
frame.
Figure 7 shows the infrared excess at 3.6 m computed
for the normal galaxy population and for radio source host
galaxies. The infrared excess is higher for the radio source host
galaxies than for the normal galaxies, especially at low stellar
masses. However, the radio sources host galaxies and the normal
galaxy population have different properties, notably in terms of
redshift and magnitude distribution. Therefore, in order to reliably
compare the infrared properties of these two distinct populations, for
each radio source host galaxy we compute the quantity
 ,
where
,
where
 is the
infrared excess of the given radio source host, which is in the mass
bin
is the
infrared excess of the given radio source host, which is in the mass
bin  and in the redshift bin
  ,
and
,
and
 is
the average value of the infrared excess for the normal galaxies that
lie in the same mass and redshift bin. Figure 7 shows
that an infrared excess remains observed for the radio source host
galaxies with low stellar masses. The high stellar mass radio source
hosts do not show an infrared excess. This result is further discussed
in Sect. 5.
is
the average value of the infrared excess for the normal galaxies that
lie in the same mass and redshift bin. Figure 7 shows
that an infrared excess remains observed for the radio source host
galaxies with low stellar masses. The high stellar mass radio source
hosts do not show an infrared excess. This result is further discussed
in Sect. 5.
![\begin{figure}
\par\mbox{\includegraphics[width=8.8cm,clip]{9299_007.ps}\includegraphics[width=8.8cm,clip]{9299_008.ps} }
\end{figure}](/articles/aa/full/2008/42/aa9299-07/Timg72.gif) |
Figure 7:
The left panel shows the infrared excess
 at
3.6 m for the radio source host galaxies and for the normal
galaxies. In the right panel,
we compare the infrared excess of individual radio source host galaxies
with normal galaxies that are in the same mass and redshift
range.
at
3.6 m for the radio source host galaxies and for the normal
galaxies. In the right panel,
we compare the infrared excess of individual radio source host galaxies
with normal galaxies that are in the same mass and redshift
range. |
| Open with DEXTER |
![\begin{figure}
\par\mbox{\includegraphics[width=0.49\textwidth,clip]{9299_010.ps...
..._012.ps}\includegraphics[width=0.49\textwidth,clip]{9299_013.ps} }\end{figure}](/articles/aa/full/2008/42/aa9299-07/Timg73.gif) |
Figure 8:
Overdensity estimator
based on the individual photometric redshift probability
functions. Top left panel shows a given region of the CFHTLS field in
which we have computed the overdensity parameter at different scales
for the objects brighter than i=23. The other panels show the
overdensity for each object on 450, 250 and 75 kpc scales, following
the color code of top right panel. The clustering at the different
scales is different. The galaxy cluster that appears visually
obvious in the i-band image is detected with a 450 kpc scale
giving many galaxies an overdensity parameter
 .
Decreasing the overdensity scale enhances small groups of
galaxies or even galaxy mergers. .
Decreasing the overdensity scale enhances small groups of
galaxies or even galaxy mergers. |
| Open with DEXTER |
4 The environment of the host galaxies of radio sources
In order to study the environment of radio sources, we use a
scale-dependent estimator of the overdensity around a given galaxy,
which is based on the photometric redshift probability functions. The
overdensity estimator is described in detail in Appendix
A. This estimator has the advantage of (i) having a
physical comoving scale as input, (ii) fully using the information
contained within the photometric redshift probability function, and
(iii) controling edge effects. Overdensities found on large scales may
relate to galaxy clusters, whereas smaller scales may relate to small
groups of galaxies, or pairs of galaxies.
4.1 The overdensity parameter
The derivation of the overdensity parameter is described fully in
Appendix A, but we summarise it here. The
 that were available from ZPEG for all the objects of the CFHTLS-W1
field (Tasse et al. 2008) are first converted into probability functions
p(z). Given an object, its associated p(z), and a comoving scale
that were available from ZPEG for all the objects of the CFHTLS-W1
field (Tasse et al. 2008) are first converted into probability functions
p(z). Given an object, its associated p(z), and a comoving scale
 ,
we estimate the number of objects n enclosed in the
co-cone of radius
.
Because the optical survey is flux
limited, the estimate of n strongly depends on the probability
function of the considered object: if the object is at high redshift,
only the most luminous nearby galaxies can be detected, which biases
the number density towards lower values. Therefore, we define the
overdensity parameter with the significance of a given observed n. To do this, we generate 20 catalogs containing the same objects,
with uniformly distributed positions (no clustering). In each of these
catalogs, the number density
,
we estimate the number of objects n enclosed in the
co-cone of radius
.
Because the optical survey is flux
limited, the estimate of n strongly depends on the probability
function of the considered object: if the object is at high redshift,
only the most luminous nearby galaxies can be detected, which biases
the number density towards lower values. Therefore, we define the
overdensity parameter with the significance of a given observed n. To do this, we generate 20 catalogs containing the same objects,
with uniformly distributed positions (no clustering). In each of these
catalogs, the number density
 around the given object is
calculated and the mean
around the given object is
calculated and the mean
 and standard
deviation
and standard
deviation
 are estimated. The overdensity
  is then computed as
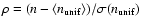 .
.
We have derived the overdensity parameter on 75, 250, and 450kpc scales for both the radio source host galaxies sample and for the normal galaxies. Figure 8 shows an example of the overdensity parameter
estimates derived for the i<23 objects within a
 field. We chose this location because
it contains galaxies belonging to a galaxy cluster as well as
field galaxies. Qualitatively, our algorithm looks efficient: a high
overdensity parameter corresponding to an overdense region is seen at
the location where the overdensity is obvious in the sky plane.
field. We chose this location because
it contains galaxies belonging to a galaxy cluster as well as
field galaxies. Qualitatively, our algorithm looks efficient: a high
overdensity parameter corresponding to an overdense region is seen at
the location where the overdensity is obvious in the sky plane.
4.2 The environment of radio sources
![\begin{figure}
\par\mbox{\includegraphics[width=8cm,clip]{9299_014.ps}\includegraphics[width=8cm,clip]{9299_015.ps} }
\end{figure}](/articles/aa/full/2008/42/aa9299-07/Timg82.gif) |
Figure 9:
Left panel: the difference in
overdensity parameter
 between the radio source host galaxies, and the normal galaxies, as a
function of the stellar mass. Because
these two populations are significantly different in terms of redshift and
magnitude distribution notably, we compare the overdensity of each
radio source to the overdensity around normal galaxies in the same mass
and redshift bin. This quantity is plotted for different input
scales. However, the overdensity estimates on a given scale may depend
on the overdensity estimate on another scale. In order to address
that issue, in the right panel we compute the overdensity differences
on small and large
scale for galaxies situated in similar large and small scale environments respectively
(see discussion in the text). The environmental dichotomy remains observed.
between the radio source host galaxies, and the normal galaxies, as a
function of the stellar mass. Because
these two populations are significantly different in terms of redshift and
magnitude distribution notably, we compare the overdensity of each
radio source to the overdensity around normal galaxies in the same mass
and redshift bin. This quantity is plotted for different input
scales. However, the overdensity estimates on a given scale may depend
on the overdensity estimate on another scale. In order to address
that issue, in the right panel we compute the overdensity differences
on small and large
scale for galaxies situated in similar large and small scale environments respectively
(see discussion in the text). The environmental dichotomy remains observed. |
| Open with DEXTER |
The overdensity parameter is likely to be quite sensitive to the mass
of the object, and some residual redshift dependence may
remain. Comparing the overdensity distributions of two populations
having different magnitude and redshift distributions would therefore
be misleading. Instead, in the following, we compare the environment
of a given radio source host galaxy to that of the normal galaxy
population in the same mass and redshift range. We do this by
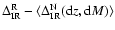
computing the quantity
![$\Delta\rho_i=\rho_i-{q}_{0.5}[
\rho^{\rm N}({\rm d}z,{\rm d}M) ]$](/articles/aa/full/2008/42/aa9299-07/img83.gif) ,
where
,
where  is the overdensity of the given
galaxy in the redshift and mass bins
is the overdensity of the given
galaxy in the redshift and mass bins
 ,
while
,
while

![${q}_{0.5}[\rho^{\rm N}({\rm d}z,{\rm d}M)]$](/articles/aa/full/2008/42/aa9299-07/img87.gif) is the median
overdensity parameter of normal galaxies in the same redshift and
stellar mass interval. In practice,
is taken to be the stellar
mass bin, and we set
is the median
overdensity parameter of normal galaxies in the same redshift and
stellar mass interval. In practice,
is taken to be the stellar
mass bin, and we set
 .
.
Figure 9 shows the median value of
in
different stellar mass bins and at different scales. The observed
relations were bin dependent, therefore we smooth the
observation with a box of width
 .
In order to quantify
the uncertainty in the median value estimate, we follow a Monte-Carlo
approach. We assume the
distributions have the same shape
in all stellar mass bins. By generating samples of n sources
following the same distribution we estimate the error bar on the
median as the standard deviation between the estimated median and the
true median.
.
In order to quantify
the uncertainty in the median value estimate, we follow a Monte-Carlo
approach. We assume the
distributions have the same shape
in all stellar mass bins. By generating samples of n sources
following the same distribution we estimate the error bar on the
median as the standard deviation between the estimated median and the
true median.
A stellar mass dichotomy appears in Fig. 9, with the
two different environmental regimes occuring above and below a stellar
mass range of
1010.5-10.8 .
The higher stellar mass
radio source host galaxies lie in a 450 kpc scale environment that is on
average denser than the environment of the non-radio-loud galaxies of
the same mass by
 ,
while their small scale
environment has
,
while their small scale
environment has
 .
An inverse relation is observed
for the low stellar masses objects: their small scale 75 kpc scale
environment is denser than the average by
.
An inverse relation is observed
for the low stellar masses objects: their small scale 75 kpc scale
environment is denser than the average by
 ,
while
their large scale environment is significantly underdense on average,
with
,
while
their large scale environment is significantly underdense on average,
with
 .
.
However, the estimated overdensities may be dependent at the different
scales: high 450 kpc scale overdensities may lead to higher 75 kpc
scale overdensities. In order to study the 75 kpc overdensities of
radio source host galaxies independently of their large
450 kpc environment, we compute the quantity
![$\Delta\rho (75\vert 450)
=\rho_{i,75}-{q}_{0.5}[ \rho_{75}^{\rm N}({\rm d}z,{\rm d}M,{\rm d}\rho_{450}) ]$](/articles/aa/full/2008/42/aa9299-07/img94.gif) ,
where
,
where
![${q}_{0.5}[ \rho_{75}^{\rm N}({\rm d}z,{\rm d}M,{\rm d}\rho_{450})]$](/articles/aa/full/2008/42/aa9299-07/img95.gif) is the median
overdensity of non-radio-loud galaxies that lie in similar large scale
environments and that have comparable stellar mass and redshift
estimates. Similarly, we compute
is the median
overdensity of non-radio-loud galaxies that lie in similar large scale
environments and that have comparable stellar mass and redshift
estimates. Similarly, we compute
 ,
and we take
,
and we take
 .
Figure 9 shows
.
Figure 9 shows
 and
:
the environmental dichotomy remains observed
with the stellar mass cut in the range
1010.8-11.0 .
These results are
further discussed in Sect. 5.
and
:
the environmental dichotomy remains observed
with the stellar mass cut in the range
1010.8-11.0 .
These results are
further discussed in Sect. 5.
4.3 Comparison with X-ray selected galaxy clusters
In order to provide some quantification of what the values of the
overdensity parameters for the radio source hosts actually mean, we
take advantage of the XMM X-ray data of the field which provides
samples of X-ray groups and clusters. In this section we compare the
overdensities found around radio sources to overdensity estimates of
X-ray groups and clusters of different bolometric luminosity (i.e. dark
matter halo mass), to place further constraints on the environment of
radio sources determined in Sect. 4.2.
Here we consider the sample of X-ray clusters detected as extended
X-ray emission (Pacaud et al. 2006) in the initial 5 deg2 of the
XMM-LSS field (Pierre et al. 2004), and were spectroscopically confirmed (Pierre et al. 2006). By fitting a model of free-free
emission to the X-ray spectra of 29 sources, Pierre et al. (2006) and
Pacaud et al. (2007) measured bolometric luminosities as well as
temperatures. Only 12 of those sources overlap with the CFHTLS-W1
field, however, so to increase the size of the X-ray cluster sample we
also consider the X-ray sources classified as extended by the X-ray
pipeline, but which have not yet been spectroscopically confirmed. The
final sample of extended X-ray sources contains 35 sources in the
redshift range
.
We describe below how we derived a
crude estimation of the redshifts and bolometric luminosities of these
clusters.
![\begin{figure}
\par\includegraphics[width=8.8cm,clip]{9299_018.ps}
\end{figure}](/articles/aa/full/2008/42/aa9299-07/Timg99.gif) |
Figure 10:
The comparison between
our estimate of the bolometric luminosity ( (zphots)) with the
bolometric luminosity (zspec) as deduced using spectroscopic
redshift and X-ray spectral fits. The two estimates are in
reasonable agreement. (zphots)) with the
bolometric luminosity (zspec) as deduced using spectroscopic
redshift and X-ray spectral fits. The two estimates are in
reasonable agreement. |
| Open with DEXTER |
We estimated the overdensity on 75, 250 and 450 kpc scales for
the galaxies that lie within
 of the galaxy clusters
detected as extended X-rays sources.
In most cases, inspecting the
of the galaxy clusters
detected as extended X-rays sources.
In most cases, inspecting the
 plane showed a peak in
the redshift distribution of the galaxies aligned with a given
extended X-ray source, and having a high
plane showed a peak in
the redshift distribution of the galaxies aligned with a given
extended X-ray source, and having a high
 overdensity
estimate. If a redshift peak was detected, we assigned that redshift
to the extended X-ray emission, otherwise we rejected the X-ray
source. We estimated the bolometric luminosity using the X-ray
pipeline XSPEC. We modelled the X-ray emission with a bremsstrahlung
emission model (named ``APEC'' in XPEC), assuming a metal abundance of
0.3
overdensity
estimate. If a redshift peak was detected, we assigned that redshift
to the extended X-ray emission, otherwise we rejected the X-ray
source. We estimated the bolometric luminosity using the X-ray
pipeline XSPEC. We modelled the X-ray emission with a bremsstrahlung
emission model (named ``APEC'' in XPEC), assuming a metal abundance of
0.3  ,
a temperature of 3keV at each redshift in 0<z<2, and thus derived a [0.5-2] keV flux
to bolometric luminosity conversion factor. Based on this
estimate of the X-ray luminosity, we estimated the gas
temperature by assuming that the clusters of galaxies follow the
temperature versus luminosity relation (Arnaud & Evrard 1999). We
derived new estimates of the bolometric luminosity based on these
temperature estimates. For the extended X-ray sources confirmed
spectroscopically (Pacaud et al. 2007), Fig. 10 shows the
comparison between the bolometric luminosities, as estimated using (i)
the combination of photometric redshift and overdensity parameter and
(ii) the spectroscopic redshifts and spectral fits
(Pacaud et al. 2007). Except for one point, the two estimates agree within
0.2 dex.
,
a temperature of 3keV at each redshift in 0<z<2, and thus derived a [0.5-2] keV flux
to bolometric luminosity conversion factor. Based on this
estimate of the X-ray luminosity, we estimated the gas
temperature by assuming that the clusters of galaxies follow the
temperature versus luminosity relation (Arnaud & Evrard 1999). We
derived new estimates of the bolometric luminosity based on these
temperature estimates. For the extended X-ray sources confirmed
spectroscopically (Pacaud et al. 2007), Fig. 10 shows the
comparison between the bolometric luminosities, as estimated using (i)
the combination of photometric redshift and overdensity parameter and
(ii) the spectroscopic redshifts and spectral fits
(Pacaud et al. 2007). Except for one point, the two estimates agree within
0.2 dex.
Figure 11 shows the averaged values of
(see Sect. 4.1) in different galaxy stellar mass
and bolometric luminosity ranges. Galaxies aligned within a luminous
X-ray cluster have higher overdensity estimates: in the luminosity
range
 erg s-1,
is as high as
9, while
erg s-1,
is as high as
9, while
 at
at
 erg s-1. We
interpret this effect as being caused by an increase of the true
overdensity with increasing X-ray luminosity, as it is well known that
the bolometric luminosity of the X-ray emitting gas correlates with
the dark matter halo mass (Popesso et al. 2005).
erg s-1. We
interpret this effect as being caused by an increase of the true
overdensity with increasing X-ray luminosity, as it is well known that
the bolometric luminosity of the X-ray emitting gas correlates with
the dark matter halo mass (Popesso et al. 2005).
Although the overdensity parameter might be biased by redshift
effects, and probes number density rather than mass, it seems we can
further constrain the environment of radio sources. We can already see
from the overdensity estimates of the galaxies in the brightest
(
erg s-1) X-ray clusters that, although they
have a similar redshift distribution to the radio source host
galaxies, their overdensities are far higher. The overdensity around
radio sources is similar to or even lower than the overdensity found
within the lower luminosity clusters, whose halo masses are of the
order of
 (Popesso et al. 2005). These results are
consistent with previous studies in which radio source host galaxies were
found to be preferentially located in environments of moderate density
(e.g. Hill & Lilly 1991; Best 2000).
(Popesso et al. 2005). These results are
consistent with previous studies in which radio source host galaxies were
found to be preferentially located in environments of moderate density
(e.g. Hill & Lilly 1991; Best 2000).
![\begin{figure}
\par\mbox{\includegraphics[width=8.8cm,clip]{9299_019.ps}\include...
...ip]{9299_021.ps}\includegraphics[width=8.8cm,clip]{9299_022.ps} }
\end{figure}](/articles/aa/full/2008/42/aa9299-07/Timg108.gif) |
Figure 11:
Top left panel: the overdensity
parameter for the galaxies aligned with X-ray cluster emission and
field galaxies in the same redshift ranges. The overdensity
parameter appears to be quite efficient. Top right to bottom right:
the difference in overdensity parameter between the galaxies aligned with X-ray cluster emission and the field galaxies for different X-ray luminosities. In
each panel, the estimated redshift distribution of the X-ray
clusters is indicated (full line), and compared to the redshift
distribution of the radio source host galaxies (dashed line). Although our
overdensity parameter is biased by redshift, it seems that the
increase of the halo mass leads to a higher overdensity parameter
estimate. Comparing this with Fig. 9, it seems that
massive radio sources lie in rather small clusters on average. |
| Open with DEXTER |
5 Discussion and conclusions
In this paper we have carried out a series of analyses giving further
evidence that our estimates of photometric redshifts and stellar
masses for the host galaxies of the radio source sample built in
Tasse et al. (2008) are reliable. Specifically, our estimate of the
vs. radio power relation fits the SDSS measurement of
Clewley & Jarvis (2004), suggesting there should be no systematic between
the radio luminosity and the accuracies of the photometric
redshifts. Also, in the lowest redshift bin 0.1<z<0.6, the relation
betweeen the fraction of radio-loud galaxies and the stellar mass
relation is in good agreement with the SDSS
measurement
in the radio power range
P1.4>1024 W Hz-1 from
Best et al. (2005).
In Sects. 3 and 4, we investigated
the intrinsic and environmental properties of radio source host galaxies as
compared to the normal galaxy population. The sample extends up
to  ,
and across the 1.4 GHz radio power range
1024-27 W Hz-1 (see Fig. 1). The
main results are as follows:
,
and across the 1.4 GHz radio power range
1024-27 W Hz-1 (see Fig. 1). The
main results are as follows:
- (i)
- the relationship between the fraction of radio-loud
galaxies and the stellar mass shows a break in the range
 and
and
 ;
;
- (ii)
- the low stellar mass radio source host galaxies show a
stronger evolution than the high stellar mass galaxies. At
 ,
the mass function of radio source host galaxies appears to be significantly
flatter than in the local universe;
,
the mass function of radio source host galaxies appears to be significantly
flatter than in the local universe;
- (iii)
- high stellar mass radio sources are seen to be
preferentially located in poor clusters of galaxies;
- (iv)
- the environment of the low stellar mass radio sources
is biased towards large-scale
underdensities, and small-scale overdensities;
- (v)
- at
 ,
galaxies have a hot dust component
observed as an infrared excess, while the galaxies with
,
galaxies have a hot dust component
observed as an infrared excess, while the galaxies with
 do
not.
do
not.
These results suggest the existence of dichotomy in the nature of
both the hosts and environment of radio sources. We argue below
that the observed dichotomy might be caused by the different ways of
triggering the black hole activity as discussed in Sect. 1.
Best et al. (2005) used a large sample of low luminosity radio sources in
the SDSS (
)
to show that the fraction
of radio
loud galaxies scales with the galaxy stellar mass as
,
and argued that the IGM gas cooling rate  that has
the same dependence on stellar mass (
that has
the same dependence on stellar mass (
 ),
providing a way of feeding the black hole and triggering the AGN. For
our dataset, in the redshift range 0.1<z<0.6 the fraction of radio
loud galaxies show a similar dependence on the stellar masses of
galaxies. Furthermore, our result (iii) supports this picture as the
high stellar mass systems that are radio-loud are preferentially
located in large 450 kpc scale overdense environments as compared to
non-radio-loud galaxies of the same mass. This environment resembles
small clusters of galaxies with
,
in agreement
with observations of low redshift radio sources lying in moderate
groups to poor clusters (Best 2004, and references therein). In
contrast, Best et al. (2007) found that the radio-loud fraction versus
stellar mass relation flattens to
),
providing a way of feeding the black hole and triggering the AGN. For
our dataset, in the redshift range 0.1<z<0.6 the fraction of radio
loud galaxies show a similar dependence on the stellar masses of
galaxies. Furthermore, our result (iii) supports this picture as the
high stellar mass systems that are radio-loud are preferentially
located in large 450 kpc scale overdense environments as compared to
non-radio-loud galaxies of the same mass. This environment resembles
small clusters of galaxies with
,
in agreement
with observations of low redshift radio sources lying in moderate
groups to poor clusters (Best 2004, and references therein). In
contrast, Best et al. (2007) found that the radio-loud fraction versus
stellar mass relation flattens to
 for a sample
of brightest cluster galaxies (BCGs), while there is evidence that the
radio sources observed at high redshift lie in rich cluster
environments (Venemans 2006; Kurk et al. 2004; Best et al. 2003). Interestingly, in the
redshift bin 0.6<z<1.2, the radio sources with
P1.4>1025W Hz-1 show a dependence of
with the stellar mass that
flattens to
for a sample
of brightest cluster galaxies (BCGs), while there is evidence that the
radio sources observed at high redshift lie in rich cluster
environments (Venemans 2006; Kurk et al. 2004; Best et al. 2003). Interestingly, in the
redshift bin 0.6<z<1.2, the radio sources with
P1.4>1025W Hz-1 show a dependence of
with the stellar mass that
flattens to
 ,
which could be due to a
greater fraction of radio-loud galaxies that are located at the center
of galaxy clusters by .
,
which could be due to a
greater fraction of radio-loud galaxies that are located at the center
of galaxy clusters by .
Result (iv) suggests that the low stellar mass, strongly evolving
component of the radio source host galaxy population inhabit a different
environment than the radio-loud AGN with high stellar mass host
galaxies discussed above. Compared to normal galaxies of the same
mass, radio-loud galaxies preferentially lie in large scale
underdensities (450 kpc comoving), and overdensities at small scales
(75 kpc), suggesting their AGN activity may be triggered by galaxy
mergers and interactions. Similarly, ULIRGs are found to be associated
with galaxy interactions or galaxy mergers (Sect. 1),
and star forming galaxies have been shown to be preferentially located
in underdense environments, where the low velocity dispersion
conditions favour galaxy mergers and interactions
(Gómez et al. 2003; Best 2004). Furthermore the low mass radio-loud AGN in our
sample have a significant infrared excess at 3.6 m (observer
frame) as compared to non-radio-loud galaxies of the same
mass. Seymour et al. (2007) have already observed such infrared excesses
in powerful high redshift radio galaxies, and concluded that this is
due to the presence of hot (0.5-
 K) dust, heated by
an obscured, highly accreting AGN. This is consistent with AGN unified
schemes whereby these objects are radiatively efficient radio-loud
quasars viewed edge-on.
K) dust, heated by
an obscured, highly accreting AGN. This is consistent with AGN unified
schemes whereby these objects are radiatively efficient radio-loud
quasars viewed edge-on.
As discussed in Hardcastle et al. (2007), the state of the gas that
reaches the black hole might play an important role in triggering the
quasar and the radio modes (Sect. 1). The observed
environmental dichotomy reported here, with the low stellar mass
(M<1011 )
systems having a hot infrared excess, support the
picture in which the galaxy interactions or mergers trigger high
efficiency accretion, while the hot gas cooling from the atmosphere of
massive galaxies triggers the radiatively inefficient accretion of low
luminosity radio-loud AGN. It might be that the number density of
low-mass radio-loud AGN is low in the nearby Universe because the
combination of a fairly massive black hole and a galaxy merger or
interaction that can supply cold gas, are quite rare. However, these
conditions will be more common in the gas-rich early Universe, which
might explain the higher number density of low stellar mass radio-loud
AGN at higher redshift. As the large scale structure forms and the
environment of galaxies changes, the two competing mechanisms
discussed in this paper may play an important role in the evolution of
the AGN activity.
Acknowledgements
The optical images were obtained with
MegaPrime/MegaCam, a joint project of CFHT and CEA/DAPNIA, at the CFHT
which is operated by the National Research Council (NRC) of Canada,
the Institut National des Sciences de l'Univers of the Centre National
de la Recherche Scientifique (CNRS) of France and the University of
Hawaii. This work is based on data products produced at
TERAPIX and at the Canadian Astronomy Data Centre as part of the
CFHTLS, a collaborative project of NRC and CNRS.
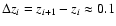
Appendix A: Overdensity estimator
The use of photometric redshifts codes is generally limited to the
determination of the values associated with the best fitting template,
which do not include multiple solutions, for example. In order
to fully use the information derived from the fitting of the magnitude
points, as described in Tasse et al. (2008), the least
was recorded as a function of the
redshifts for 200 values in 0<z<2. Following Arnouts et al. (2002),
for each object, we relate the
function to the photometric
redshift probability function p(z) as follows:
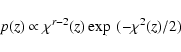 |
(A.1) |
where r is the number of degrees of freedom. Assuming that
all optical sources have their true redshift in 0<z<2,
 is
normalized to 1 over this redshift interval.
is
normalized to 1 over this redshift interval.
In order to build our overdensity parameter, we calculate the mean
number density around a chosen galaxy within an arbitrary chosen
comoving volume, using the information contained in the probability
function p(z).
A radius
is first chosen in the comoving space. It defines a comoving scale to which
the overdensity estimate refers. Overdensities over large scales may refer to galaxy clusters, whereas
smaller scales may refer to small groups of galaxies or even galaxy
pairs.
The redshift space is then binned so
that the volume V of the cone of radius
and line-of-sight
comoving length
 stays constant. We choose V so
that
stays constant. We choose V so
that
 ,
the typical error bar on
photometric redshifts (Tasse et al. 2008). This leads to
,
the typical error bar on
photometric redshifts (Tasse et al. 2008). This leads to  0.05, 0.12, 0.19, 0.28,
0.38, 0.49, 0.62, 0.76, 0.92, 1.10, 1.29
0.05, 0.12, 0.19, 0.28,
0.38, 0.49, 0.62, 0.76, 0.92, 1.10, 1.29 .
In each redshift bin icentered at
(zi+zi+1)/2, the angular diameter
.
In each redshift bin icentered at
(zi+zi+1)/2, the angular diameter
 corresponding to
is
calculated. Then, we derive
the density around the given object inside each redshift slice:
corresponding to
is
calculated. Then, we derive
the density around the given object inside each redshift slice:
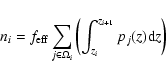 |
(A.2) |
where  is the set of the objects found
within
around the considered objects, and
is the set of the objects found
within
around the considered objects, and
 is a term designed to correct for edges
effects, for example, when the circle of diameter
is a term designed to correct for edges
effects, for example, when the circle of diameter
 overlaps
with a masking region or the edges of the field. In that case, we make the assumption that the
number density of sources within the masked area is the same as the
unmasked area within
.
We then have
overlaps
with a masking region or the edges of the field. In that case, we make the assumption that the
number density of sources within the masked area is the same as the
unmasked area within
.
We then have
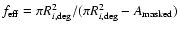 ,
with
,
with
 being the
masked area. Then, the mean density around the considered source can be written
as:
being the
masked area. Then, the mean density around the considered source can be written
as:
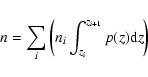 |
(A.3) |
where p(z) is the probability function of the considered
object. The estimate of n greatly depends upon the given object
probability function. In order to quantify the significance of the
number density estimate around the given object with a given
probability function, we determine the mean and standard
deviation of n (Eq. (A.3)) in a similar catalog but in the
absence of clustering. In practice, we extract a catalog in a
 square around the source in the CFHTLS-Wide
catalog, and reassign each object a uniformly distributed random position. We
make 20 realisations of such a catalog, and in each we derive the
number density
around the considered objects using
Eqs. (A.2) and (A.3). We compute the mean
and the standard deviation
of the number
density around the considered object when there is no clustering. The
overdensity is finally defined as
square around the source in the CFHTLS-Wide
catalog, and reassign each object a uniformly distributed random position. We
make 20 realisations of such a catalog, and in each we derive the
number density
around the considered objects using
Eqs. (A.2) and (A.3). We compute the mean
and the standard deviation
of the number
density around the considered object when there is no clustering. The
overdensity is finally defined as
 ,
giving us the significance of
the number density estimate.
,
giving us the significance of
the number density estimate.
- Arnaud, M., &
Evrard, A. E. 1999, MNRAS, 305, 631 [NASA ADS] [CrossRef]
(In the text)
- Arnouts, S.,
Moscardini, L., Vanzella, E., et al. 2002, MNRAS, 329,
355 [NASA ADS] [CrossRef]
(In the text)
- Avni, Y., &
Bahcall, N. A. 1976, ApJ, 209, 16 [NASA ADS] [CrossRef]
(In the text)
- Avni, Y., &
Bahcall, J. N. 1980, ApJ, 235, 694 [NASA ADS] [CrossRef]
(In the text)
- Best, P. N. 2000,
MNRAS, 317, 720 [NASA ADS] [CrossRef]
- Best, P. N. 2004,
MNRAS, 351, 70 [NASA ADS] [CrossRef]
(In the text)
- Best, P. N.,
Lehnert, M. D., Miley, G. K., & Röttgering,
H. J. A. 2003, MNRAS, 343, 1 [NASA ADS] [CrossRef]
- Best, P. N.,
Kauffmann, G., Heckman, T. M., et al. 2005, MNRAS, 362,
25 [NASA ADS] [CrossRef]
(In the text)
- Best, P. N.,
Kaiser, C. R., Heckman, T. M., & Kauffmann, G. 2006,
MNRAS, 368, L67 [NASA ADS]
- Best, P. N., von
der Linden, A., Kauffmann, G., Heckman, T. M., & Kaiser,
C. R. 2007, MNRAS, 527
(In the text)
- Clewley, L.,
& Jarvis, M. J. 2004, MNRAS, 352, 909 [NASA ADS] [CrossRef]
(In the text)
- Condon, J. J.,
Cotton, W. D., Greisen, E. W., et al. 1998, AJ, 115,
1693 [NASA ADS] [CrossRef]
- Croton, D. J.,
Farrar, G. R., Norberg, P., et al. 2005, MNRAS, 356,
1155 [NASA ADS] [CrossRef]
- Croton, D. J.,
Springel, V., White, S. D. M., et al. 2006, MNRAS,
365, 11 [NASA ADS] [CrossRef]
- Dunlop, J. S.,
& Peacock, J. A. 1990, MNRAS, 247, 19 [NASA ADS]
- Elitzur, M. 2007,
ASP Conf. Ser. 373, ed. L. C. Ho, & J.-W. Wang, 415
(In the text)
- Evans, D. A.,
Worrall, D. M., Hardcastle, M. J., Kraft, R. P.,
& Birkinshaw, M. 2006, ApJ, 642, 96 [NASA ADS] [CrossRef]
- Fontana, A.,
Pozzetti, L., Donnarumma, I., et al. 2004, A&A, 424,
23 [NASA ADS] [CrossRef] [EDP Sciences]
(In the text)
- Fontana, A.,
Salimbeni, S., Grazian, A., et al. 2006, A&A, 459,
745 [CrossRef] [EDP Sciences]
(In the text)
- Gebhardt, K.,
Bender, R., Bower, G., et al. 2000, ApJ, 539, L13 [NASA ADS] [CrossRef]
- Gómez,
P. L., Nichol, R. C., Miller, C. J., et al.
2003, ApJ, 584, 210 [NASA ADS] [CrossRef]
- Hardcastle,
M. J., Evans, D. A., & Croston, J. H. 2006,
MNRAS, 370, 1893 [NASA ADS]
- Hardcastle,
M. J., Evans, D. A., & Croston, J. H. 2007,
MNRAS, 376, 1849 [NASA ADS] [CrossRef]
- Hill, G. J., &
Lilly, S. J. 1991, ApJ, 367, 1 [NASA ADS] [CrossRef]
- Hine, R. G., &
Longair, M. S. 1979, MNRAS, 188, 111 [NASA ADS]
- Jackson, N.,
& Rawlings, S. 1997, MNRAS, 286, 241 [NASA ADS]
- Kauffmann,
G., Heckman, T. M., Tremonti, C., et al. 2003, MNRAS,
346, 1055 [NASA ADS] [CrossRef]
(In the text)
- Kurk, J. D.,
Pentericci, L., Overzier, R. A., Röttgering,
H. J. A., & Miley, G. K. 2004, A&A, 428,
817 [NASA ADS] [CrossRef] [EDP Sciences]
- Laing, R. A.,
Jenkins, C. R., Wall, J. V., & Unger, S. W.
1994, in The Physics of Active Galaxies, ed. G. V. Bicknell,
M. A. Dopita, & P. J. Quinn, ASP Conf. Ser. 54,
201
- Le Borgne, D.,
& Rocca-Volmerange, B. 2002, A&A, 386, 446 [NASA ADS] [CrossRef] [EDP Sciences]
(In the text)
- Lonsdale, C. J.,
Smith, H. E., Rowan-Robinson, M., et al. 2003, PASP, 115,
897 [NASA ADS] [CrossRef]
(In the text)
- Mathews,
W. G., & Brighenti, F. 2003, ARA&A, 41, 191 [NASA ADS] [CrossRef]
(In the text)
- Ogle, P., Whysong, D.,
& Antonucci, R. 2006, ApJ, 647, 161 [NASA ADS] [CrossRef]
- Pacaud, F., Pierre,
M., Refregier, A., et al. 2006, MNRAS, 372, 578 [NASA ADS] [CrossRef]
(In the text)
- Pacaud, F., Pierre,
M., Adami, C., et al. 2007, MNRAS, in prep.
(In the text)
- Pierre, M.,
Valtchanov, I., Altieri, B., et al. 2004, J. Cosmology
Astro-Particle Phys., 9, 11 [NASA ADS] [CrossRef]
(In the text)
- Pierre, M., Pacaud,
F., Duc, P.-A., et al. 2006, MNRAS, 372, 591 [NASA ADS] [CrossRef]
(In the text)
- Popesso, P.,
Biviano, A., Böhringer, H., Romaniello, M., & Voges, W.
2005, A&A, 433, 431 [NASA ADS] [CrossRef] [EDP Sciences]
(In the text)
- Sanders,
D. B., & Mirabel, I. F. 1996, ARA&A, 34, 749 [NASA ADS] [CrossRef]
(In the text)
- Sanders,
D. B., Soifer, B. T., Elias, J. H., et al.
1988a, ApJ, 325, 74 [NASA ADS] [CrossRef]
(In the text)
- Sanders,
D. B., Soifer, B. T., Elias, J. H., Neugebauer, G.,
& Matthews, K. 1988b, ApJ, 328, L35 [NASA ADS] [CrossRef]
(In the text)
- Schmidt, M. 1968,
ApJ, 151, 393 [NASA ADS] [CrossRef]
(In the text)
- Schmitt,
H. R. 2004, in The Interplay Among Black Holes, Stars and ISM
in Galactic Nuclei, ed. T. Storchi-Bergmann, L. C. Ho,
& H. R. Schmitt, IAU Symp., 222, 395
- Seymour, N.,
Stern, D., De Breuck, C., et al. 2007, ApJS, 171, 353 [NASA ADS] [CrossRef]
(In the text)
- Snellen,
I. A. G., & Best, P. N. 2001, MNRAS, 328,
897 [NASA ADS] [CrossRef]
(In the text)
- Springel, V.,
Di Matteo, T., & Hernquist, L. 2005a, ApJ, 620, L79 [NASA ADS] [CrossRef]
- Springel, V.,
Di Matteo, T., & Hernquist, L. 2005b, MNRAS, 361, 776 [NASA ADS] [CrossRef]
- Sutherland,
W., & Saunders, W. 1992, MNRAS, 259, 413 [NASA ADS]
(In the text)
- Tasse, C., Cohen,
A. S., Röttgering, H. J. A., et al. 2006,
A&A, 456, 791 [NASA ADS] [CrossRef] [EDP Sciences]
(In the text)
- Tasse, C., Le
Borgne, D., Röttgering, H. J. A., et al. 2008,
A&A, 490, 879 [CrossRef] [EDP Sciences]
(In the text)
- Tasse, C.,
Röttgering, H. J. A., Best, P. N., et al.
2007, A&A, 471, 1105 [NASA ADS] [CrossRef] [EDP Sciences]
(In the text)
- Veilleux, S.
2003, in Active Galactic Nuclei: From Central Engine to Host
Galaxy, ed. S. Collin, F. Combes, & I. Shlosman
ASP Conf. Ser., 290, 11
- Venemans,
B. P. 2006, Astron. Nachr. 327, 196 [NASA ADS] [CrossRef]
- Whysong, D.,
& Antonucci, R. 2004, ApJ, 602, 116 [NASA ADS] [CrossRef]
- Willott,
C. J., Rawlings, S., Blundell, K. M., Lacy, M., &
Eales, S. A. 2001, MNRAS, 322, 536 [NASA ADS] [CrossRef]
Copyright ESO 2008
![\begin{figure}
\par\includegraphics[width=9cm,clip]{9299_000.ps}
\end{figure}](/articles/aa/full/2008/42/aa9299-07/img33.gif)
![\begin{figure}
\par\includegraphics[width=18cm,clip]{9299_001.ps}
\end{figure}](/articles/aa/full/2008/42/aa9299-07/img37.gif)
![\begin{figure}
\par\includegraphics[width=18cm,clip]{9299_002.ps}
\end{figure}](/articles/aa/full/2008/42/aa9299-07/img40.gif)
![\begin{figure}
\par\includegraphics[width=9cm,clip]{9299_005.ps}\end{figure}](/articles/aa/full/2008/42/aa9299-07/img57.gif)
![\begin{figure}
\par\includegraphics[width=9cm,clip]{9299_006.ps}\end{figure}](/articles/aa/full/2008/42/aa9299-07/img58.gif)
![\begin{figure}
\par\mbox{\includegraphics[width=8.8cm,clip]{9299_007.ps}\includegraphics[width=8.8cm,clip]{9299_008.ps} }
\end{figure}](/articles/aa/full/2008/42/aa9299-07/img72.gif)
![\begin{figure}
\par\mbox{\includegraphics[width=0.49\textwidth,clip]{9299_010.ps...
..._012.ps}\includegraphics[width=0.49\textwidth,clip]{9299_013.ps} }\end{figure}](/articles/aa/full/2008/42/aa9299-07/img73.gif)
![\begin{figure}
\par\mbox{\includegraphics[width=8cm,clip]{9299_014.ps}\includegraphics[width=8cm,clip]{9299_015.ps} }
\end{figure}](/articles/aa/full/2008/42/aa9299-07/img82.gif)
![\begin{figure}
\par\includegraphics[width=8.8cm,clip]{9299_018.ps}
\end{figure}](/articles/aa/full/2008/42/aa9299-07/img99.gif)
![\begin{figure}
\par\mbox{\includegraphics[width=8.8cm,clip]{9299_019.ps}\include...
...ip]{9299_021.ps}\includegraphics[width=8.8cm,clip]{9299_022.ps} }
\end{figure}](/articles/aa/full/2008/42/aa9299-07/img108.gif)