 |
Figure 1:
The temperature of the neutral fluid, |
| Open with DEXTER | |
In the text
 |
Figure 2:
The integrated intensity of the SiO(5-4) line,
|
| Open with DEXTER | |
In the text
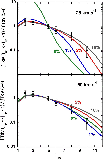 |
Figure 3:
The integrated intensities of rotational transitions of SiO, relative to the (5-4) line, in stationary C-type shock waves:
|
| Open with DEXTER | |
In the text
| |
Figure 4:
Profiles of the SiO rotational transitions (2-1), (3-2), (5-4),
(6-5), (8-7), and (10-9) computed in stationary C-type shock waves, for
|
| Open with DEXTER | |
In the text
 |
Figure 5:
Profiles of the CJ-type shocks specified in Sect. 3.1. The corresponding steady-state C-type shock models are shown also. Left-hand panels:
|
| Open with DEXTER | |
In the text
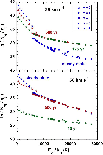 |
Figure 6: Synthetic H2 excitation diagrams for the CJ-type shocks specified in Sect. 3.1. |
| Open with DEXTER | |
In the text
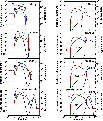 |
Figure 7:
The temperature of the neutral fluid, |
| Open with DEXTER | |
In the text
 |
Figure 8:
The integrated intensities,
|
| Open with DEXTER | |
In the text
 |
Figure 9:
Integrated SiO line intensities, relative to the (5-4) transition, for the CJ-type shock model in which
|
| Open with DEXTER | |
In the text
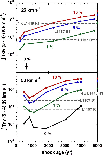 |
Figure 10:
The integrated intensity of the SiO(5-4) line,
|
| Open with DEXTER | |
In the text
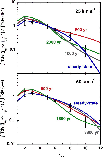 |
Figure 11:
Integrated SiO line intensities, relative to the (5-4) transition, for the CJ-type shock models in which
|
| Open with DEXTER | |
In the text
 |
Figure 12:
Composite H2 excitation diagrams, corrected for reddening with
|
| Open with DEXTER | |
In the text
 |
Figure 13:
The observed and calculated values of the H2 0-0 S(5) emission line flux, plotted as functions of the mean excitation temperature of the rotational lines within the v = 0 vibrational ground state. The corresponding values of the column density per magnetic sub-level are given on the right-hand axis for the
(v = 0, j = 7) emitting level, whose degeneracy is g7 = 45. Results are given for L1157 B1, as observed by ISO (two separate pixels, pix1 and pix2) and for a series of models of (stationary) C-type (b = 1) shock waves (red curve) for ranges of the shock speed, |
| Open with DEXTER | |
In the text
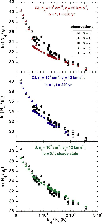 |
Figure 14:
Three models of the H2 excitation diagram of L1157 B1:
CJ-type
|
| Open with DEXTER | |
In the text
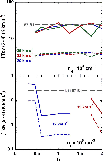 |
Figure 15:
The integrated intensity of the SiO(5-4) line,
|
| Open with DEXTER | |
In the text
 |
Figure 16:
The best-fitting models of the H2 and SiO observations of L1157 B1: CJ-type shocks for which
|
| Open with DEXTER | |
In the text
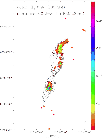 |
Figure A.1:
A map of the L1157 outflow (Cabrit et al. 1999) obtained
with ISOCAM in a narrow filter (
|
| Open with DEXTER | |
In the text
 |
Figure A.2:
Left panel: the LW3 ISOCAM image of the southern blue lobe of L1157 superposed on the SiO (2-1) contours of Gueth et al. (1998).
Right panel: the LW2 ISOCAM image of the southern blue lobe of L1157 superposed on the contours of the H2 2.12 |
| Open with DEXTER | |
In the text
 |
Figure B.1:
The integrated intensities of the CO rotational lines,
|
| Open with DEXTER | |
In the text